
We need to view the top X ports on switches which have used the most traffic (in & out) for a given time. I haven't been able to find this view. Is there a way to see this or will we have to create a special page to view this?
Justin

Click on the Traffic column on the ports page.
Regards,
SG
On 12/11/2014 11:08 AM, Justin Miller wrote:
We need to view the top X ports on switches which have used the most traffic (in & out) for a given time. I haven't been able to find this view. Is there a way to see this or will we have to create a special page to view this?
Justin _______________________________________________ observium mailing list observium@observium.org http://postman.memetic.org/cgi-bin/mailman/listinfo/observium
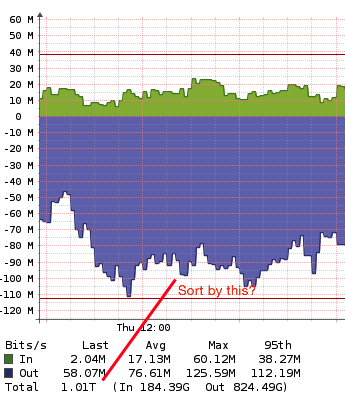
That appears to be instantaneous amount when the poller collected it. I need how many bytes total. Not how many bits per second.
I need to see that this port downloaded 3.4 TB of data, not that it’s doing 7 megabits per second.
Justin
On Dec 11, 2014, at 1:12 PM, Spencer Gaw spencerg@frii.net wrote:
Click on the Traffic column on the ports page.
Regards,
SG
On 12/11/2014 11:08 AM, Justin Miller wrote:
We need to view the top X ports on switches which have used the most traffic (in & out) for a given time. I haven't been able to find this view. Is there a way to see this or will we have to create a special page to view this?
Justin _______________________________________________ observium mailing list observium@observium.org mailto:observium@observium.org http://postman.memetic.org/cgi-bin/mailman/listinfo/observium http://postman.memetic.org/cgi-bin/mailman/listinfo/observium
observium mailing list observium@observium.org mailto:observium@observium.org http://postman.memetic.org/cgi-bin/mailman/listinfo/observium http://postman.memetic.org/cgi-bin/mailman/listinfo/observium
Make a bill for all ports on each switch?
Regards,
SG
On 12/11/2014 11:17 AM, Justin Miller wrote:
That appears to be instantaneous amount when the poller collected it. I need how many bytes total. Not how many bits per second.
I need to see that this port downloaded 3.4 TB of data, not that it’s doing 7 megabits per second.
Justin
On Dec 11, 2014, at 1:12 PM, Spencer Gaw <spencerg@frii.net mailto:spencerg@frii.net> wrote:
Click on the Traffic column on the ports page.
Regards,
SG
On 12/11/2014 11:08 AM, Justin Miller wrote:
We need to view the top X ports on switches which have used the most traffic (in & out) for a given time. I haven't been able to find this view. Is there a way to see this or will we have to create a special page to view this?
Justin _______________________________________________ observium mailing list observium@observium.org mailto:observium@observium.org http://postman.memetic.org/cgi-bin/mailman/listinfo/observium
observium mailing list observium@observium.org mailto:observium@observium.org http://postman.memetic.org/cgi-bin/mailman/listinfo/observium
observium mailing list observium@observium.org http://postman.memetic.org/cgi-bin/mailman/listinfo/observium

Total in what time frame? Day, week, month, year, decade? Whence would this information come?
No, doing this isn't really realistically possible to do in a non-slow way (or useful)
adam.
------ Original Message ------ From: "Justin Miller" observium@dynstatic.net To: "Observium Network Observation System" observium@observium.org Sent: 12/11/2014 12:17:56 PM Subject: Re: [Observium] Sort ports based on total data usage
That appears to be instantaneous amount when the poller collected it. I need how many bytes total. Not how many bits per second.
I need to see that this port downloaded 3.4 TB of data, not that it’s doing 7 megabits per second.
Justin
On Dec 11, 2014, at 1:12 PM, Spencer Gaw spencerg@frii.net wrote:
Click on the Traffic column on the ports page.
Regards,
SG
On 12/11/2014 11:08 AM, Justin Miller wrote:
We need to view the top X ports on switches which have used the most traffic (in & out) for a given time. I haven't been able to find this view. Is there a way to see this or will we have to create a special page to view this?
Justin _______________________________________________ observium mailing list observium@observium.org http://postman.memetic.org/cgi-bin/mailman/listinfo/observium
observium mailing list observium@observium.org http://postman.memetic.org/cgi-bin/mailman/listinfo/observium
This information is already in the RRD file is it not? Can’t you export the numerical value for the TOTAL from the graph for each port and then sort based on that?
It does not have to be 100% accurate, I’m not billing for it. I just need to see what the top 10 busiest ports are on a switch.
On Dec 12, 2014, at 2:24 AM, Adam Armstrong adama@memetic.org wrote:
Total in what time frame? Day, week, month, year, decade? Whence would this information come?
No, doing this isn't really realistically possible to do in a non-slow way (or useful)
adam.
------ Original Message ------ From: "Justin Miller" <observium@dynstatic.net mailto:observium@dynstatic.net> To: "Observium Network Observation System" <observium@observium.org mailto:observium@observium.org> Sent: 12/11/2014 12:17:56 PM Subject: Re: [Observium] Sort ports based on total data usage
That appears to be instantaneous amount when the poller collected it. I need how many bytes total. Not how many bits per second.
I need to see that this port downloaded 3.4 TB of data, not that it’s doing 7 megabits per second.
Justin
On Dec 11, 2014, at 1:12 PM, Spencer Gaw <spencerg@frii.net mailto:spencerg@frii.net> wrote:
Click on the Traffic column on the ports page.
Regards,
SG
On 12/11/2014 11:08 AM, Justin Miller wrote:
We need to view the top X ports on switches which have used the most traffic (in & out) for a given time. I haven't been able to find this view. Is there a way to see this or will we have to create a special page to view this?
Justin _______________________________________________ observium mailing list observium@observium.org mailto:observium@observium.org http://postman.memetic.org/cgi-bin/mailman/listinfo/observium http://postman.memetic.org/cgi-bin/mailman/listinfo/observium
observium mailing list observium@observium.org mailto:observium@observium.org http://postman.memetic.org/cgi-bin/mailman/listinfo/observium http://postman.memetic.org/cgi-bin/mailman/listinfo/observium
observium mailing list observium@observium.org mailto:observium@observium.org http://postman.memetic.org/cgi-bin/mailman/listinfo/observium http://postman.memetic.org/cgi-bin/mailman/listinfo/observium

It will take about 15 minutes to generate that page, then.
On 12/12/2014 04:14 PM, Justin Miller wrote:
This information is already in the RRD file is it not? Can’t you export the numerical value for the TOTAL from the graph for each port and then sort based on that?
It does not have to be 100% accurate, I’m not billing for it. I just need to see what the top 10 busiest ports are on a switch.
On Dec 12, 2014, at 2:24 AM, Adam Armstrong <adama@memetic.org mailto:adama@memetic.org> wrote:
Total in what time frame? Day, week, month, year, decade? Whence would this information come? No, doing this isn't really realistically possible to do in a non-slow way (or useful) adam. ------ Original Message ------ From: "Justin Miller" <observium@dynstatic.net mailto:observium@dynstatic.net> To: "Observium Network Observation System" <observium@observium.org mailto:observium@observium.org> Sent: 12/11/2014 12:17:56 PM Subject: Re: [Observium] Sort ports based on total data usage
That appears to be instantaneous amount when the poller collected it. I need how many bytes total. Not how many bits per second.
I need to see that this port downloaded 3.4 TB of data, not that it’s doing 7 megabits per second.
Justin
On Dec 11, 2014, at 1:12 PM, Spencer Gaw <spencerg@frii.net mailto:spencerg@frii.net> wrote:
Click on the Traffic column on the ports page.
Regards,
SG
On 12/11/2014 11:08 AM, Justin Miller wrote:
We need to view the top X ports on switches which have used the most traffic (in & out) for a given time. I haven't been able to find this view. Is there a way to see this or will we have to create a special page to view this?
Justin _______________________________________________ observium mailing list observium@observium.org mailto:observium@observium.org http://postman.memetic.org/cgi-bin/mailman/listinfo/observium
observium mailing list observium@observium.org mailto:observium@observium.org http://postman.memetic.org/cgi-bin/mailman/listinfo/observium
observium mailing list observium@observium.org mailto:observium@observium.org http://postman.memetic.org/cgi-bin/mailman/listinfo/observium
observium mailing list observium@observium.org http://postman.memetic.org/cgi-bin/mailman/listinfo/observium
Because it’s a round robin database and it has to sum the octlets for that given time, right?
Doesn’t the poller read how many packets have been send or received on every port anyways? ifOutOclets / ifInOclets ? Isn’t that a running total? Then to get the rate you take the difference between the current poll and the last poll and divide it by the time between polls?
There has to be an OID for this which would be easy to store at poll time, right?
Justin
On Dec 12, 2014, at 10:50 AM, Tom Laermans tom.laermans@powersource.cx wrote:
It will take about 15 minutes to generate that page, then.
On 12/12/2014 04:14 PM, Justin Miller wrote:
This information is already in the RRD file is it not? Can’t you export the numerical value for the TOTAL from the graph for each port and then sort based on that?
It does not have to be 100% accurate, I’m not billing for it. I just need to see what the top 10 busiest ports are on a switch.
<Mail Attachment.png>
On Dec 12, 2014, at 2:24 AM, Adam Armstrong <adama@memetic.org mailto:adama@memetic.org> wrote:
Total in what time frame? Day, week, month, year, decade? Whence would this information come?
No, doing this isn't really realistically possible to do in a non-slow way (or useful)
adam.
------ Original Message ------ From: "Justin Miller" <observium@dynstatic.net mailto:observium@dynstatic.net> To: "Observium Network Observation System" <observium@observium.org mailto:observium@observium.org> Sent: 12/11/2014 12:17:56 PM Subject: Re: [Observium] Sort ports based on total data usage
That appears to be instantaneous amount when the poller collected it. I need how many bytes total. Not how many bits per second.
I need to see that this port downloaded 3.4 TB of data, not that it’s doing 7 megabits per second.
Justin
On Dec 11, 2014, at 1:12 PM, Spencer Gaw <spencerg@frii.net mailto:spencerg@frii.net> wrote:
Click on the Traffic column on the ports page.
Regards,
SG
On 12/11/2014 11:08 AM, Justin Miller wrote:
We need to view the top X ports on switches which have used the most traffic (in & out) for a given time. I haven't been able to find this view. Is there a way to see this or will we have to create a special page to view this?
Justin _______________________________________________ observium mailing list observium@observium.org mailto:observium@observium.org http://postman.memetic.org/cgi-bin/mailman/listinfo/observium http://postman.memetic.org/cgi-bin/mailman/listinfo/observium
observium mailing list observium@observium.org mailto:observium@observium.org http://postman.memetic.org/cgi-bin/mailman/listinfo/observium http://postman.memetic.org/cgi-bin/mailman/listinfo/observium
observium mailing list observium@observium.org mailto:observium@observium.org http://postman.memetic.org/cgi-bin/mailman/listinfo/observium http://postman.memetic.org/cgi-bin/mailman/listinfo/observium
observium mailing list observium@observium.org mailto:observium@observium.org http://postman.memetic.org/cgi-bin/mailman/listinfo/observium http://postman.memetic.org/cgi-bin/mailman/listinfo/observium
observium mailing list observium@observium.org http://postman.memetic.org/cgi-bin/mailman/listinfo/observium
Nope.
On 12/12/2014 06:11 PM, Justin Miller wrote:
Because it’s a round robin database and it has to sum the octlets for that given time, right?
Doesn’t the poller read how many packets have been send or received on every port anyways? ifOutOclets / ifInOclets ? Isn’t that a running total? Then to get the rate you take the difference between the current poll and the last poll and divide it by the time between polls?
There has to be an OID for this which would be easy to store at poll time, right?
Justin
On Dec 12, 2014, at 10:50 AM, Tom Laermans <tom.laermans@powersource.cx mailto:tom.laermans@powersource.cx> wrote:
It will take about 15 minutes to generate that page, then.
On 12/12/2014 04:14 PM, Justin Miller wrote:
This information is already in the RRD file is it not? Can’t you export the numerical value for the TOTAL from the graph for each port and then sort based on that?
It does not have to be 100% accurate, I’m not billing for it. I just need to see what the top 10 busiest ports are on a switch.
<Mail Attachment.png>
On Dec 12, 2014, at 2:24 AM, Adam Armstrong <adama@memetic.org mailto:adama@memetic.org> wrote:
Total in what time frame? Day, week, month, year, decade? Whence would this information come? No, doing this isn't really realistically possible to do in a non-slow way (or useful) adam. ------ Original Message ------ From: "Justin Miller" <observium@dynstatic.net mailto:observium@dynstatic.net> To: "Observium Network Observation System" <observium@observium.org mailto:observium@observium.org> Sent: 12/11/2014 12:17:56 PM Subject: Re: [Observium] Sort ports based on total data usage
That appears to be instantaneous amount when the poller collected it. I need how many bytes total. Not how many bits per second.
I need to see that this port downloaded 3.4 TB of data, not that it’s doing 7 megabits per second.
Justin
On Dec 11, 2014, at 1:12 PM, Spencer Gaw <spencerg@frii.net mailto:spencerg@frii.net> wrote:
Click on the Traffic column on the ports page.
Regards,
SG
On 12/11/2014 11:08 AM, Justin Miller wrote: > We need to view the top X ports on switches which have used the > most traffic (in & out) for a given time. I haven't been able to > find this view. Is there a way to see this or will we have to > create a special page to view this? > > Justin > _______________________________________________ > observium mailing list > observium@observium.org mailto:observium@observium.org > http://postman.memetic.org/cgi-bin/mailman/listinfo/observium
observium mailing list observium@observium.org mailto:observium@observium.org http://postman.memetic.org/cgi-bin/mailman/listinfo/observium
observium mailing list observium@observium.org mailto:observium@observium.org http://postman.memetic.org/cgi-bin/mailman/listinfo/observium
observium mailing list observium@observium.org http://postman.memetic.org/cgi-bin/mailman/listinfo/observium
observium mailing list observium@observium.org mailto:observium@observium.org http://postman.memetic.org/cgi-bin/mailman/listinfo/observium
observium mailing list observium@observium.org http://postman.memetic.org/cgi-bin/mailman/listinfo/observium
In the db observium.ports-state, there is ifInOctlets, ifInOctlets_delta, and ifInOctets_rate. It’s also there for ifOutOctlets, ifOutOctlets_delta, and ifOutOctets_rate. So the values I want are already in the database.
Furthermore, when the html/pages/devie/port.inc.php invokes includes/print-interface.inc.php to print each interface, $port contains those values.
Hacking it into the view
   '<i class="icon-circle-arrow-down" style="',$port['bps_in_style'], '"></i> <span class="small" style="',$port['bps_in_style'], '">' , formatStorage($port['ifInOctets']) , '</span><br />',
   '<i class="icon-circle-arrow-up"   style="',$port['bps_out_style'],'"></i> <span class="small" style="',$port['bps_out_style'],'">' , formatStorage($port['ifOutOctets']) , '</span><br />',
Produces somewhat correct results which are good enough for what I need. I just need to sort it now. Maybe make a new page.
On Dec 12, 2014, at 12:19 PM, Tom Laermans tom.laermans@powersource.cx wrote:
Nope.
On 12/12/2014 06:11 PM, Justin Miller wrote:
Because it’s a round robin database and it has to sum the octlets for that given time, right?
Doesn’t the poller read how many packets have been send or received on every port anyways? ifOutOclets / ifInOclets ? Isn’t that a running total? Then to get the rate you take the difference between the current poll and the last poll and divide it by the time between polls?
There has to be an OID for this which would be easy to store at poll time, right?
Justin
On Dec 12, 2014, at 10:50 AM, Tom Laermans <tom.laermans@powersource.cx mailto:tom.laermans@powersource.cx> wrote:
It will take about 15 minutes to generate that page, then.
On 12/12/2014 04:14 PM, Justin Miller wrote:
This information is already in the RRD file is it not? Can’t you export the numerical value for the TOTAL from the graph for each port and then sort based on that?
It does not have to be 100% accurate, I’m not billing for it. I just need to see what the top 10 busiest ports are on a switch.
<Mail Attachment.png>
On Dec 12, 2014, at 2:24 AM, Adam Armstrong <adama@memetic.org mailto:adama@memetic.org> wrote:
Total in what time frame? Day, week, month, year, decade? Whence would this information come?
No, doing this isn't really realistically possible to do in a non-slow way (or useful)
adam.
------ Original Message ------ From: "Justin Miller" <observium@dynstatic.net mailto:observium@dynstatic.net> To: "Observium Network Observation System" <observium@observium.org mailto:observium@observium.org> Sent: 12/11/2014 12:17:56 PM Subject: Re: [Observium] Sort ports based on total data usage
That appears to be instantaneous amount when the poller collected it. I need how many bytes total. Not how many bits per second.
I need to see that this port downloaded 3.4 TB of data, not that it’s doing 7 megabits per second.
Justin
> On Dec 11, 2014, at 1:12 PM, Spencer Gaw <spencerg@frii.net mailto:spencerg@frii.net> wrote: > > Click on the Traffic column on the ports page. > > Regards, > > SG > > On 12/11/2014 11:08 AM, Justin Miller wrote: >> We need to view the top X ports on switches which have used the most traffic (in & out) for a given time. I haven't been able to find this view. Is there a way to see this or will we have to create a special page to view this? >> >> Justin >> _______________________________________________ >> observium mailing list >> observium@observium.org mailto:observium@observium.org >> http://postman.memetic.org/cgi-bin/mailman/listinfo/observium http://postman.memetic.org/cgi-bin/mailman/listinfo/observium > > _______________________________________________ > observium mailing list > observium@observium.org mailto:observium@observium.org > http://postman.memetic.org/cgi-bin/mailman/listinfo/observium http://postman.memetic.org/cgi-bin/mailman/listinfo/observium
observium mailing list observium@observium.org mailto:observium@observium.org http://postman.memetic.org/cgi-bin/mailman/listinfo/observium http://postman.memetic.org/cgi-bin/mailman/listinfo/observium
observium mailing list observium@observium.org mailto:observium@observium.org http://postman.memetic.org/cgi-bin/mailman/listinfo/observium http://postman.memetic.org/cgi-bin/mailman/listinfo/observium
observium mailing list observium@observium.org mailto:observium@observium.org http://postman.memetic.org/cgi-bin/mailman/listinfo/observium http://postman.memetic.org/cgi-bin/mailman/listinfo/observium
observium mailing list observium@observium.org mailto:observium@observium.org http://postman.memetic.org/cgi-bin/mailman/listinfo/observium http://postman.memetic.org/cgi-bin/mailman/listinfo/observium
observium mailing list observium@observium.org http://postman.memetic.org/cgi-bin/mailman/listinfo/observium
Hm.. Well... you have an odd requirement if your wish is to see how many bytes were transferred on a port since the device rebooted or the counter wrapped. But ok... if it works for you... :-)
Tom
On 12/12/2014 20:21, Justin Miller wrote:
In the db observium.ports-state, there is ifInOctlets, ifInOctlets_delta, and ifInOctets_rate. It's also there for ifOutOctlets, ifOutOctlets_delta, and ifOutOctets_rate. So the values I want are already in the database.
Furthermore, when the html/pages/devie/port.inc.php invokes includes/print-interface.inc.php to print each interface, $port contains those values.
Hacking it into the view
'<i class="icon-circle-arrow-down"style="',$port['bps_in_style'], '"></i> <span class="small" style="',$port['bps_in_style'], '">' , formatStorage($port['ifInOctets']) , '</span><br />', '<i class="icon-circle-arrow-up" style="',$port['bps_out_style'],'"></i> <span class="small" style="',$port['bps_out_style'],'">' , formatStorage($port['ifOutOctets']) , '</span><br />',
Produces somewhat correct results which are good enough for what I need. I just need to sort it now. Maybe make a new page.
On Dec 12, 2014, at 12:19 PM, Tom Laermans <tom.laermans@powersource.cx mailto:tom.laermans@powersource.cx> wrote:
Nope.
On 12/12/2014 06:11 PM, Justin Miller wrote:
Because it's a round robin database and it has to sum the octlets for that given time, right?
Doesn't the poller read how many packets have been send or received on every port anyways? ifOutOclets / ifInOclets ? Isn't that a running total? Then to get the rate you take the difference between the current poll and the last poll and divide it by the time between polls?
There has to be an OID for this which would be easy to store at poll time, right?
Justin
On Dec 12, 2014, at 10:50 AM, Tom Laermans <tom.laermans@powersource.cx mailto:tom.laermans@powersource.cx> wrote:
It will take about 15 minutes to generate that page, then.
On 12/12/2014 04:14 PM, Justin Miller wrote:
This information is already in the RRD file is it not? Can't you export the numerical value for the TOTAL from the graph for each port and then sort based on that?
It does not have to be 100% accurate, I'm not billing for it. I just need to see what the top 10 busiest ports are on a switch.
<Mail Attachment.png>
On Dec 12, 2014, at 2:24 AM, Adam Armstrong <adama@memetic.org mailto:adama@memetic.org> wrote:
Total in what time frame? Day, week, month, year, decade? Whence would this information come? No, doing this isn't really realistically possible to do in a non-slow way (or useful) adam. ------ Original Message ------ From: "Justin Miller" <observium@dynstatic.net mailto:observium@dynstatic.net> To: "Observium Network Observation System" <observium@observium.org mailto:observium@observium.org> Sent: 12/11/2014 12:17:56 PM Subject: Re: [Observium] Sort ports based on total data usage > That appears to be instantaneous amount when the poller > collected it. I need how many bytes total. Not how many bits per > second. > > I need to see that this port downloaded 3.4 TB of data, not that > it's doing 7 megabits per second. > > Justin > >> On Dec 11, 2014, at 1:12 PM, Spencer Gaw <spencerg@frii.net >> mailto:spencerg@frii.net> wrote: >> >> Click on the Traffic column on the ports page. >> >> Regards, >> >> SG >> >> On 12/11/2014 11:08 AM, Justin Miller wrote: >>> We need to view the top X ports on switches which have used >>> the most traffic (in & out) for a given time. I haven't been >>> able to find this view. Is there a way to see this or will we >>> have to create a special page to view this? >>> >>> Justin >>> _______________________________________________ >>> observium mailing list >>> observium@observium.org mailto:observium@observium.org >>> http://postman.memetic.org/cgi-bin/mailman/listinfo/observium >> >> _______________________________________________ >> observium mailing list >> observium@observium.org mailto:observium@observium.org >> http://postman.memetic.org/cgi-bin/mailman/listinfo/observium > _______________________________________________ observium mailing list observium@observium.org mailto:observium@observium.org http://postman.memetic.org/cgi-bin/mailman/listinfo/observium
observium mailing list observium@observium.org http://postman.memetic.org/cgi-bin/mailman/listinfo/observium
observium mailing list observium@observium.org mailto:observium@observium.org http://postman.memetic.org/cgi-bin/mailman/listinfo/observium
observium mailing list observium@observium.org http://postman.memetic.org/cgi-bin/mailman/listinfo/observium
observium mailing list observium@observium.org mailto:observium@observium.org http://postman.memetic.org/cgi-bin/mailman/listinfo/observium
observium mailing list observium@observium.org http://postman.memetic.org/cgi-bin/mailman/listinfo/observium

It makes sense, though. Track down heavy users when you don't need the granularity of billing.
----- Mike Hammett Intelligent Computing Solutions http://www.ics-il.com
----- Original Message -----
From: "Tom Laermans" tom.laermans@powersource.cx To: "Observium Network Observation System" observium@observium.org Sent: Saturday, December 13, 2014 7:58:42 AM Subject: Re: [Observium] Sort ports based on total data usage
Hm.. Well... you have an odd requirement if your wish is to see how many bytes were transferred on a port since the device rebooted or the counter wrapped. But ok... if it works for you... :-)
Tom
On 12/12/2014 20:21, Justin Miller wrote:
In the db observium.ports-state, there is ifInOctlets, ifInOctlets_delta, and ifInOctets_rate. It’s also there for ifOutOctlets, ifOutOctlets_delta, and ifOutOctets_rate. So the values I want are already in the database.
Furthermore, when the html/pages/devie/port.inc.php invokes includes/print-interface.inc.php to print each interface, $port contains those values.
Hacking it into the view
'<i class="icon-circle-arrow-down" style="',$port['bps_in_style'], '"></i> <span class="small" style="',$port['bps_in_style'], '">' , formatStorage($port['ifInOctets']) , '</span><br />', '<i class="icon-circle-arrow-up" style="',$port['bps_out_style'],'"></i> <span class="small" style="',$port['bps_out_style'],'">' , formatStorage($port['ifOutOctets']) , '</span><br />',
Produces somewhat correct results which are good enough for what I need. I just need to sort it now. Maybe make a new page.
<blockquote>
On Dec 12, 2014, at 12:19 PM, Tom Laermans < tom.laermans@powersource.cx > wrote:
Nope.
On 12/12/2014 06:11 PM, Justin Miller wrote:
<blockquote> Because it’s a round robin database and it has to sum the octlets for that given time, right?
Doesn’t the poller read how many packets have been send or received on every port anyways? ifOutOclets / ifInOclets ? Isn’t that a running total? Then to get the rate you take the difference between the current poll and the last poll and divide it by the time between polls?
There has to be an OID for this which would be easy to store at poll time, right?
Justin
<blockquote>
On Dec 12, 2014, at 10:50 AM, Tom Laermans < tom.laermans@powersource.cx > wrote:
It will take about 15 minutes to generate that page, then.
On 12/12/2014 04:14 PM, Justin Miller wrote:
<blockquote>
This information is already in the RRD file is it not? Can’t you export the numerical value for the TOTAL from the graph for each port and then sort based on that?
It does not have to be 100% accurate, I’m not billing for it. I just need to see what the top 10 busiest ports are on a switch.
<Mail Attachment.png>
<blockquote>
On Dec 12, 2014, at 2:24 AM, Adam Armstrong < adama@memetic.org > wrote:
Total in what time frame? Day, week, month, year, decade? Whence would this information come?
No, doing this isn't really realistically possible to do in a non-slow way (or useful)
adam.
------ Original Message ------ From: "Justin Miller" < observium@dynstatic.net > To: "Observium Network Observation System" < observium@observium.org > Sent: 12/11/2014 12:17:56 PM Subject: Re: [Observium] Sort ports based on total data usage
<blockquote> That appears to be instantaneous amount when the poller collected it. I need how many bytes total. Not how many bits per second.
I need to see that this port downloaded 3.4 TB of data, not that it’s doing 7 megabits per second.
Justin
<blockquote>
On Dec 11, 2014, at 1:12 PM, Spencer Gaw < spencerg@frii.net > wrote:
Click on the Traffic column on the ports page.
Regards,
SG
On 12/11/2014 11:08 AM, Justin Miller wrote:
<blockquote> We need to view the top X ports on switches which have used the most traffic (in & out) for a given time. I haven't been able to find this view. Is there a way to see this or will we have to create a special page to view this?
Justin _______________________________________________ observium mailing list observium@observium.org http://postman.memetic.org/cgi-bin/mailman/listinfo/observium
_______________________________________________ observium mailing list observium@observium.org http://postman.memetic.org/cgi-bin/mailman/listinfo/observium </blockquote>
</blockquote> _______________________________________________ observium mailing list observium@observium.org http://postman.memetic.org/cgi-bin/mailman/listinfo/observium </blockquote>
_______________________________________________ observium mailing list observium@observium.org http://postman.memetic.org/cgi-bin/mailman/listinfo/observium </blockquote>
_______________________________________________ observium mailing list observium@observium.org http://postman.memetic.org/cgi-bin/mailman/listinfo/observium
</blockquote>
_______________________________________________ observium mailing list observium@observium.org http://postman.memetic.org/cgi-bin/mailman/listinfo/observium </blockquote>
_______________________________________________ observium mailing list observium@observium.org http://postman.memetic.org/cgi-bin/mailman/listinfo/observium
That number is in the database to calculate rates. It's functionally useless unless you know when the counter was last reset.
It isn't exposed in the UI precisely because it's such a functionally useless number.
What /might/ be vaguely useful would be calculating an average traffic rate for the port by tracking the "last reset" time for the counter. But even then, this is only really useful if the port has *always* been active for the uptime of the switch. It would take literally weeks for a port flatlining 1GB to overtake a port which had been pushing 100mbit for a few months.
There are other possibilities, such as storing a series of values at various timepoints so we can "sort of" give a value like "xbps over the past 24 hours", but these get terribly inefficient and slow, especially considering that we're using MEMORY tables to hold this data, and pretty irritating things happen when those tables fill up.
I don't think exposing a value which is only comparable with other ports on the same device active for the same amount of time which haven't had their counters reset is particularly useful (and seems particularly confusing).
adam.
------ Original Message ------ From: "Justin Miller" observium@dynstatic.net To: "Observium Network Observation System" observium@observium.org Sent: 12/12/2014 1:21:55 PM Subject: Re: [Observium] Sort ports based on total data usage
In the db observium.ports-state, there is ifInOctlets, ifInOctlets_delta, and ifInOctets_rate. It’s also there for ifOutOctlets, ifOutOctlets_delta, and ifOutOctets_rate. So the values I want are already in the database.
Furthermore, when the html/pages/devie/port.inc.php invokes includes/print-interface.inc.php to print each interface, $port contains those values.
Hacking it into the view
'<i class="icon-circle-arrow-down"style="',$port['bps_in_style'], '"></i> <span class="small" style="',$port['bps_in_style'], '">' , formatStorage($port['ifInOctets']) , '</span><br />', '<i class="icon-circle-arrow-up" style="',$port['bps_out_style'],'"></i> <span class="small" style="',$port['bps_out_style'],'">' , formatStorage($port['ifOutOctets']) , '</span><br />',
Produces somewhat correct results which are good enough for what I need. I just need to sort it now. Maybe make a new page.
On Dec 12, 2014, at 12:19 PM, Tom Laermans tom.laermans@powersource.cx wrote:
Nope.
On 12/12/2014 06:11 PM, Justin Miller wrote:
Because it’s a round robin database and it has to sum the octlets for that given time, right?
Doesn’t the poller read how many packets have been send or received on every port anyways? ifOutOclets / ifInOclets ? Isn’t that a running total? Then to get the rate you take the difference between the current poll and the last poll and divide it by the time between polls?
There has to be an OID for this which would be easy to store at poll time, right?
Justin
On Dec 12, 2014, at 10:50 AM, Tom Laermans tom.laermans@powersource.cx wrote:
It will take about 15 minutes to generate that page, then.
On 12/12/2014 04:14 PM, Justin Miller wrote:
This information is already in the RRD file is it not? Can’t you export the numerical value for the TOTAL from the graph for each port and then sort based on that?
It does not have to be 100% accurate, I’m not billing for it. I just need to see what the top 10 busiest ports are on a switch.
<Mail Attachment.png>
On Dec 12, 2014, at 2:24 AM, Adam Armstrong adama@memetic.org wrote:
Total in what time frame? Day, week, month, year, decade? Whence would this information come?
No, doing this isn't really realistically possible to do in a non-slow way (or useful)
adam.
------ Original Message ------ From: "Justin Miller" observium@dynstatic.net To: "Observium Network Observation System" observium@observium.org Sent: 12/11/2014 12:17:56 PM Subject: Re: [Observium] Sort ports based on total data usage
>That appears to be instantaneous amount when the poller collected >it. I need how many bytes total. Not how many bits per second. > >I need to see that this port downloaded 3.4 TB of data, not that >it’s doing 7 megabits per second. > >Justin > >>On Dec 11, 2014, at 1:12 PM, Spencer Gaw spencerg@frii.net >>wrote: >> >>Click on the Traffic column on the ports page. >> >>Regards, >> >>SG >> >>On 12/11/2014 11:08 AM, Justin Miller wrote: >>>We need to view the top X ports on switches which have used the >>>most traffic (in & out) for a given time. I haven't been able >>>to find this view. Is there a way to see this or will we have >>>to create a special page to view this? >>> >>>Justin >>>_______________________________________________ >>>observium mailing list >>>observium@observium.org >>>http://postman.memetic.org/cgi-bin/mailman/listinfo/observium >> >>_______________________________________________ >>observium mailing list >>observium@observium.org >>http://postman.memetic.org/cgi-bin/mailman/listinfo/observium > _______________________________________________ observium mailing list observium@observium.org http://postman.memetic.org/cgi-bin/mailman/listinfo/observium
_______________________________________________ observium mailing list observium@observium.orghttp://postman.memetic.org/cgi-bin/mailman/listinfo/observium
observium mailing list observium@observium.org http://postman.memetic.org/cgi-bin/mailman/listinfo/observium
_______________________________________________ observium mailing list observium@observium.orghttp://postman.memetic.org/cgi-bin/mailman/listinfo/observium
observium mailing list observium@observium.org http://postman.memetic.org/cgi-bin/mailman/listinfo/observium

I'll second what Adam is saying - whats in the DB is not anywhere remotely useful like you think. Maybe sort of on a single device but even then dubious at best. Your option is really to have to total every RRD file over the timeframe wished in order to get a result, which isn't going to be very fast. My biggest Observium installation is (IMO) very small and is still ~30G of RRD data. You'd end up scanning a good portion of that 30G to come up with a sort order/totalling. One of the big switches is ~4G by itself, loading it's ports page is.....ugly pulling in all the mini graphs, but at least the basic view is up fast. Loading all the mini graphs after that...I'm not sure how long that takes, I've never waited around for it to finish, at least a couple minutes I'd imagine. It'd be around that timeframe to produce a sorted list and spit out the main view. Granted that switch is probably pretty close to a worst case in terms of port count.
On Sat, Dec 13, 2014 at 7:04 PM, Adam Armstrong adama@memetic.org wrote:
That number is in the database to calculate rates. It's functionally useless unless you know when the counter was last reset.
It isn't exposed in the UI precisely because it's such a functionally useless number.
What /might/ be vaguely useful would be calculating an average traffic rate for the port by tracking the "last reset" time for the counter. But even then, this is only really useful if the port has *always* been active for the uptime of the switch. It would take literally weeks for a port flatlining 1GB to overtake a port which had been pushing 100mbit for a few months.
There are other possibilities, such as storing a series of values at various timepoints so we can "sort of" give a value like "xbps over the past 24 hours", but these get terribly inefficient and slow, especially considering that we're using MEMORY tables to hold this data, and pretty irritating things happen when those tables fill up.
I don't think exposing a value which is only comparable with other ports on the same device active for the same amount of time which haven't had their counters reset is particularly useful (and seems particularly confusing).
adam.
------ Original Message ------ From: "Justin Miller" observium@dynstatic.net To: "Observium Network Observation System" observium@observium.org Sent: 12/12/2014 1:21:55 PM Subject: Re: [Observium] Sort ports based on total data usage
In the db observium.ports-state, there is ifInOctlets, ifInOctlets_delta, and ifInOctets_rate. It’s also there for ifOutOctlets, ifOutOctlets_delta, and ifOutOctets_rate. So the values I want are already in the database.
Furthermore, when the html/pages/devie/port.inc.php invokes includes/print-interface.inc.php to print each interface, $port contains those values.
Hacking it into the view
'<i class="icon-circle-arrow-down"style="',$port['bps_in_style'], '"></i> <span class="small" style="',$port['bps_in_style'], '">' , formatStorage($port['ifInOctets']) , '</span><br />', '<i class="icon-circle-arrow-up" style="',$port['bps_out_style'],'"></i> <span class="small" style="',$port['bps_out_style'],'">' , formatStorage($port['ifOutOctets']) , '</span><br />',
Produces somewhat correct results which are good enough for what I need. I just need to sort it now. Maybe make a new page.
On Dec 12, 2014, at 12:19 PM, Tom Laermans tom.laermans@powersource.cx wrote:
Nope.
On 12/12/2014 06:11 PM, Justin Miller wrote:
Because it’s a round robin database and it has to sum the octlets for that given time, right?
Doesn’t the poller read how many packets have been send or received on every port anyways? ifOutOclets / ifInOclets ? Isn’t that a running total? Then to get the rate you take the difference between the current poll and the last poll and divide it by the time between polls?
There has to be an OID for this which would be easy to store at poll time, right?
Justin
On Dec 12, 2014, at 10:50 AM, Tom Laermans tom.laermans@powersource.cx wrote:
It will take about 15 minutes to generate that page, then.
On 12/12/2014 04:14 PM, Justin Miller wrote:
This information is already in the RRD file is it not? Can’t you export the numerical value for the TOTAL from the graph for each port and then sort based on that?
It does not have to be 100% accurate, I’m not billing for it. I just need to see what the top 10 busiest ports are on a switch.
<Mail Attachment.png>
On Dec 12, 2014, at 2:24 AM, Adam Armstrong adama@memetic.org wrote:
Total in what time frame? Day, week, month, year, decade? Whence would this information come?
No, doing this isn't really realistically possible to do in a non-slow way (or useful)
adam.
------ Original Message ------ From: "Justin Miller" observium@dynstatic.net To: "Observium Network Observation System" observium@observium.org Sent: 12/11/2014 12:17:56 PM Subject: Re: [Observium] Sort ports based on total data usage
That appears to be instantaneous amount when the poller collected it. I need how many bytes total. Not how many bits per second.
I need to see that this port downloaded 3.4 TB of data, not that it’s doing 7 megabits per second.
Justin
On Dec 11, 2014, at 1:12 PM, Spencer Gaw spencerg@frii.net wrote:
Click on the Traffic column on the ports page.
Regards,
SG
On 12/11/2014 11:08 AM, Justin Miller wrote:
We need to view the top X ports on switches which have used the most traffic (in & out) for a given time. I haven't been able to find this view. Is there a way to see this or will we have to create a special page to view this?
Justin _______________________________________________ observium mailing list observium@observium.org http://postman.memetic.org/cgi-bin/mailman/listinfo/observium
observium mailing list observium@observium.org http://postman.memetic.org/cgi-bin/mailman/listinfo/observium
observium mailing list observium@observium.org http://postman.memetic.org/cgi-bin/mailman/listinfo/observium
observium mailing listobservium@observium.orghttp://postman.memetic.org/cgi-bin/mailman/listinfo/observium
observium mailing list observium@observium.org http://postman.memetic.org/cgi-bin/mailman/listinfo/observium
observium mailing listobservium@observium.orghttp://postman.memetic.org/cgi-bin/mailman/listinfo/observium
observium mailing list observium@observium.org http://postman.memetic.org/cgi-bin/mailman/listinfo/observium
observium mailing list observium@observium.org http://postman.memetic.org/cgi-bin/mailman/listinfo/observium
So.
I ran a test to see how quickly we could extract the "traffic in the last 24 hours" statistic from rrdtool for all ports on my development install :
root@omega:/mnt/ramdisk/observium_dev# time for file in `ls */port-*.rrd | grep -v adsl | grep -v dot3 | xargs`; do rrdtool graphv /dev/null DEF:outoctets=$file:OUTOCTETS:AVERAGE DEF:inoctets=$file:INOCTETS:AVERAGE CDEF:octets=inoctets,outoctets,+ VDEF:totin=inoctets,TOTAL VDEF:totout=outoctets,TOTAL PRINT:totin:"%4.2lf" PRINT:totout:"%4.2lf"; done
real 0m10.953s user 0m3.526s sys 0m7.670s
root@omega:/mnt/ramdisk/observium_dev# ls */port-*.rrd | grep -v adsl | grep -v dot3 | wc -l 3327
I'm running from a ramdisk though, so it would be nice if some other people with large non-ramdisk installs could see how long this takes :)
adam.
------ Original Message ------ From: "Michael Loftis" mloftis@wgops.com To: "Adam Armstrong" adama@memetic.org; "Observium Network Observation System" observium@observium.org Sent: 12/13/2014 11:20:19 PM Subject: Re: [Observium] Sort ports based on total data usage
I'll second what Adam is saying - whats in the DB is not anywhere remotely useful like you think. Maybe sort of on a single device but even then dubious at best. Your option is really to have to total every RRD file over the timeframe wished in order to get a result, which isn't going to be very fast. My biggest Observium installation is (IMO) very small and is still ~30G of RRD data. You'd end up scanning a good portion of that 30G to come up with a sort order/totalling. One of the big switches is ~4G by itself, loading it's ports page is.....ugly pulling in all the mini graphs, but at least the basic view is up fast. Loading all the mini graphs after that...I'm not sure how long that takes, I've never waited around for it to finish, at least a couple minutes I'd imagine. It'd be around that timeframe to produce a sorted list and spit out the main view. Granted that switch is probably pretty close to a worst case in terms of port count.
On Sat, Dec 13, 2014 at 7:04 PM, Adam Armstrong adama@memetic.org wrote:
That number is in the database to calculate rates. It's functionally useless unless you know when the counter was last reset.
It isn't exposed in the UI precisely because it's such a functionally useless number.
What /might/ be vaguely useful would be calculating an average traffic rate for the port by tracking the "last reset" time for the counter. But even then, this is only really useful if the port has *always* been active for the uptime of the switch. It would take literally weeks for a port flatlining 1GB to overtake a port which had been pushing 100mbit for a few months.
There are other possibilities, such as storing a series of values at various timepoints so we can "sort of" give a value like "xbps over the past 24 hours", but these get terribly inefficient and slow, especially considering that we're using MEMORY tables to hold this data, and pretty irritating things happen when those tables fill up.
I don't think exposing a value which is only comparable with other ports on the same device active for the same amount of time which haven't had their counters reset is particularly useful (and seems particularly confusing).
adam.
------ Original Message ------ From: "Justin Miller" observium@dynstatic.net To: "Observium Network Observation System" observium@observium.org Sent: 12/12/2014 1:21:55 PM Subject: Re: [Observium] Sort ports based on total data usage
In the db observium.ports-state, there is ifInOctlets, ifInOctlets_delta, and ifInOctets_rate. It’s also there for ifOutOctlets, ifOutOctlets_delta, and ifOutOctets_rate. So the values I want are already in the database.
Furthermore, when the html/pages/devie/port.inc.php invokes includes/print-interface.inc.php to print each interface, $port contains those values.
Hacking it into the view
'<i class="icon-circle-arrow-down"style="',$port['bps_in_style'], '"></i> <span class="small" style="',$port['bps_in_style'], '">' , formatStorage($port['ifInOctets']) , '</span><br />', '<i class="icon-circle-arrow-up" style="',$port['bps_out_style'],'"></i> <span class="small" style="',$port['bps_out_style'],'">' , formatStorage($port['ifOutOctets']) , '</span><br />',
Produces somewhat correct results which are good enough for what I need. I just need to sort it now. Maybe make a new page.
On Dec 12, 2014, at 12:19 PM, Tom Laermans tom.laermans@powersource.cx wrote:
Nope.
On 12/12/2014 06:11 PM, Justin Miller wrote:
Because it’s a round robin database and it has to sum the octlets for that given time, right?
Doesn’t the poller read how many packets have been send or received on every port anyways? ifOutOclets / ifInOclets ? Isn’t that a running total? Then to get the rate you take the difference between the current poll and the last poll and divide it by the time between polls?
There has to be an OID for this which would be easy to store at poll time, right?
Justin
On Dec 12, 2014, at 10:50 AM, Tom Laermans tom.laermans@powersource.cx wrote:
It will take about 15 minutes to generate that page, then.
On 12/12/2014 04:14 PM, Justin Miller wrote: >This information is already in the RRD file is it not? Can’t you >export the numerical value for the TOTAL from the graph for each >port and then sort based on that? > >It does not have to be 100% accurate, I’m not billing for it. I >just need to see what the top 10 busiest ports are on a switch. > > ><Mail Attachment.png> > > >>On Dec 12, 2014, at 2:24 AM, Adam Armstrong adama@memetic.org >>wrote: >> >>Total in what time frame? Day, week, month, year, decade? Whence >>would this information come? >> >>No, doing this isn't really realistically possible to do in a >>non-slow way (or useful) >> >>adam. >> >>------ Original Message ------ >>From: "Justin Miller" observium@dynstatic.net >>To: "Observium Network Observation System" >>observium@observium.org >>Sent: 12/11/2014 12:17:56 PM >>Subject: Re: [Observium] Sort ports based on total data usage >> >>>That appears to be instantaneous amount when the poller >>>collected it. I need how many bytes total. Not how many bits >>>per second. >>> >>>I need to see that this port downloaded 3.4 TB of data, not >>>that it’s doing 7 megabits per second. >>> >>>Justin >>> >>>>On Dec 11, 2014, at 1:12 PM, Spencer Gaw spencerg@frii.net >>>>wrote: >>>> >>>>Click on the Traffic column on the ports page. >>>> >>>>Regards, >>>> >>>>SG >>>> >>>>On 12/11/2014 11:08 AM, Justin Miller wrote: >>>>>We need to view the top X ports on switches which have used >>>>>the most traffic (in & out) for a given time. I haven't been >>>>>able to find this view. Is there a way to see this or will we >>>>>have to create a special page to view this? >>>>> >>>>>Justin >>>>>_______________________________________________ >>>>>observium mailing list >>>>>observium@observium.org >>>>>http://postman.memetic.org/cgi-bin/mailman/listinfo/observium >>>> >>>>_______________________________________________ >>>>observium mailing list >>>>observium@observium.org >>>>http://postman.memetic.org/cgi-bin/mailman/listinfo/observium >>> >>_______________________________________________ >>observium mailing list >>observium@observium.org >>http://postman.memetic.org/cgi-bin/mailman/listinfo/observium > > > >_______________________________________________ observium mailing >list >observium@observium.orghttp://postman.memetic.org/cgi-bin/mailman/listinfo/observium
observium mailing list observium@observium.org http://postman.memetic.org/cgi-bin/mailman/listinfo/observium
_______________________________________________ observium mailing list observium@observium.orghttp://postman.memetic.org/cgi-bin/mailman/listinfo/observium
observium mailing list observium@observium.org http://postman.memetic.org/cgi-bin/mailman/listinfo/observium
observium mailing list observium@observium.org http://postman.memetic.org/cgi-bin/mailman/listinfo/observium
--
"Genius might be described as a supreme capacity for getting its possessors into trouble of all kinds." -- Samuel Butler

On Sat, Dec 13, 2014 at 10:41 PM, Adam Armstrong adama@memetic.org wrote:
some other people with large non-ramdisk installs could see how long this takes :)
Here's the times for my install. [07:44:57] [/opt/observium/rrd ] $ time for file in `\ls */port-*.rrd | xargs`; do rrdtool graphv /dev/null DEF:outoctets=$file:OUTOCTETS:AVERAGE DEF:inoctets=$file:INOCTETS:AVERAGE CDEF:octets=inoctets,outoctets,+ VDEF:totin=inoctets,TOTAL VDEF:totout=outoctets,TOTAL PRINT:totin:"%4.2lf" PRINT:totout:"%4.2lf"; done
real 1m55.605s user 0m2.644s sys 0m13.117s
[07:45:43] [/opt/observium/rrd ] $ \ls */port-*.rrd | grep -v adsl | grep -v dot3 | wc -l 26156
bt
Takes around 15s wall time - my data set fits entirely in RAM/cache on this box (atime is off as well as some other tweaks) - i'm not using as much CPU as yours Adam so my box definitely differs in some other ways too. I'm not sure what the straight-from-disk performance would be. Just stat-ing in that manner is ~6s -- several runs produced timings of as low as ~14s and as high as ~18s.
4977 files found by the ls there on my install. I've a much smaller one but it's just my home stuff.
real 0m15.276s user 0m0.210s sys 0m1.630s
On Sat, Dec 13, 2014 at 10:41 PM, Adam Armstrong adama@memetic.org wrote:
So.
I ran a test to see how quickly we could extract the "traffic in the last 24 hours" statistic from rrdtool for all ports on my development install :
root@omega:/mnt/ramdisk/observium_dev# time for file in `ls */port-*.rrd | grep -v adsl | grep -v dot3 | xargs`; do rrdtool graphv /dev/null DEF:outoctets=$file:OUTOCTETS:AVERAGE DEF:inoctets=$file:INOCTETS:AVERAGE CDEF:octets=inoctets,outoctets,+ VDEF:totin=inoctets,TOTAL VDEF:totout=outoctets,TOTAL PRINT:totin:"%4.2lf" PRINT:totout:"%4.2lf"; done
real 0m10.953s user 0m3.526s sys 0m7.670s
root@omega:/mnt/ramdisk/observium_dev# ls */port-*.rrd | grep -v adsl | grep -v dot3 | wc -l 3327
I'm running from a ramdisk though, so it would be nice if some other people with large non-ramdisk installs could see how long this takes :)
adam.
------ Original Message ------ From: "Michael Loftis" mloftis@wgops.com To: "Adam Armstrong" adama@memetic.org; "Observium Network Observation System" observium@observium.org Sent: 12/13/2014 11:20:19 PM Subject: Re: [Observium] Sort ports based on total data usage
I'll second what Adam is saying - whats in the DB is not anywhere remotely useful like you think. Maybe sort of on a single device but even then dubious at best. Your option is really to have to total every RRD file over the timeframe wished in order to get a result, which isn't going to be very fast. My biggest Observium installation is (IMO) very small and is still ~30G of RRD data. You'd end up scanning a good portion of that 30G to come up with a sort order/totalling. One of the big switches is ~4G by itself, loading it's ports page is.....ugly pulling in all the mini graphs, but at least the basic view is up fast. Loading all the mini graphs after that...I'm not sure how long that takes, I've never waited around for it to finish, at least a couple minutes I'd imagine. It'd be around that timeframe to produce a sorted list and spit out the main view. Granted that switch is probably pretty close to a worst case in terms of port count.
On Sat, Dec 13, 2014 at 7:04 PM, Adam Armstrong adama@memetic.org wrote:
That number is in the database to calculate rates. It's functionally useless unless you know when the counter was last reset.
It isn't exposed in the UI precisely because it's such a functionally useless number.
What /might/ be vaguely useful would be calculating an average traffic rate for the port by tracking the "last reset" time for the counter. But even then, this is only really useful if the port has *always* been active for the uptime of the switch. It would take literally weeks for a port flatlining 1GB to overtake a port which had been pushing 100mbit for a few months.
There are other possibilities, such as storing a series of values at various timepoints so we can "sort of" give a value like "xbps over the past 24 hours", but these get terribly inefficient and slow, especially considering that we're using MEMORY tables to hold this data, and pretty irritating things happen when those tables fill up.
I don't think exposing a value which is only comparable with other ports on the same device active for the same amount of time which haven't had their counters reset is particularly useful (and seems particularly confusing).
adam.
------ Original Message ------ From: "Justin Miller" observium@dynstatic.net To: "Observium Network Observation System" observium@observium.org Sent: 12/12/2014 1:21:55 PM Subject: Re: [Observium] Sort ports based on total data usage
In the db observium.ports-state, there is ifInOctlets, ifInOctlets_delta, and ifInOctets_rate. It’s also there for ifOutOctlets, ifOutOctlets_delta, and ifOutOctets_rate. So the values I want are already in the database.
Furthermore, when the html/pages/devie/port.inc.php invokes includes/print-interface.inc.php to print each interface, $port contains those values.
Hacking it into the view
'<i class="icon-circle-arrow-down"style="',$port['bps_in_style'], '"></i> <span class="small" style="',$port['bps_in_style'], '">' , formatStorage($port['ifInOctets']) , '</span><br />', '<i class="icon-circle-arrow-up" style="',$port['bps_out_style'],'"></i> <span class="small" style="',$port['bps_out_style'],'">' , formatStorage($port['ifOutOctets']) , '</span><br />',
Produces somewhat correct results which are good enough for what I need. I just need to sort it now. Maybe make a new page.
On Dec 12, 2014, at 12:19 PM, Tom Laermans tom.laermans@powersource.cx wrote:
Nope.
On 12/12/2014 06:11 PM, Justin Miller wrote:
Because it’s a round robin database and it has to sum the octlets for that given time, right?
Doesn’t the poller read how many packets have been send or received on every port anyways? ifOutOclets / ifInOclets ? Isn’t that a running total? Then to get the rate you take the difference between the current poll and the last poll and divide it by the time between polls?
There has to be an OID for this which would be easy to store at poll time, right?
Justin
On Dec 12, 2014, at 10:50 AM, Tom Laermans tom.laermans@powersource.cx wrote:
It will take about 15 minutes to generate that page, then.
On 12/12/2014 04:14 PM, Justin Miller wrote:
This information is already in the RRD file is it not? Can’t you export the numerical value for the TOTAL from the graph for each port and then sort based on that?
It does not have to be 100% accurate, I’m not billing for it. I just need to see what the top 10 busiest ports are on a switch.
<Mail Attachment.png>
On Dec 12, 2014, at 2:24 AM, Adam Armstrong adama@memetic.org wrote:
Total in what time frame? Day, week, month, year, decade? Whence would this information come?
No, doing this isn't really realistically possible to do in a non-slow way (or useful)
adam.
------ Original Message ------ From: "Justin Miller" observium@dynstatic.net To: "Observium Network Observation System" observium@observium.org Sent: 12/11/2014 12:17:56 PM Subject: Re: [Observium] Sort ports based on total data usage
That appears to be instantaneous amount when the poller collected it. I need how many bytes total. Not how many bits per second.
I need to see that this port downloaded 3.4 TB of data, not that it’s doing 7 megabits per second.
Justin
On Dec 11, 2014, at 1:12 PM, Spencer Gaw spencerg@frii.net wrote:
Click on the Traffic column on the ports page.
Regards,
SG
On 12/11/2014 11:08 AM, Justin Miller wrote:
We need to view the top X ports on switches which have used the most traffic (in & out) for a given time. I haven't been able to find this view. Is there a way to see this or will we have to create a special page to view this?
Justin _______________________________________________ observium mailing list observium@observium.org http://postman.memetic.org/cgi-bin/mailman/listinfo/observium
observium mailing list observium@observium.org http://postman.memetic.org/cgi-bin/mailman/listinfo/observium
observium mailing list observium@observium.org http://postman.memetic.org/cgi-bin/mailman/listinfo/observium
observium mailing listobservium@observium.orghttp://postman.memetic.org/cgi-bin/mailman/listinfo/observium
observium mailing list observium@observium.org http://postman.memetic.org/cgi-bin/mailman/listinfo/observium
observium mailing listobservium@observium.orghttp://postman.memetic.org/cgi-bin/mailman/listinfo/observium
observium mailing list observium@observium.org http://postman.memetic.org/cgi-bin/mailman/listinfo/observium
observium mailing list observium@observium.org http://postman.memetic.org/cgi-bin/mailman/listinfo/observium
--
"Genius might be described as a supreme capacity for getting its possessors into trouble of all kinds." -- Samuel Butler
observium mailing list observium@observium.org http://postman.memetic.org/cgi-bin/mailman/listinfo/observium
Those values seem sufficient enough for what the OP wanted. He wanted to know what ports on a switch were the busiest. Unless someone is resetting these manually, these numbers will tell him that. If the port flapping causes these to reset, then they're not likely to be among the busiest ports anyway. It simply wouldn't be up enough to be busy.
----- Mike Hammett Intelligent Computing Solutions http://www.ics-il.com
----- Original Message -----
From: "Adam Armstrong" adama@memetic.org To: "Observium Network Observation System" observium@observium.org Sent: Saturday, December 13, 2014 9:04:41 PM Subject: Re: [Observium] Sort ports based on total data usage
That number is in the database to calculate rates. It's functionally useless unless you know when the counter was last reset.
It isn't exposed in the UI precisely because it's such a functionally useless number.
What /might/ be vaguely useful would be calculating an average traffic rate for the port by tracking the "last reset" time for the counter. But even then, this is only really useful if the port has *always* been active for the uptime of the switch. It would take literally weeks for a port flatlining 1GB to overtake a port which had been pushing 100mbit for a few months.
There are other possibilities, such as storing a series of values at various timepoints so we can "sort of" give a value like "xbps over the past 24 hours", but these get terribly inefficient and slow, especially considering that we're using MEMORY tables to hold this data, and pretty irritating things happen when those tables fill up.
I don't think exposing a value which is only comparable with other ports on the same device active for the same amount of time which haven't had their counters reset is particularly useful (and seems particularly confusing).
adam.
------ Original Message ------ From: "Justin Miller" < observium@dynstatic.net > To: "Observium Network Observation System" < observium@observium.org > Sent: 12/12/2014 1:21:55 PM Subject: Re: [Observium] Sort ports based on total data usage
In the db observium.ports-state, there is ifInOctlets, ifInOctlets_delta, and ifInOctets_rate. It’s also there for ifOutOctlets, ifOutOctlets_delta, and ifOutOctets_rate. So the values I want are already in the database.
Furthermore, when the html/pages/devie/port.inc.php invokes includes/print-interface.inc.php to print each interface, $port contains those values.
Hacking it into the view
'<i class="icon-circle-arrow-down" style="',$port['bps_in_style'], '"></i> <span class="small" style="',$port['bps_in_style'], '">' , formatStorage($port['ifInOctets']) , '</span><br />', '<i class="icon-circle-arrow-up" style="',$port['bps_out_style'],'"></i> <span class="small" style="',$port['bps_out_style'],'">' , formatStorage($port['ifOutOctets']) , '</span><br />',
Produces somewhat correct results which are good enough for what I need. I just need to sort it now. Maybe make a new page.
<blockquote>
On Dec 12, 2014, at 12:19 PM, Tom Laermans < tom.laermans@powersource.cx > wrote:
Nope.
On 12/12/2014 06:11 PM, Justin Miller wrote:
<blockquote> Because it’s a round robin database and it has to sum the octlets for that given time, right?
Doesn’t the poller read how many packets have been send or received on every port anyways? ifOutOclets / ifInOclets ? Isn’t that a running total? Then to get the rate you take the difference between the current poll and the last poll and divide it by the time between polls?
There has to be an OID for this which would be easy to store at poll time, right?
Justin
<blockquote>
On Dec 12, 2014, at 10:50 AM, Tom Laermans < tom.laermans@powersource.cx > wrote:
It will take about 15 minutes to generate that page, then.
On 12/12/2014 04:14 PM, Justin Miller wrote:
<blockquote>
This information is already in the RRD file is it not? Can’t you export the numerical value for the TOTAL from the graph for each port and then sort based on that?
It does not have to be 100% accurate, I’m not billing for it. I just need to see what the top 10 busiest ports are on a switch.
<Mail Attachment.png>
<blockquote>
On Dec 12, 2014, at 2:24 AM, Adam Armstrong < adama@memetic.org > wrote:
Total in what time frame? Day, week, month, year, decade? Whence would this information come?
No, doing this isn't really realistically possible to do in a non-slow way (or useful)
adam.
------ Original Message ------ From: "Justin Miller" < observium@dynstatic.net > To: "Observium Network Observation System" < observium@observium.org > Sent: 12/11/2014 12:17:56 PM Subject: Re: [Observium] Sort ports based on total data usage
<blockquote> That appears to be instantaneous amount when the poller collected it. I need how many bytes total. Not how many bits per second.
I need to see that this port downloaded 3.4 TB of data, not that it’s doing 7 megabits per second.
Justin
<blockquote>
On Dec 11, 2014, at 1:12 PM, Spencer Gaw < spencerg@frii.net > wrote:
Click on the Traffic column on the ports page.
Regards,
SG
On 12/11/2014 11:08 AM, Justin Miller wrote:
<blockquote> We need to view the top X ports on switches which have used the most traffic (in & out) for a given time. I haven't been able to find this view. Is there a way to see this or will we have to create a special page to view this?
Justin _______________________________________________ observium mailing list observium@observium.org http://postman.memetic.org/cgi-bin/mailman/listinfo/observium
_______________________________________________ observium mailing list observium@observium.org http://postman.memetic.org/cgi-bin/mailman/listinfo/observium </blockquote>
</blockquote> _______________________________________________ observium mailing list observium@observium.org http://postman.memetic.org/cgi-bin/mailman/listinfo/observium </blockquote>
_______________________________________________ observium mailing list observium@observium.org http://postman.memetic.org/cgi-bin/mailman/listinfo/observium </blockquote>
_______________________________________________ observium mailing list observium@observium.org http://postman.memetic.org/cgi-bin/mailman/listinfo/observium
</blockquote>
_______________________________________________ observium mailing list observium@observium.org http://postman.memetic.org/cgi-bin/mailman/listinfo/observium </blockquote>
_______________________________________________ observium mailing list observium@observium.org http://postman.memetic.org/cgi-bin/mailman/listinfo/observium
</blockquote>
</blockquote>
_______________________________________________ observium mailing list observium@observium.org http://postman.memetic.org/cgi-bin/mailman/listinfo/observium
Adam/Tom,
Thank you for looking into this so deeply. I know your time is valuable.
These switch ports are just apartment internet users with home wifi routers. Being able to see how much each port has done since last port reset is good enough for what I need to do. The hogs will stand out. I only need to see this on one device at a time so I’m going to just duplicate that page and get it to sort on that value.
Justin
On Dec 13, 2014, at 10:04 PM, Adam Armstrong adama@memetic.org wrote:
That number is in the database to calculate rates. It's functionally useless unless you know when the counter was last reset.
It isn't exposed in the UI precisely because it's such a functionally useless number.
What /might/ be vaguely useful would be calculating an average traffic rate for the port by tracking the "last reset" time for the counter. But even then, this is only really useful if the port has *always* been active for the uptime of the switch. It would take literally weeks for a port flatlining 1GB to overtake a port which had been pushing 100mbit for a few months.
There are other possibilities, such as storing a series of values at various timepoints so we can "sort of" give a value like "xbps over the past 24 hours", but these get terribly inefficient and slow, especially considering that we're using MEMORY tables to hold this data, and pretty irritating things happen when those tables fill up.
I don't think exposing a value which is only comparable with other ports on the same device active for the same amount of time which haven't had their counters reset is particularly useful (and seems particularly confusing).
adam.
------ Original Message ------ From: "Justin Miller" <observium@dynstatic.net mailto:observium@dynstatic.net> To: "Observium Network Observation System" <observium@observium.org mailto:observium@observium.org> Sent: 12/12/2014 1:21:55 PM Subject: Re: [Observium] Sort ports based on total data usage
In the db observium.ports-state, there is ifInOctlets, ifInOctlets_delta, and ifInOctets_rate. It’s also there for ifOutOctlets, ifOutOctlets_delta, and ifOutOctets_rate. So the values I want are already in the database.
Furthermore, when the html/pages/devie/port.inc.php invokes includes/print-interface.inc.php to print each interface, $port contains those values.
Hacking it into the view
'<i class="icon-circle-arrow-down" style="',$port['bps_in_style'], '"></i> <span class="small" style="',$port['bps_in_style'], '">' , formatStorage($port['ifInOctets']) , '</span><br />', '<i class="icon-circle-arrow-up" style="',$port['bps_out_style'],'"></i> <span class="small" style="',$port['bps_out_style'],'">' , formatStorage($port['ifOutOctets']) , '</span><br />',Produces somewhat correct results which are good enough for what I need. I just need to sort it now. Maybe make a new page.
<Screenshot 2014-12-12 14.11.20.png>
On Dec 12, 2014, at 12:19 PM, Tom Laermans <tom.laermans@powersource.cx mailto:tom.laermans@powersource.cx> wrote:
Nope.
On 12/12/2014 06:11 PM, Justin Miller wrote:
Because it’s a round robin database and it has to sum the octlets for that given time, right?
Doesn’t the poller read how many packets have been send or received on every port anyways? ifOutOclets / ifInOclets ? Isn’t that a running total? Then to get the rate you take the difference between the current poll and the last poll and divide it by the time between polls?
There has to be an OID for this which would be easy to store at poll time, right?
Justin
On Dec 12, 2014, at 10:50 AM, Tom Laermans <tom.laermans@powersource.cx mailto:tom.laermans@powersource.cx> wrote:
It will take about 15 minutes to generate that page, then.
On 12/12/2014 04:14 PM, Justin Miller wrote:
This information is already in the RRD file is it not? Can’t you export the numerical value for the TOTAL from the graph for each port and then sort based on that?
It does not have to be 100% accurate, I’m not billing for it. I just need to see what the top 10 busiest ports are on a switch.
<Mail Attachment.png>
> On Dec 12, 2014, at 2:24 AM, Adam Armstrong <adama@memetic.org mailto:adama@memetic.org> wrote: > > Total in what time frame? Day, week, month, year, decade? Whence would this information come? > > No, doing this isn't really realistically possible to do in a non-slow way (or useful) > > adam. > > ------ Original Message ------ > From: "Justin Miller" <observium@dynstatic.net mailto:observium@dynstatic.net> > To: "Observium Network Observation System" <observium@observium.org mailto:observium@observium.org> > Sent: 12/11/2014 12:17:56 PM > Subject: Re: [Observium] Sort ports based on total data usage > >> That appears to be instantaneous amount when the poller collected it. I need how many bytes total. Not how many bits per second. >> >> I need to see that this port downloaded 3.4 TB of data, not that it’s doing 7 megabits per second. >> >> Justin >> >>> On Dec 11, 2014, at 1:12 PM, Spencer Gaw <spencerg@frii.net mailto:spencerg@frii.net> wrote: >>> >>> Click on the Traffic column on the ports page. >>> >>> Regards, >>> >>> SG >>> >>> On 12/11/2014 11:08 AM, Justin Miller wrote: >>>> We need to view the top X ports on switches which have used the most traffic (in & out) for a given time. I haven't been able to find this view. Is there a way to see this or will we have to create a special page to view this? >>>> >>>> Justin >>>> _______________________________________________ >>>> observium mailing list >>>> observium@observium.org mailto:observium@observium.org >>>> http://postman.memetic.org/cgi-bin/mailman/listinfo/observium http://postman.memetic.org/cgi-bin/mailman/listinfo/observium >>> >>> _______________________________________________ >>> observium mailing list >>> observium@observium.org mailto:observium@observium.org >>> http://postman.memetic.org/cgi-bin/mailman/listinfo/observium http://postman.memetic.org/cgi-bin/mailman/listinfo/observium > _______________________________________________ > observium mailing list > observium@observium.org mailto:observium@observium.org > http://postman.memetic.org/cgi-bin/mailman/listinfo/observium http://postman.memetic.org/cgi-bin/mailman/listinfo/observium
observium mailing list observium@observium.org mailto:observium@observium.org http://postman.memetic.org/cgi-bin/mailman/listinfo/observium http://postman.memetic.org/cgi-bin/mailman/listinfo/observium
observium mailing list observium@observium.org mailto:observium@observium.org http://postman.memetic.org/cgi-bin/mailman/listinfo/observium http://postman.memetic.org/cgi-bin/mailman/listinfo/observium
observium mailing list observium@observium.org mailto:observium@observium.org http://postman.memetic.org/cgi-bin/mailman/listinfo/observium http://postman.memetic.org/cgi-bin/mailman/listinfo/observium
observium mailing list observium@observium.org mailto:observium@observium.org http://postman.memetic.org/cgi-bin/mailman/listinfo/observium http://postman.memetic.org/cgi-bin/mailman/listinfo/observium
observium mailing list observium@observium.org mailto:observium@observium.org http://postman.memetic.org/cgi-bin/mailman/listinfo/observium http://postman.memetic.org/cgi-bin/mailman/listinfo/observium
participants (7)
-
 Adam Armstrong
 -
 bt
bt -
 Justin Miller
 -
 Michael Loftis
 -
 Mike Hammett
 -
 Spencer Gaw
 -
 Tom Laermans