[observium] Graphs has white spaces and not continuous

Hi,
I'm having a problem with the graphs of all my devices in observium (screenshots attached). What is the advisable crontab settings should I use given the list of devices I am polling? for the list of devices it is in attachment 1
Here are the details of my environment.
*Observium* 0.13.7.4172 *Apache* 2.2.15 (CentOS) *PHP* 5.3.3 *MySQL* 5.1.69 *RRDtool* 1.3.8
Crontab settings: */10 * * * * root /opt/observium/poller-wrapper.py 1 >> /dev/null 2>&1 */10 * * * * root /opt/observium/poller.php -h all >> /dev/null 2>&1
Recent output of TOP: top - 00:44:01 up 1 day, 18:35, 1 user, load average: 2.89, 2.26, 2.24 Tasks: 187 total, 5 running, 182 sleeping, 0 stopped, 0 zombie Cpu(s): 13.1%us, 65.9%sy, 0.0%ni, 20.5%id, 0.2%wa, 0.0%hi, 0.3%si, 0.0%st Mem: 5059868k total, 905692k used, 4154176k free, 153836k buffers Swap: 4161528k total, 0k used, 4161528k free, 481076k cached
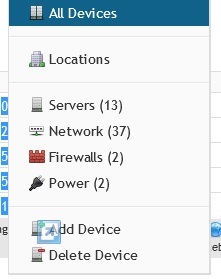
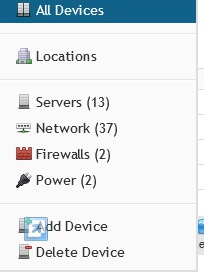
Attachment 1: observium1.jpg list of devices
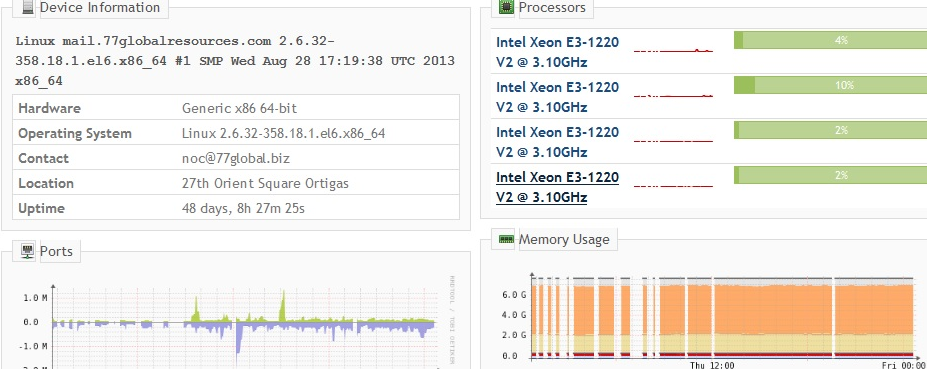
Attachment 2: observium2.jpg snapshot of one linux mail server
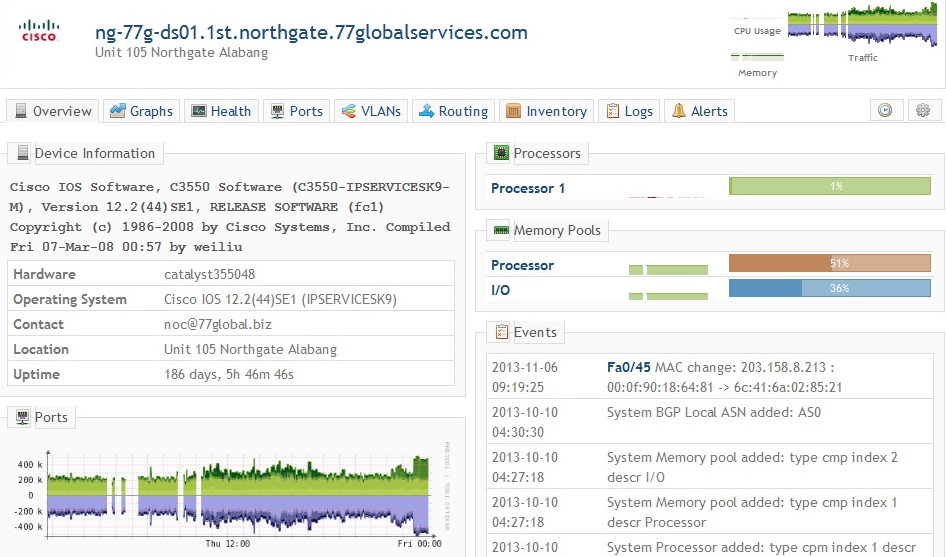
Attachment 3: observium3.jpg snapshot of network switch device
Best Regards, Jerico M. Rubion
Hi,
I'm having a problem with the graphs of all my devices in observium (screenshots attached). What is the advisable crontab settings should I use given the list of devices I am polling? for the list of devices it is in attachment 1
Here are the details of my environment.
*Observium* 0.13.7.4172 *Apache* 2.2.15 (CentOS) *PHP* 5.3.3 *MySQL* 5.1.69 *RRDtool* 1.3.8
Crontab settings: */10 * * * * root /opt/observium/poller-wrapper.py 1 >> /dev/null 2>&1 */10 * * * * root /opt/observium/poller.php -h all >> /dev/null 2>&1
Recent output of TOP: top - 00:44:01 up 1 day, 18:35, 1 user, load average: 2.89, 2.26, 2.24 Tasks: 187 total, 5 running, 182 sleeping, 0 stopped, 0 zombie Cpu(s): 13.1%us, 65.9%sy, 0.0%ni, 20.5%id, 0.2%wa, 0.0%hi, 0.3%si, 0.0%st Mem: 5059868k total, 905692k used, 4154176k free, 153836k buffers Swap: 4161528k total, 0k used, 4161528k free, 481076k cached
List of my devices
Snapshot of one linux mail server
Snapshot of network switch device
Best Regards, Jerico M. Rubion

It's likely that you have some system that is not finishing within the period of 5 minutes. Also you have only a single thread of the poller running. Try this:
*/10 * * * * root /opt/observium/poller-wrapper.py 4 >> /dev/null 2>&1
Replacing the "1" with "4", or you might try 2 and see where that gets you. Further to see which devices are taking a long time check the polling stats. Click on the globe in the menu then "Polling Information". Scroll down the list to see which of your devices is taking the longest.
Lastly, you may want to add a setting to you config.php to set the max-reps for snmpbulkwalk: $config['snmp']['max-rep'] = 5; // allow use of -Cr in snmpbulkwalk vastly increasing walk speed
Again, start low and move up. You might want to try manually polling the slow device from the cli and playing with that number to find your optimal setting.
I just went through the same issue and the combination of these things resolved my problems.
Hope that helps!
--chip
On Thu, Nov 14, 2013 at 11:57 AM, Jerico Rubion jrubion@77soft.com wrote:
Hi,
I'm having a problem with the graphs of all my devices in observium (screenshots attached). What is the advisable crontab settings should I use given the list of devices I am polling? for the list of devices it is in attachment 1
Here are the details of my environment.
*Observium* 0.13.7.4172 *Apache* 2.2.15 (CentOS) *PHP* 5.3.3 *MySQL* 5.1.69 *RRDtool* 1.3.8 Crontab settings: */10 * * * * root /opt/observium/poller-wrapper.py 1 >> /dev/null 2>&1 */10 * * * * root /opt/observium/poller.php -h all >> /dev/null 2>&1
Recent output of TOP: top - 00:44:01 up 1 day, 18:35, 1 user, load average: 2.89, 2.26, 2.24 Tasks: 187 total, 5 running, 182 sleeping, 0 stopped, 0 zombie Cpu(s): 13.1%us, 65.9%sy, 0.0%ni, 20.5%id, 0.2%wa, 0.0%hi, 0.3%si, 0.0%st Mem: 5059868k total, 905692k used, 4154176k free, 153836k buffers Swap: 4161528k total, 0k used, 4161528k free, 481076k cached
List of my devices
Snapshot of one linux mail server
Snapshot of network switch device
Best Regards, Jerico M. Rubion
observium mailing list observium@observium.org http://postman.memetic.org/cgi-bin/mailman/listinfo/observium
Hi Chip,
I already increased the poller-wrapper thread to 2 and added the snmp settings in config.php. I will be monitoring the graphs of my devices for 24hours for the improvement. Just to add when I use */5 or every 5minute interval i see great changes in cpu load of the system so I changed it to */10.
Thanks for your input
Jerico
On 11/15/2013 1:06 AM, chip wrote:
It's likely that you have some system that is not finishing within the period of 5 minutes. Also you have only a single thread of the poller running. Try this:
*/10 * * * * root /opt/observium/poller-wrapper.py 4 >> /dev/null 2>&1
Replacing the "1" with "4", or you might try 2 and see where that gets you. Further to see which devices are taking a long time check the polling stats. Click on the globe in the menu then "Polling Information". Scroll down the list to see which of your devices is taking the longest.
Lastly, you may want to add a setting to you config.php to set the max-reps for snmpbulkwalk: $config['snmp']['max-rep'] = 5; // allow use of -Cr in snmpbulkwalk vastly increasing walk speed
Again, start low and move up. You might want to try manually polling the slow device from the cli and playing with that number to find your optimal setting.
I just went through the same issue and the combination of these things resolved my problems.
Hope that helps!
--chip
On Thu, Nov 14, 2013 at 11:57 AM, Jerico Rubion <jrubion@77soft.com mailto:jrubion@77soft.com> wrote:
Hi,

I'm having a problem with the graphs of all my devices in
observium (screenshots attached).
What is the advisable crontab settings should I use given the list
of devices I am polling? for the list of devices it is in attachment 1


Here are the details of my environment.

*Observium* 	0.13.7.4172
*Apache* 	2.2.15 (CentOS)
*PHP* 	5.3.3
*MySQL* 	5.1.69
*RRDtool* 	1.3.8


Crontab settings:
*/10 * * * *   root    /opt/observium/poller-wrapper.py 1 >>
/dev/null 2>&1
*/10 * * * *   root    /opt/observium/poller.php -h all >>
/dev/null 2>&1

Recent output of TOP:
top - 00:44:01 up 1 day, 18:35,  1 user,  load average: 2.89,
2.26, 2.24
Tasks: 187 total,   5 running, 182 sleeping,   0 stopped,   0 zombie
Cpu(s): 13.1%us, 65.9%sy,  0.0%ni, 20.5%id,  0.2%wa, 0.0%hi,
0.3%si,  0.0%st
Mem:   5059868k total,   905692k used,  4154176k free, 153836k buffers
Swap:  4161528k total,        0k used,  4161528k free, 481076k cached

List of my devices


Snapshot of one linux mail server


Snapshot of network switch device


Best Regards,
Jerico M. Rubion


_______________________________________________
observium mailing list
observium@observium.org <mailto:observium@observium.org>
http://postman.memetic.org/cgi-bin/mailman/listinfo/observium
-- Just my $.02, your mileage may vary, batteries not included, etc....
observium mailing list observium@observium.org http://postman.memetic.org/cgi-bin/mailman/listinfo/observium

Hi Jerico,
You cannot increase the polling time. That's where the spaces come from. The rrd files are created with a 5 minute interval.
Regards,
Frederik
________________________________________ Van: observium [observium-bounces@observium.org] namens Jerico Rubion [jrubion@77soft.com] Verzonden: donderdag 14 november 2013 20:09 To: Observium Network Observation System Onderwerp: Re: [Observium] [observium] Graphs has white spaces and not continuous
Hi Chip,
I already increased the poller-wrapper thread to 2 and added the snmp settings in config.php. I will be monitoring the graphs of my devices for 24hours for the improvement. Just to add when I use */5 or every 5minute interval i see great changes in cpu load of the system so I changed it to */10.
Thanks for your input
Jerico
On 11/15/2013 1:06 AM, chip wrote: It's likely that you have some system that is not finishing within the period of 5 minutes. Also you have only a single thread of the poller running. Try this:
*/10 * * * * root /opt/observium/poller-wrapper.py 4 >> /dev/null 2>&1
Replacing the "1" with "4", or you might try 2 and see where that gets you. Further to see which devices are taking a long time check the polling stats. Click on the globe in the menu then "Polling Information". Scroll down the list to see which of your devices is taking the longest.
Lastly, you may want to add a setting to you config.php to set the max-reps for snmpbulkwalk: $config['snmp']['max-rep'] = 5; // allow use of -Cr in snmpbulkwalk vastly increasing walk speed
Again, start low and move up. You might want to try manually polling the slow device from the cli and playing with that number to find your optimal setting.
I just went through the same issue and the combination of these things resolved my problems.
Hope that helps!
--chip
On Thu, Nov 14, 2013 at 11:57 AM, Jerico Rubion <jrubion@77soft.commailto:jrubion@77soft.com> wrote: Hi,
I'm having a problem with the graphs of all my devices in observium (screenshots attached). What is the advisable crontab settings should I use given the list of devices I am polling? for the list of devices it is in attachment 1
Here are the details of my environment.
Observium 0.13.7.4172 Apache 2.2.15 (CentOS) PHP 5.3.3 MySQL 5.1.69 RRDtool 1.3.8
Crontab settings: */10 * * * * root /opt/observium/poller-wrapper.py 1 >> /dev/null 2>&1 */10 * * * * root /opt/observium/poller.php -h all >> /dev/null 2>&1
Recent output of TOP: top - 00:44:01 up 1 day, 18:35, 1 user, load average: 2.89, 2.26, 2.24 Tasks: 187 total, 5 running, 182 sleeping, 0 stopped, 0 zombie Cpu(s): 13.1%us, 65.9%sy, 0.0%ni, 20.5%id, 0.2%wa, 0.0%hi, 0.3%si, 0.0%st Mem: 5059868k total, 905692k used, 4154176k free, 153836k buffers Swap: 4161528k total, 0k used, 4161528k free, 481076k cached
List of my devices [cid:part2.03080901.08080500@77soft.com]
Snapshot of one linux mail server [cid:part3.01000107.01070605@77soft.com]
Snapshot of network switch device [cid:part4.06000600.02030000@77soft.com]
Best Regards, Jerico M. Rubion
_______________________________________________ observium mailing list observium@observium.orgmailto:observium@observium.org http://postman.memetic.org/cgi-bin/mailman/listinfo/observium
-- Just my $.02, your mileage may vary, batteries not included, etc....
_______________________________________________ observium mailing list observium@observium.orgmailto:observium@observium.org http://postman.memetic.org/cgi-bin/mailman/listinfo/observium

Hi,
I'm having a problem with the graphs of all my devices in observium (screenshots attached). What is the advisable crontab settings should I use given the list of devices I am polling?
Just follow the manual
Crontab settings: */10 * * * * root /opt/observium/poller-wrapper.py 1 >> /dev/null 2>&1 */10 * * * * root /opt/observium/poller.php -h all >> /dev/null 2>&1
This will not work. RRD will think it is missing data if you only poll every 10 minutes. And polling every device twice every ten minutes is not the same as polling every 5 minutes. Start with what the manual tells you:
33 */6 * * * root /opt/observium/discovery.php -h all >> /dev/null 2>&1 */5 * * * * root /opt/observium/discovery.php -h new >> /dev/null 2>&1 */5 * * * * root /opt/observium/poller-wrapper.py 1 >> /dev/null 2>&1
And then increase the number behind poller-wrapper.py to run more pollers in parallel.
Cheers, Sander

To add if your system cant cope with polling every 5 mins then you need to upgrade your system! - check that the CPU load isn't due to IOwait though, if it is you are IO bound on performance and need to increase the speed of your disks (faster or SSD) rather than just increasing CPU/mem specs
participants (5)
-
 Anthony Somerset
 -
 chip
chip -
 F.Reenders@utwente.nl
 -
 Jerico Rubion
 -
 Sander Steffann