esxi 5.1 cpu graph not working properly

Hi
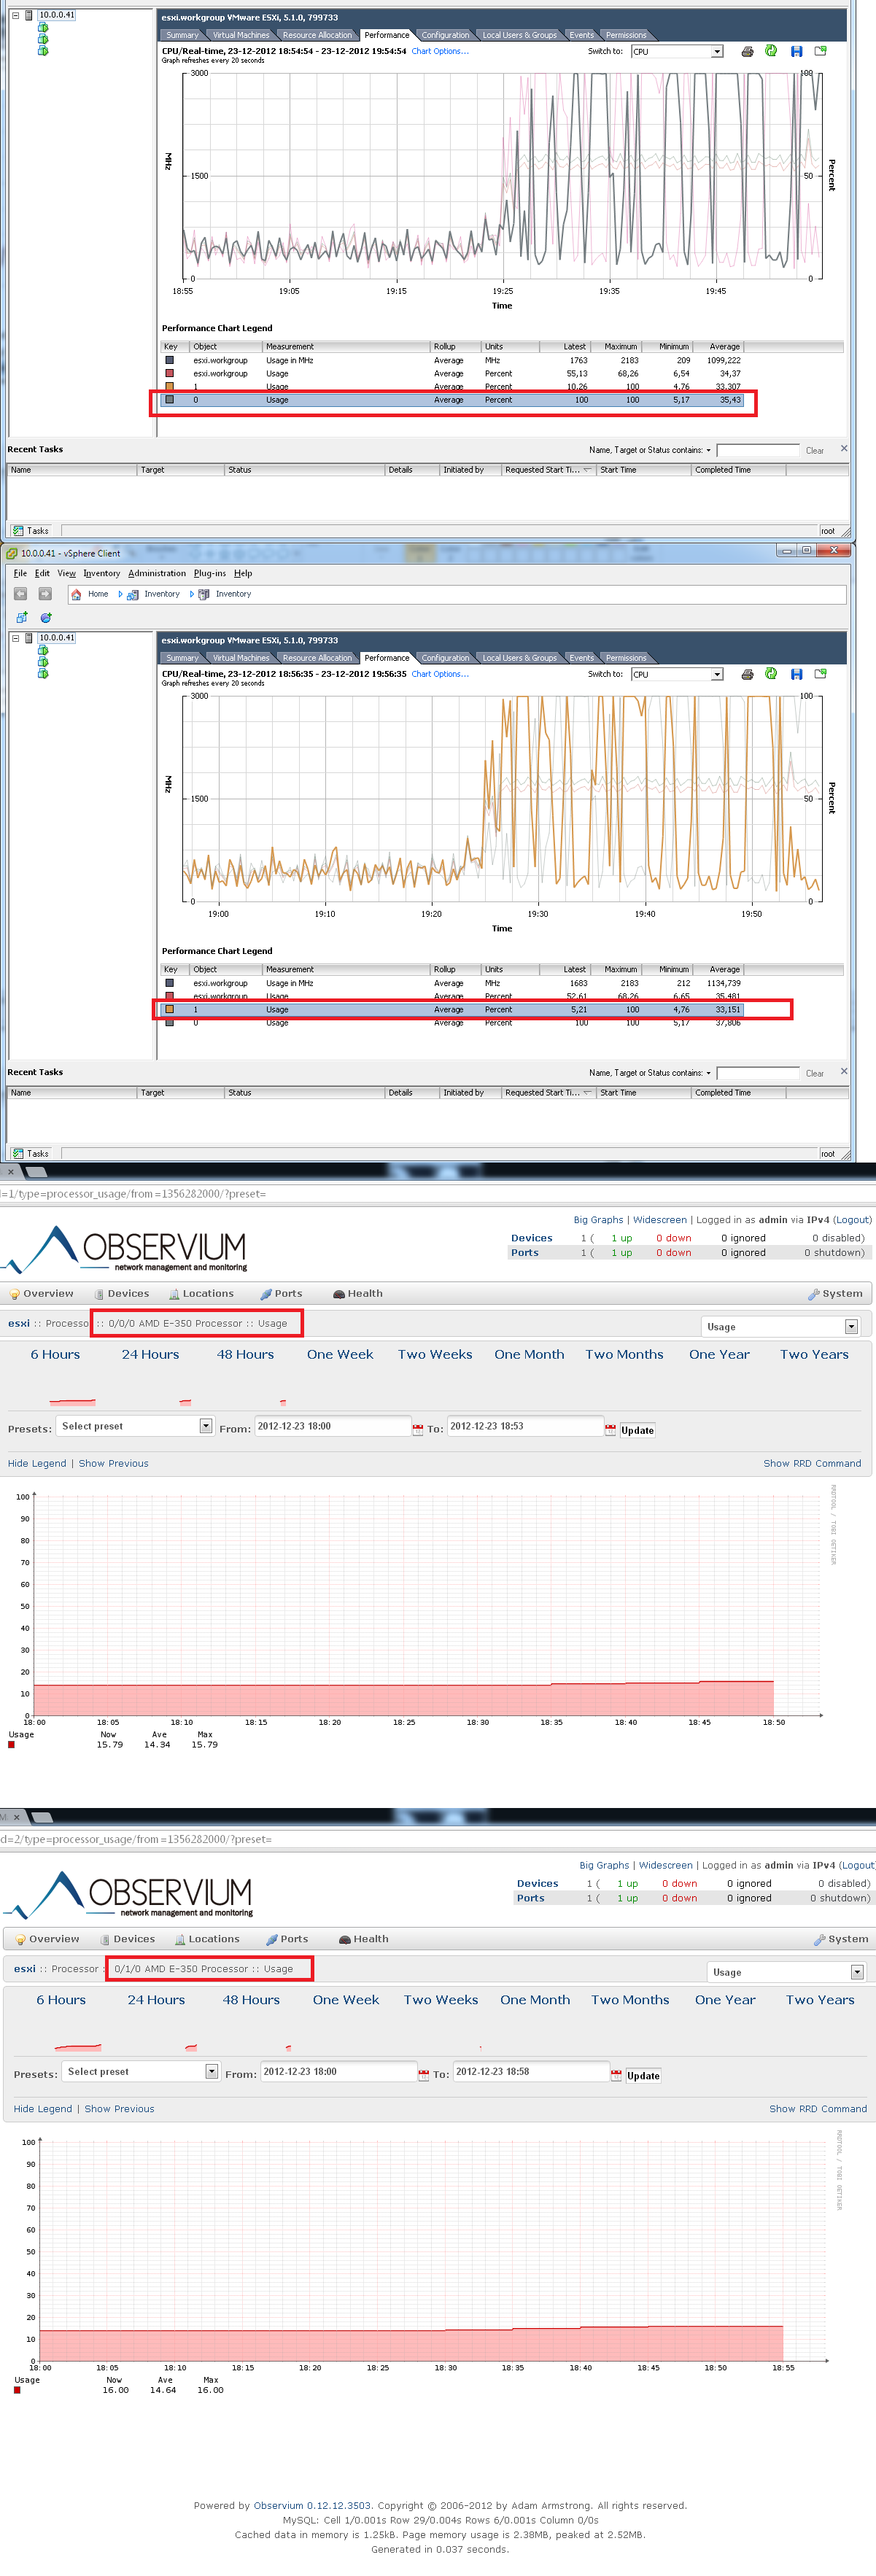
I am having some issues with the CPU graph in my home lab with a small server running esxi 5.1 with a dual core amd cpu. I have attached a screenshot of the problem.
The graph in observium seems to be following a path of its own. Even when doing som cpu burn tests, nothing happens.
Any ideas?
BR
Stefan Milo
Happy holidays

It almost certainly has nothing to do with us. Check the debugging output:
./poller.php -h <host> -m processors -d
--- Processor Intel Core i7-2760QM @ 2.40GHz DEBUG: SNMP Auth options = -v2c -c public /usr/bin/snmpget -v2c -c public -O Uqnv -m "" -M /opt/observium/mibs udp:observium:161 .1.3.6.1.2.1.25.3.3.1.2.768 5
5% OK u:0.00 s:0.00 r:0.01 RRD[update /opt/observium/rrd/observium/processor-hr-768.rrd N:5] ---
The number 5 directly after the snmpget command is the number that was returned by the device. It's then displayed like in the non-debugging outout (5%), then put into the RRD (N:5).
adam.
On 23/12/2012 12:04, Stefan Milo wrote:
Hi
I am having some issues with the CPU graph in my home lab with a small server running esxi 5.1 with a dual core amd cpu. I have attached a screenshot of the problem.
The graph in observium seems to be following a path of its own. Even when doing som cpu burn tests, nothing happens.
Any ideas?
BR
Stefan Milo
Happy holidays
observium mailing list observium@observium.org http://postman.memetic.org/cgi-bin/mailman/listinfo/observium
Hmmm yes. It gives me the number 15 every time. I'll take a look at the mibs and oid.
Thanks
Stefan
Sendt fra min iPad
Den 23/12/2012 kl. 19.54 skrev "Adam Armstrong" <adama@memetic.orgmailto:adama@memetic.org>:
It almost certainly has nothing to do with us. Check the debugging output:
./poller.php -h <host> -m processors -d
--- Processor Intel Core i7-2760QM @ 2.40GHz DEBUG: SNMP Auth options = -v2c -c public /usr/bin/snmpget -v2c -c public -O Uqnv -m "" -M /opt/observium/mibs udp:observium:161 .1.3.6.1.2.1.25.3.3.1.2.768 5
5% OK u:0.00 s:0.00 r:0.01 RRD[update /opt/observium/rrd/observium/processor-hr-768.rrd N:5] ---
The number 5 directly after the snmpget command is the number that was returned by the device. It's then displayed like in the non-debugging outout (5%), then put into the RRD (N:5).
adam.
On 23/12/2012 12:04, Stefan Milo wrote:
Hi
I am having some issues with the CPU graph in my home lab with a small server running esxi 5.1 with a dual core amd cpu. I have attached a screenshot of the problem.
The graph in observium seems to be following a path of its own. Even when doing som cpu burn tests, nothing happens.
Any ideas?
BR
Stefan Milo
Happy holidays
_______________________________________________ observium mailing list observium@observium.orgmailto:observium@observium.org http://postman.memetic.org/cgi-bin/mailman/listinfo/observium
_______________________________________________ observium mailing list observium@observium.orgmailto:observium@observium.org http://postman.memetic.org/cgi-bin/mailman/listinfo/observium
participants (2)
-
 Adam Armstrong
 -
 Stefan Milo