
Hi,
This might be my lack of understanding of the memory pools' representations in Observium, or it might be a bug.
There seems to be a significant difference in the memory being reported by Observium and that which is reported by the device.
Here is the console output for the two processors (SP and RSP) along with the graph values from Observium:
#sh mem sum location 0/0/CPU0 Physical Memory: 8192M total Application Memory : 8004M (5264M available) <- approx. 34% used Image: 59M (bootram: 59M) Reserved: 128M, IOMem: 0, flashfsys: 0 Total shared window: 347M
#sh mem sum location 0/RSP0/CPU0 Physical Memory: 8192M total (4688M available) <- approx. 41% used Application Memory : 8002M (4688M available) Image: 61M (bootram: 61M) Reserved: 128M, IOMem: 0, flashfsys: 0 Total shared window: 133M
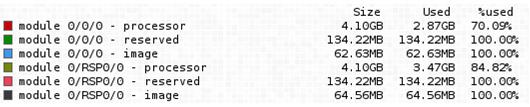
The "Reserved" and "Image" ones are always 100% - but that's a different issue I think.
What I'm more interested in is the RSP and SP "Processor" element, which both show very different amounts to the real usage. In fact, I can't even remotely line them up with anything on the box itself.
So, any ideas or am I just reading this all wrong?
Cheers!
Robert Williams Custodian Data Centre Email: Robert@CustodianDC.com http://www.CustodianDC.com

Hi,
Here is the console output for the two processors (SP and RSP) along with the graph values from Observium:
#sh mem sum location 0/0/CPU0 Physical Memory: 8192M total Application Memory : 8004M (5264M available) <- approx. 34% used Image: 59M (bootram: 59M) Reserved: 128M, IOMem: 0, flashfsys: 0 Total shared window: 347M
#sh mem sum location 0/RSP0/CPU0 Physical Memory: 8192M total (4688M available) <- approx. 41% used Application Memory : 8002M (4688M available) Image: 61M (bootram: 61M) Reserved: 128M, IOMem: 0, flashfsys: 0 Total shared window: 133M
Can you also show the SNMP data for these CPUs?
Cheers, Sander
Hi Sander, sure, this is the whole SNMP tree for RAM I believe:
(Let me know if you meant something else)
# snmpwalk <blah blah> .1.3.6.1.4.1.9.9.221.1.1.1.1 iso.3.6.1.4.1.9.9.221.1.1.1.1.2.18788073.1 = INTEGER: 2 iso.3.6.1.4.1.9.9.221.1.1.1.1.2.18788073.2 = INTEGER: 11 iso.3.6.1.4.1.9.9.221.1.1.1.1.2.18788073.3 = INTEGER: 12 iso.3.6.1.4.1.9.9.221.1.1.1.1.2.52690955.1 = INTEGER: 2 iso.3.6.1.4.1.9.9.221.1.1.1.1.2.52690955.2 = INTEGER: 11 iso.3.6.1.4.1.9.9.221.1.1.1.1.2.52690955.3 = INTEGER: 12 iso.3.6.1.4.1.9.9.221.1.1.1.1.3.18788073.1 = STRING: "processor" iso.3.6.1.4.1.9.9.221.1.1.1.1.3.18788073.2 = STRING: "reserved" iso.3.6.1.4.1.9.9.221.1.1.1.1.3.18788073.3 = STRING: "image" iso.3.6.1.4.1.9.9.221.1.1.1.1.3.52690955.1 = STRING: "processor" iso.3.6.1.4.1.9.9.221.1.1.1.1.3.52690955.2 = STRING: "reserved" iso.3.6.1.4.1.9.9.221.1.1.1.1.3.52690955.3 = STRING: "image" iso.3.6.1.4.1.9.9.221.1.1.1.1.5.18788073.1 = INTEGER: 0 iso.3.6.1.4.1.9.9.221.1.1.1.1.5.18788073.2 = INTEGER: 0 iso.3.6.1.4.1.9.9.221.1.1.1.1.5.18788073.3 = INTEGER: 0 iso.3.6.1.4.1.9.9.221.1.1.1.1.5.52690955.1 = INTEGER: 0 iso.3.6.1.4.1.9.9.221.1.1.1.1.5.52690955.2 = INTEGER: 0 iso.3.6.1.4.1.9.9.221.1.1.1.1.5.52690955.3 = INTEGER: 0 iso.3.6.1.4.1.9.9.221.1.1.1.1.6.18788073.1 = INTEGER: 1 iso.3.6.1.4.1.9.9.221.1.1.1.1.6.18788073.2 = INTEGER: 1 iso.3.6.1.4.1.9.9.221.1.1.1.1.6.18788073.3 = INTEGER: 1 iso.3.6.1.4.1.9.9.221.1.1.1.1.6.52690955.1 = INTEGER: 1 iso.3.6.1.4.1.9.9.221.1.1.1.1.6.52690955.2 = INTEGER: 1 iso.3.6.1.4.1.9.9.221.1.1.1.1.6.52690955.3 = INTEGER: 1 iso.3.6.1.4.1.9.9.221.1.1.1.1.7.18788073.1 = Gauge32: 2872316328 iso.3.6.1.4.1.9.9.221.1.1.1.1.7.18788073.2 = Gauge32: 134217728 iso.3.6.1.4.1.9.9.221.1.1.1.1.7.18788073.3 = Gauge32: 62625616 iso.3.6.1.4.1.9.9.221.1.1.1.1.7.52690955.1 = Gauge32: 3474185272 iso.3.6.1.4.1.9.9.221.1.1.1.1.7.52690955.2 = Gauge32: 134217728 iso.3.6.1.4.1.9.9.221.1.1.1.1.7.52690955.3 = Gauge32: 64560320 iso.3.6.1.4.1.9.9.221.1.1.1.1.8.18788073.1 = Gauge32: 1225519104 iso.3.6.1.4.1.9.9.221.1.1.1.1.8.18788073.2 = Gauge32: 0 iso.3.6.1.4.1.9.9.221.1.1.1.1.8.18788073.3 = Gauge32: 0 iso.3.6.1.4.1.9.9.221.1.1.1.1.8.52690955.1 = Gauge32: 621715456 iso.3.6.1.4.1.9.9.221.1.1.1.1.8.52690955.2 = Gauge32: 0 iso.3.6.1.4.1.9.9.221.1.1.1.1.8.52690955.3 = Gauge32: 0 iso.3.6.1.4.1.9.9.221.1.1.1.1.17.18788073.1 = Gauge32: 0 iso.3.6.1.4.1.9.9.221.1.1.1.1.17.18788073.2 = Gauge32: 0 iso.3.6.1.4.1.9.9.221.1.1.1.1.17.18788073.3 = Gauge32: 0 iso.3.6.1.4.1.9.9.221.1.1.1.1.17.52690955.1 = Gauge32: 0 iso.3.6.1.4.1.9.9.221.1.1.1.1.17.52690955.2 = Gauge32: 0 iso.3.6.1.4.1.9.9.221.1.1.1.1.17.52690955.3 = Gauge32: 0 iso.3.6.1.4.1.9.9.221.1.1.1.1.18.18788073.1 = Counter64: 2872316328 iso.3.6.1.4.1.9.9.221.1.1.1.1.18.18788073.2 = Counter64: 134217728 iso.3.6.1.4.1.9.9.221.1.1.1.1.18.18788073.3 = Counter64: 62625616 iso.3.6.1.4.1.9.9.221.1.1.1.1.18.52690955.1 = Counter64: 3474185272 iso.3.6.1.4.1.9.9.221.1.1.1.1.18.52690955.2 = Counter64: 134217728 iso.3.6.1.4.1.9.9.221.1.1.1.1.18.52690955.3 = Counter64: 64560320 iso.3.6.1.4.1.9.9.221.1.1.1.1.19.18788073.1 = Gauge32: 1 iso.3.6.1.4.1.9.9.221.1.1.1.1.19.18788073.2 = Gauge32: 0 iso.3.6.1.4.1.9.9.221.1.1.1.1.19.18788073.3 = Gauge32: 0 iso.3.6.1.4.1.9.9.221.1.1.1.1.19.52690955.1 = Gauge32: 1 iso.3.6.1.4.1.9.9.221.1.1.1.1.19.52690955.2 = Gauge32: 0 iso.3.6.1.4.1.9.9.221.1.1.1.1.19.52690955.3 = Gauge32: 0 iso.3.6.1.4.1.9.9.221.1.1.1.1.20.18788073.1 = Counter64: 5520486400 iso.3.6.1.4.1.9.9.221.1.1.1.1.20.18788073.2 = Counter64: 0 iso.3.6.1.4.1.9.9.221.1.1.1.1.20.18788073.3 = Counter64: 0 iso.3.6.1.4.1.9.9.221.1.1.1.1.20.52690955.1 = Counter64: 4916682752 iso.3.6.1.4.1.9.9.221.1.1.1.1.20.52690955.2 = Counter64: 0 iso.3.6.1.4.1.9.9.221.1.1.1.1.20.52690955.3 = Counter64: 0
Cheers,
Robert Williams Custodian Data Centre Email: Robert@CustodianDC.com http://www.CustodianDC.com
-----Original Message----- From: observium [mailto:observium-bounces@observium.org] On Behalf Of Sander Steffann Sent: 24 February 2014 17:20 To: Observium Network Observation System Subject: Re: [Observium] Memory usage on ASR9k
Can you also show the SNMP data for these CPUs?
Cheers, Sander
Hi,
Ah, 32-bit gauge overflow :-)
They provide two values as 32-bit:
cempMemPoolUsed at 1.3.6.1.4.1.9.9.221.1.1.1.1.7 cempMemPoolFree at 1.3.6.1.4.1.9.9.221.1.1.1.1.8
and two values as 64-bit:
cempMemPoolHCUsed at 1.3.6.1.4.1.9.9.221.1.1.1.1.18 cempMemPoolHCFree at 1.3.6.1.4.1.9.9.221.1.1.1.1.20
As you can see the Free gauges are different, and the difference is exactly 4294967296:
iso.3.6.1.4.1.9.9.221.1.1.1.1.3.18788073.1 = STRING: "processor" iso.3.6.1.4.1.9.9.221.1.1.1.1.3.52690955.1 = STRING: "processor" iso.3.6.1.4.1.9.9.221.1.1.1.1.7.18788073.1 = Gauge32: 2872316328 iso.3.6.1.4.1.9.9.221.1.1.1.1.7.52690955.1 = Gauge32: 3474185272 iso.3.6.1.4.1.9.9.221.1.1.1.1.8.18788073.1 = Gauge32: 1225519104 iso.3.6.1.4.1.9.9.221.1.1.1.1.8.52690955.1 = Gauge32: 621715456 iso.3.6.1.4.1.9.9.221.1.1.1.1.18.18788073.1 = Counter64: 2872316328 iso.3.6.1.4.1.9.9.221.1.1.1.1.18.52690955.1 = Counter64: 3474185272 iso.3.6.1.4.1.9.9.221.1.1.1.1.20.18788073.1 = Counter64: 5520486400 iso.3.6.1.4.1.9.9.221.1.1.1.1.20.52690955.1 = Counter64: 4916682752
It seems that observium looks at the 32-bit values and then miscalculates. Just remove some RAM from those routers so they don't overflow the counters ;)
Or maybe I can fix the code...
Cheers, Sander
Sander - thanks for that, a fix would be cool as RAM is on-board and not so easy to remove :)
Nikolay - FWIW this is indeed a 9001 (running 5.1.0 for reference). I believe it has 8GB RSP and 8GB for the main CPU as well.
Cheers as always guys!
Robert Williams Custodian Data Centre Email: Robert@CustodianDC.com http://www.CustodianDC.com
-----Original Message----- From: observium [mailto:observium-bounces@observium.org] On Behalf Of Sander Steffann Sent: 24 February 2014 18:12 To: Observium Network Observation System Subject: Re: [Observium] Memory usage on ASR9k
Hi,
Ah, 32-bit gauge overflow :-)
They provide two values as 32-bit:
cempMemPoolUsed at 1.3.6.1.4.1.9.9.221.1.1.1.1.7 cempMemPoolFree at 1.3.6.1.4.1.9.9.221.1.1.1.1.8
and two values as 64-bit:
cempMemPoolHCUsed at 1.3.6.1.4.1.9.9.221.1.1.1.1.18 cempMemPoolHCFree at 1.3.6.1.4.1.9.9.221.1.1.1.1.20
As you can see the Free gauges are different, and the difference is exactly 4294967296:
iso.3.6.1.4.1.9.9.221.1.1.1.1.3.18788073.1 = STRING: "processor" iso.3.6.1.4.1.9.9.221.1.1.1.1.3.52690955.1 = STRING: "processor" iso.3.6.1.4.1.9.9.221.1.1.1.1.7.18788073.1 = Gauge32: 2872316328 iso.3.6.1.4.1.9.9.221.1.1.1.1.7.52690955.1 = Gauge32: 3474185272 iso.3.6.1.4.1.9.9.221.1.1.1.1.8.18788073.1 = Gauge32: 1225519104 iso.3.6.1.4.1.9.9.221.1.1.1.1.8.52690955.1 = Gauge32: 621715456 iso.3.6.1.4.1.9.9.221.1.1.1.1.18.18788073.1 = Counter64: 2872316328 iso.3.6.1.4.1.9.9.221.1.1.1.1.18.52690955.1 = Counter64: 3474185272 iso.3.6.1.4.1.9.9.221.1.1.1.1.20.18788073.1 = Counter64: 5520486400 iso.3.6.1.4.1.9.9.221.1.1.1.1.20.52690955.1 = Counter64: 4916682752
It seems that observium looks at the 32-bit values and then miscalculates. Just remove some RAM from those routers so they don't overflow the counters ;)
Or maybe I can fix the code...
Cheers, Sander
_______________________________________________ observium mailing list observium@observium.org http://postman.memetic.org/cgi-bin/mailman/listinfo/observium

On 2014-02-24 12:11, Sander Steffann wrote:
Hi,
Ah, 32-bit gauge overflow :-)
They provide two values as 32-bit:
cempMemPoolUsed at 1.3.6.1.4.1.9.9.221.1.1.1.1.7 cempMemPoolFree at 1.3.6.1.4.1.9.9.221.1.1.1.1.8
and two values as 64-bit:
cempMemPoolHCUsed at 1.3.6.1.4.1.9.9.221.1.1.1.1.18 cempMemPoolHCFree at 1.3.6.1.4.1.9.9.221.1.1.1.1.20
Ahh, I never saw these OIDs before!
As you can see the Free gauges are different, and the difference is exactly 4294967296:
iso.3.6.1.4.1.9.9.221.1.1.1.1.3.18788073.1 = STRING: "processor" iso.3.6.1.4.1.9.9.221.1.1.1.1.3.52690955.1 = STRING: "processor" iso.3.6.1.4.1.9.9.221.1.1.1.1.7.18788073.1 = Gauge32: 2872316328 iso.3.6.1.4.1.9.9.221.1.1.1.1.7.52690955.1 = Gauge32: 3474185272 iso.3.6.1.4.1.9.9.221.1.1.1.1.8.18788073.1 = Gauge32: 1225519104 iso.3.6.1.4.1.9.9.221.1.1.1.1.8.52690955.1 = Gauge32: 621715456 iso.3.6.1.4.1.9.9.221.1.1.1.1.18.18788073.1 = Counter64: 2872316328 iso.3.6.1.4.1.9.9.221.1.1.1.1.18.52690955.1 = Counter64: 3474185272 iso.3.6.1.4.1.9.9.221.1.1.1.1.20.18788073.1 = Counter64: 5520486400 iso.3.6.1.4.1.9.9.221.1.1.1.1.20.52690955.1 = Counter64: 4916682752
It seems that observium looks at the 32-bit values and then miscalculates. Just remove some RAM from those routers so they don't overflow the counters ;)
Or maybe I can fix the code...
This should to be done by having a flag in the database to tell the poller module it should be using the HC counters (this is how it's done for ports, and would make it easier to add the same functionality to other modules too).
If someone with quite old running IOS (2001?) on crappy low-memory routers could verify the existance of these counters on *all* cisco kit, we could perhaps just use them as default and never use the 32bit counters. We can't do this with ports because the HC counters are in a different table, and aren't always present.
adam.

CISCO-ENHANCED-MEMPOOL-MIB doesn't exist on low-end old devices at all.
On 24.02.2014 23:23, Adam Armstrong wrote:
If someone with quite old running IOS (2001?) on crappy low-memory routers could verify the existance of these counters on *all* cisco kit, we could perhaps just use them as default and never use the 32bit counters. We can't do this with ports because the HC counters are in a different table, and aren't always present.
adam.
Well, it would be nice to check on the oldest and smallest devices it exists on if the HC counters are always there!
adam.
On 2014-02-24 14:13, Nikolay Shopik wrote:
CISCO-ENHANCED-MEMPOOL-MIB doesn't exist on low-end old devices at all.
On 24.02.2014 23:23, Adam Armstrong wrote: If someone with quite old running IOS (2001?) on crappy low-memory routers could verify the existance of these counters on *all* cisco kit, we could perhaps just use them as default and never use the 32bit counters. We can't do this with ports because the HC counters are in a different table, and aren't always present.
adam. _______________________________________________ observium mailing list observium@observium.org http://postman.memetic.org/cgi-bin/mailman/listinfo/observium
Actually it doesn't exist at all on devices I've tried with classic IOS, from 12.1 to 15.2 all devices reported no table exist. Even though it Cisco MIB navigator says otherwise.
On 25.02.2014 0:13, Nikolay Shopik wrote:
CISCO-ENHANCED-MEMPOOL-MIB doesn't exist on low-end old devices at all.
On 24.02.2014 23:23, Adam Armstrong wrote:
If someone with quite old running IOS (2001?) on crappy low-memory routers could verify the existance of these counters on *all* cisco kit, we could perhaps just use them as default and never use the 32bit counters. We can't do this with ports because the HC counters are in a different table, and aren't always present.
adam.
Hmm. Do any of those devices have >4GB RAM?
I suspect it only appears on devices capable of >4GB, so we need to track it and only use it when it exists. Bleh!
adam.
On 2014-02-24 14:18, Nikolay Shopik wrote:
Actually it doesn't exist at all on devices I've tried with classic IOS, from 12.1 to 15.2 all devices reported no table exist. Even though it Cisco MIB navigator says otherwise.
On 25.02.2014 0:13, Nikolay Shopik wrote: CISCO-ENHANCED-MEMPOOL-MIB doesn't exist on low-end old devices at all.
On 24.02.2014 23:23, Adam Armstrong wrote: If someone with quite old running IOS (2001?) on crappy low-memory routers could verify the existance of these counters on *all* cisco kit, we could perhaps just use them as default and never use the 32bit counters. We can't do this with ports because the HC counters are in a different table, and aren't always present.
adam. _______________________________________________ observium mailing list observium@observium.org http://postman.memetic.org/cgi-bin/mailman/listinfo/observium
Nope, classic IOS can't handle more than 4Gb memory as it 32bit by nature. Therefore CISCO-ENHANCED-MEMPOOL-MIB only appears on IOS-XR and probably IOS-XE(?).
On 25.02.2014 0:17, Adam Armstrong wrote:
Hmm. Do any of those devices have >4GB RAM?
I suspect it only appears on devices capable of >4GB, so we need to track it and only use it when it exists. Bleh!
adam.
On 2014-02-24 14:18, Nikolay Shopik wrote:
Actually it doesn't exist at all on devices I've tried with classic IOS, from 12.1 to 15.2 all devices reported no table exist. Even though it Cisco MIB navigator says otherwise.
On 25.02.2014 0:13, Nikolay Shopik wrote: CISCO-ENHANCED-MEMPOOL-MIB doesn't exist on low-end old devices at all.
On 24.02.2014 23:23, Adam Armstrong wrote: If someone with quite old running IOS (2001?) on crappy low-memory routers could verify the existance of these counters on *all* cisco kit, we could perhaps just use them as default and never use the 32bit counters. We can't do this with ports because the HC counters are in a different table, and aren't always present.
adam. _______________________________________________ observium mailing list observium@observium.org http://postman.memetic.org/cgi-bin/mailman/listinfo/observium
observium mailing list observium@observium.org http://postman.memetic.org/cgi-bin/mailman/listinfo/observium
Hi,
Nope, classic IOS can't handle more than 4Gb memory as it 32bit by nature. Therefore CISCO-ENHANCED-MEMPOOL-MIB only appears on IOS-XR and probably IOS-XE(?).
I can check against an ASR1k. Observium already sees the difference between cmp (CISCO-MEMORY-POOL-MIB) and cemp (CISCO-ENHANCED-MEMPOOL-MIB) although the MIB file for the latter is a bit too old. The version bundled with Observium doesn't have the HC counters while the version at ftp://ftp.cisco.com/pub/mibs/v2/CISCO-ENHANCED-MEMPOOL-MIB.my does. A comment in includes/polling/mempools/cemp.inc.php already mentions the HC counters.
Would it be acceptable to try polling the HC counters from there, and falling back to the non-HC counters when the HC counters don't exist? Or would you prefer if discovery detects which HC counters exist and then store that in the database for the poller?
Cheers, Sander
On 2014-02-24 17:52, Sander Steffann wrote:
Hi,
Nope, classic IOS can't handle more than 4Gb memory as it 32bit by nature. Therefore CISCO-ENHANCED-MEMPOOL-MIB only appears on IOS-XR and probably IOS-XE(?).
I can check against an ASR1k. Observium already sees the difference between cmp (CISCO-MEMORY-POOL-MIB) and cemp (CISCO-ENHANCED-MEMPOOL-MIB) although the MIB file for the latter is a bit too old. The version bundled with Observium doesn't have the HC counters while the version at ftp://ftp.cisco.com/pub/mibs/v2/CISCO-ENHANCED-MEMPOOL-MIB.my does. A comment in includes/polling/mempools/cemp.inc.php already mentions the HC counters.
Would it be acceptable to try polling the HC counters from there, and falling back to the non-HC counters when the HC counters don't exist? Or would you prefer if discovery detects which HC counters exist and then store that in the database for the poller?
Doing it in the poller seems to cause horrible graph artifacts sometimes (snmp is dodgy, after all), so we prefer to store it in the database.
I wonder when they added it to the MIB. I looked at the one on cco, but it didn't have any changelog in the MIB itself.
adam.
Hi Adam,
Doing it in the poller seems to cause horrible graph artifacts sometimes (snmp is dodgy, after all), so we prefer to store it in the database.
I wonder when they added it to the MIB. I looked at the one on cco, but it didn't have any changelog in the MIB itself.
I think you missed this part:
REVISION "200812050000Z" DESCRIPTION "Added the following High Capacity and Overflow objects in cempMemPoolTable. cempMemPoolUsedOvrflw, cempMemPoolHCUsed, cempMemPoolFreeOvrflw, cempMemPoolHCFree, cempMemPoolLargestFreeOvrflw, cempMemPoolHCLargestFree, cempMemPoolLowestFreeOvrflw, cempMemPoolHCLowestFree, cempMemPoolUsedLowWaterMarkOvrflw, cempMemPoolHCUsedLowWaterMark, cempMemPoolSharedOvrflw, cempMemPoolHCShared. Added couple of new groups cempMemPoolHCGroup and cempMemPoolOvrflwGroup. Added a new compliance cempMIBComplianceRev3 which deprecates cempMIBComplianceRev2."
Cheers :) Sander
Hi,
Op 25 feb. 2014, om 02:58 heeft Adam Armstrong adama@memetic.org het volgende geschreven:
Doing it in the poller seems to cause horrible graph artifacts sometimes (snmp is dodgy, after all), so we prefer to store it in the database.
Ok, I implemented it as a new mempool type (polling/mempools/cemp-hc.inc.php) which is discovered in discovery/mempools/cisco-enhanced-mempool-mib.inc.php. See http://jira.observium.org/browse/OBSERVIUM-701 for the patch.
Cheers, Sander
On 2014-02-25 04:12, Sander Steffann wrote:
Hi,
Op 25 feb. 2014, om 02:58 heeft Adam Armstrong adama@memetic.org het volgende geschreven: Doing it in the poller seems to cause horrible graph artifacts sometimes (snmp is dodgy, after all), so we prefer to store it in the database.
Ok, I implemented it as a new mempool type (polling/mempools/cemp-hc.inc.php) which is discovered in discovery/mempools/cisco-enhanced-mempool-mib.inc.php. See http://jira.observium.org/browse/OBSERVIUM-701 for the patch.
Let me just remove that weird renaming rrd files stuff... ;)
adam.

Hi,
there seams to be a similar problem on Brocade MLXe with X Management Card. They also have 4G of RAM and show funny values. Had not time yet do investigate, but will search in this direction.
Regards
Matthias
On 24/02/14 20:23, Adam Armstrong wrote:
On 2014-02-24 12:11, Sander Steffann wrote:
Hi,
Ah, 32-bit gauge overflow :-)
They provide two values as 32-bit:
cempMemPoolUsed at 1.3.6.1.4.1.9.9.221.1.1.1.1.7 cempMemPoolFree at 1.3.6.1.4.1.9.9.221.1.1.1.1.8
and two values as 64-bit:
cempMemPoolHCUsed at 1.3.6.1.4.1.9.9.221.1.1.1.1.18 cempMemPoolHCFree at 1.3.6.1.4.1.9.9.221.1.1.1.1.20
Ahh, I never saw these OIDs before!
As you can see the Free gauges are different, and the difference is exactly 4294967296:
iso.3.6.1.4.1.9.9.221.1.1.1.1.3.18788073.1 = STRING: "processor" iso.3.6.1.4.1.9.9.221.1.1.1.1.3.52690955.1 = STRING: "processor" iso.3.6.1.4.1.9.9.221.1.1.1.1.7.18788073.1 = Gauge32: 2872316328 iso.3.6.1.4.1.9.9.221.1.1.1.1.7.52690955.1 = Gauge32: 3474185272 iso.3.6.1.4.1.9.9.221.1.1.1.1.8.18788073.1 = Gauge32: 1225519104 iso.3.6.1.4.1.9.9.221.1.1.1.1.8.52690955.1 = Gauge32: 621715456 iso.3.6.1.4.1.9.9.221.1.1.1.1.18.18788073.1 = Counter64: 2872316328 iso.3.6.1.4.1.9.9.221.1.1.1.1.18.52690955.1 = Counter64: 3474185272 iso.3.6.1.4.1.9.9.221.1.1.1.1.20.18788073.1 = Counter64: 5520486400 iso.3.6.1.4.1.9.9.221.1.1.1.1.20.52690955.1 = Counter64: 4916682752
It seems that observium looks at the 32-bit values and then miscalculates. Just remove some RAM from those routers so they don't overflow the counters ;)
Or maybe I can fix the code...
This should to be done by having a flag in the database to tell the poller module it should be using the HC counters (this is how it's done for ports, and would make it easier to add the same functionality to other modules too).
If someone with quite old running IOS (2001?) on crappy low-memory routers could verify the existance of these counters on *all* cisco kit, we could perhaps just use them as default and never use the 32bit counters. We can't do this with ports because the HC counters are in a different table, and aren't always present.
adam. _______________________________________________ observium mailing list observium@observium.org http://postman.memetic.org/cgi-bin/mailman/listinfo/observium
I'm pretty sure its because of incorrect detection total memory. As we are having same issue with 9001. Total is 4,10GB while should be twice as much.
Total memory detected only during discovery. But this is IOS-XR with different SNMP stack. IIRC classic IOS report total memory while IOS-XR is not (you have to do math "used+free" or I miss it somewhere else?).
I'm pretty sure Mike can comment on this with more detail how total memory detected in obs.
On 24.02.2014 21:35, Robert Williams wrote:
Hi Sander, sure, this is the whole SNMP tree for RAM I believe:
(Let me know if you meant something else)
# snmpwalk <blah blah> .1.3.6.1.4.1.9.9.221.1.1.1.1 iso.3.6.1.4.1.9.9.221.1.1.1.1.2.18788073.1 = INTEGER: 2 iso.3.6.1.4.1.9.9.221.1.1.1.1.2.18788073.2 = INTEGER: 11 iso.3.6.1.4.1.9.9.221.1.1.1.1.2.18788073.3 = INTEGER: 12 iso.3.6.1.4.1.9.9.221.1.1.1.1.2.52690955.1 = INTEGER: 2 iso.3.6.1.4.1.9.9.221.1.1.1.1.2.52690955.2 = INTEGER: 11 iso.3.6.1.4.1.9.9.221.1.1.1.1.2.52690955.3 = INTEGER: 12 iso.3.6.1.4.1.9.9.221.1.1.1.1.3.18788073.1 = STRING: "processor" iso.3.6.1.4.1.9.9.221.1.1.1.1.3.18788073.2 = STRING: "reserved" iso.3.6.1.4.1.9.9.221.1.1.1.1.3.18788073.3 = STRING: "image" iso.3.6.1.4.1.9.9.221.1.1.1.1.3.52690955.1 = STRING: "processor" iso.3.6.1.4.1.9.9.221.1.1.1.1.3.52690955.2 = STRING: "reserved" iso.3.6.1.4.1.9.9.221.1.1.1.1.3.52690955.3 = STRING: "image" iso.3.6.1.4.1.9.9.221.1.1.1.1.5.18788073.1 = INTEGER: 0 iso.3.6.1.4.1.9.9.221.1.1.1.1.5.18788073.2 = INTEGER: 0 iso.3.6.1.4.1.9.9.221.1.1.1.1.5.18788073.3 = INTEGER: 0 iso.3.6.1.4.1.9.9.221.1.1.1.1.5.52690955.1 = INTEGER: 0 iso.3.6.1.4.1.9.9.221.1.1.1.1.5.52690955.2 = INTEGER: 0 iso.3.6.1.4.1.9.9.221.1.1.1.1.5.52690955.3 = INTEGER: 0 iso.3.6.1.4.1.9.9.221.1.1.1.1.6.18788073.1 = INTEGER: 1 iso.3.6.1.4.1.9.9.221.1.1.1.1.6.18788073.2 = INTEGER: 1 iso.3.6.1.4.1.9.9.221.1.1.1.1.6.18788073.3 = INTEGER: 1 iso.3.6.1.4.1.9.9.221.1.1.1.1.6.52690955.1 = INTEGER: 1 iso.3.6.1.4.1.9.9.221.1.1.1.1.6.52690955.2 = INTEGER: 1 iso.3.6.1.4.1.9.9.221.1.1.1.1.6.52690955.3 = INTEGER: 1 iso.3.6.1.4.1.9.9.221.1.1.1.1.7.18788073.1 = Gauge32: 2872316328 iso.3.6.1.4.1.9.9.221.1.1.1.1.7.18788073.2 = Gauge32: 134217728 iso.3.6.1.4.1.9.9.221.1.1.1.1.7.18788073.3 = Gauge32: 62625616 iso.3.6.1.4.1.9.9.221.1.1.1.1.7.52690955.1 = Gauge32: 3474185272 iso.3.6.1.4.1.9.9.221.1.1.1.1.7.52690955.2 = Gauge32: 134217728 iso.3.6.1.4.1.9.9.221.1.1.1.1.7.52690955.3 = Gauge32: 64560320 iso.3.6.1.4.1.9.9.221.1.1.1.1.8.18788073.1 = Gauge32: 1225519104 iso.3.6.1.4.1.9.9.221.1.1.1.1.8.18788073.2 = Gauge32: 0 iso.3.6.1.4.1.9.9.221.1.1.1.1.8.18788073.3 = Gauge32: 0 iso.3.6.1.4.1.9.9.221.1.1.1.1.8.52690955.1 = Gauge32: 621715456 iso.3.6.1.4.1.9.9.221.1.1.1.1.8.52690955.2 = Gauge32: 0 iso.3.6.1.4.1.9.9.221.1.1.1.1.8.52690955.3 = Gauge32: 0 iso.3.6.1.4.1.9.9.221.1.1.1.1.17.18788073.1 = Gauge32: 0 iso.3.6.1.4.1.9.9.221.1.1.1.1.17.18788073.2 = Gauge32: 0 iso.3.6.1.4.1.9.9.221.1.1.1.1.17.18788073.3 = Gauge32: 0 iso.3.6.1.4.1.9.9.221.1.1.1.1.17.52690955.1 = Gauge32: 0 iso.3.6.1.4.1.9.9.221.1.1.1.1.17.52690955.2 = Gauge32: 0 iso.3.6.1.4.1.9.9.221.1.1.1.1.17.52690955.3 = Gauge32: 0 iso.3.6.1.4.1.9.9.221.1.1.1.1.18.18788073.1 = Counter64: 2872316328 iso.3.6.1.4.1.9.9.221.1.1.1.1.18.18788073.2 = Counter64: 134217728 iso.3.6.1.4.1.9.9.221.1.1.1.1.18.18788073.3 = Counter64: 62625616 iso.3.6.1.4.1.9.9.221.1.1.1.1.18.52690955.1 = Counter64: 3474185272 iso.3.6.1.4.1.9.9.221.1.1.1.1.18.52690955.2 = Counter64: 134217728 iso.3.6.1.4.1.9.9.221.1.1.1.1.18.52690955.3 = Counter64: 64560320 iso.3.6.1.4.1.9.9.221.1.1.1.1.19.18788073.1 = Gauge32: 1 iso.3.6.1.4.1.9.9.221.1.1.1.1.19.18788073.2 = Gauge32: 0 iso.3.6.1.4.1.9.9.221.1.1.1.1.19.18788073.3 = Gauge32: 0 iso.3.6.1.4.1.9.9.221.1.1.1.1.19.52690955.1 = Gauge32: 1 iso.3.6.1.4.1.9.9.221.1.1.1.1.19.52690955.2 = Gauge32: 0 iso.3.6.1.4.1.9.9.221.1.1.1.1.19.52690955.3 = Gauge32: 0 iso.3.6.1.4.1.9.9.221.1.1.1.1.20.18788073.1 = Counter64: 5520486400 iso.3.6.1.4.1.9.9.221.1.1.1.1.20.18788073.2 = Counter64: 0 iso.3.6.1.4.1.9.9.221.1.1.1.1.20.18788073.3 = Counter64: 0 iso.3.6.1.4.1.9.9.221.1.1.1.1.20.52690955.1 = Counter64: 4916682752 iso.3.6.1.4.1.9.9.221.1.1.1.1.20.52690955.2 = Counter64: 0 iso.3.6.1.4.1.9.9.221.1.1.1.1.20.52690955.3 = Counter64: 0
Cheers,
Robert Williams Custodian Data Centre Email: Robert@CustodianDC.com http://www.CustodianDC.com
-----Original Message----- From: observium [mailto:observium-bounces@observium.org] On Behalf Of Sander Steffann Sent: 24 February 2014 17:20 To: Observium Network Observation System Subject: Re: [Observium] Memory usage on ASR9k
Can you also show the SNMP data for these CPUs?
Cheers, Sander _______________________________________________ observium mailing list observium@observium.org http://postman.memetic.org/cgi-bin/mailman/listinfo/observium
Hi Robert,
Please SVN up to the latest (5035) and look at the poller output for the device in question :
./poller.php -h <hostname/id> -m mempools
You should see "HC" in the output for the mempools, and the web interface should now report the correct value like :
Mempool module 0/1/CPU0 - processor: HC 42.38%
I could only test it on a c9k with 4GB RAM! :)
Thanks, adam.
On 2014-02-24 11:10, Robert Williams wrote:
Hi,
This might be my lack of understanding of the memory pools' representations in Observium, or it might be a bug.
There seems to be a significant difference in the memory being reported by Observium and that which is reported by the device.
Here is the console output for the two processors (SP and RSP) along with the graph values from Observium:
#SH MEM SUM LOCATION 0/0/CPU0 Physical Memory: 8192M total Application Memory : 8004M (5264M available) <- approx. 34% used Image: 59M (bootram: 59M) Reserved: 128M, IOMem: 0, flashfsys: 0 Total shared window: 347M
#SH MEM SUM LOCATION 0/RSP0/CPU0 Physical Memory: 8192M total (4688M available) <- approx. 41% used Application Memory : 8002M (4688M available) Image: 61M (bootram: 61M) Reserved: 128M, IOMem: 0, flashfsys: 0 Total shared window: 133M
The "Reserved" and "Image" ones are always 100% - but that's a different issue I think.
What I'm more interested in is the RSP and SP "Processor" element, which both show very different amounts to the real usage. In fact, I can't even remotely line them up with anything on the box itself.
So, any ideas or am I just reading this all wrong?
Cheers!
Robert Williams Custodian Data Centre Email: Robert@CustodianDC.com http://www.CustodianDC.com [1]
Links:
[1] http://www.CustodianDC.com
observium mailing list observium@observium.org http://postman.memetic.org/cgi-bin/mailman/listinfo/observium
Hi Adam,
I've upped to 5037 and the GUI has changed (now shows numerical usage just below the graphics for RAM), but the counters are still out by the same amount unfortunately. Would you like the output from the poller in debug or something from a discovery run?
There is no mention of HC in any of the output either, let me know what you need from me - Cheers!
Robert Williams Custodian Data Centre Email: Robert@CustodianDC.com http://www.CustodianDC.com
-----Original Message----- From: observium [mailto:observium-bounces@observium.org] On Behalf Of Adam Armstrong Sent: 25 February 2014 17:16 To: Observium Network Observation System Subject: Re: [Observium] Memory usage on ASR9k
Hi Robert,
Please SVN up to the latest (5035) and look at the poller output for the device in question :
./poller.php -h <hostname/id> -m mempools
You should see "HC" in the output for the mempools, and the web interface should now report the correct value like :
Mempool module 0/1/CPU0 - processor: HC 42.38%
I could only test it on a c9k with 4GB RAM! :)
Thanks, adam.
On 2014-02-24 11:10, Robert Williams wrote:
Hi,
This might be my lack of understanding of the memory pools' representations in Observium, or it might be a bug.
There seems to be a significant difference in the memory being reported by Observium and that which is reported by the device.
Here is the console output for the two processors (SP and RSP) along with the graph values from Observium:
#SH MEM SUM LOCATION 0/0/CPU0 Physical Memory: 8192M total Application Memory : 8004M (5264M available) <- approx. 34% used Image: 59M (bootram: 59M) Reserved: 128M, IOMem: 0, flashfsys: 0 Total shared window: 347M
#SH MEM SUM LOCATION 0/RSP0/CPU0 Physical Memory: 8192M total (4688M available) <- approx. 41% used Application Memory : 8002M (4688M available) Image: 61M (bootram: 61M) Reserved: 128M, IOMem: 0, flashfsys: 0 Total shared window: 133M
The "Reserved" and "Image" ones are always 100% - but that's a different issue I think.
What I'm more interested in is the RSP and SP "Processor" element, which both show very different amounts to the real usage. In fact, I can't even remotely line them up with anything on the box itself.
So, any ideas or am I just reading this all wrong?
Cheers!
Robert Williams Custodian Data Centre Email: Robert@CustodianDC.com http://www.CustodianDC.com [1]
Links:
[1] http://www.CustodianDC.com
observium mailing list observium@observium.org http://postman.memetic.org/cgi-bin/mailman/listinfo/observium
_______________________________________________ observium mailing list observium@observium.org http://postman.memetic.org/cgi-bin/mailman/listinfo/observium
On 2014-02-25 14:08, Robert Williams wrote:
Hi Adam,
I've upped to 5037 and the GUI has changed (now shows numerical usage just below the graphics for RAM), but the counters are still out by the same amount unfortunately. Would you like the output from the poller in debug or something from a discovery run?
There is no mention of HC in any of the output either, let me know what you need from me - Cheers!
Rerun discovery for that host/module too!
./discovery.php -h <host> -m mempools
32/64bit is decided by discovery, so you're still running with 64bit set to off :)
adam.
Hi Robert,
I've upped to 5037 and the GUI has changed (now shows numerical usage just below the graphics for RAM), but the counters are still out by the same amount unfortunately. Would you like the output from the poller in debug or something from a discovery run?
There is no mention of HC in any of the output either, let me know what you need from me - Cheers!
First run discovery for those devices so it can detect that HC counters are available, then try the poller again.
Cheers! Sander
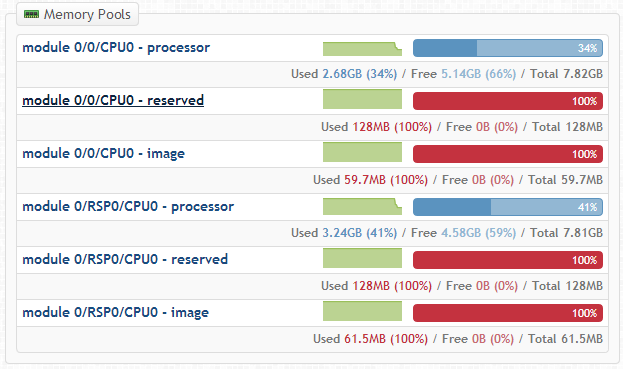
Hi - this just started working by itself with the auto SVN to 5038 this morning – big thanks to everyone involved for sorting!
[cid:image001.png@01CF32CB.1109F990]
On a semi-related note, does there happen to be way to exclude the ‘Reserved’ and ‘Image’ pools (like you can filter interfaces by regex on their name) because they are always Red/100% by nature and a bit pointless with the A9k?
Cheers!
Robert Williams Custodian Data Centre Email: Robert@CustodianDC.com http://www.CustodianDC.com
-----Original Message----- From: observium [mailto:observium-bounces@observium.org] On Behalf Of Sander Steffann Sent: 25 February 2014 20:13 To: Observium Network Observation System Subject: Re: [Observium] Memory usage on ASR9k
Hi Robert,
I've upped to 5037 and the GUI has changed (now shows numerical usage just below the graphics for RAM), but the counters are still out by the same amount unfortunately. Would you like the output from the poller in debug or something from a discovery run?
There is no mention of HC in any of the output either, let me know what you need from me - Cheers!
First run discovery for those devices so it can detect that HC counters are available, then try the poller again.
Cheers!
Sander
_______________________________________________
observium mailing list
observium@observium.orgmailto:observium@observium.org
http://postman.memetic.org/cgi-bin/mailman/listinfo/observium

On 26.02.2014 12:16, Robert Williams wrote:
Hi - this just started working by itself with the auto SVN to 5038 this morning -- big thanks to everyone involved for sorting!
On a semi-related note, does there happen to be way to exclude the 'Reserved' and 'Image' pools (like you can filter interfaces by regex on their name) because they are always Red/100% by nature and a bit pointless with the A9k?
Yep. See that in latest revision :)
Cheers!
Robert Williams Custodian Data Centre Email: Robert@CustodianDC.com http://www.CustodianDC.com
-----Original Message----- From: observium [mailto:observium-bounces@observium.org] On Behalf Of Sander Steffann Sent: 25 February 2014 20:13 To: Observium Network Observation System Subject: Re: [Observium] Memory usage on ASR9k
Hi Robert,
I've upped to 5037 and the GUI has changed (now shows numerical
usage just below the graphics for RAM), but the counters are still out by the same amount unfortunately. Would you like the output from the poller in debug or something from a discovery run?
There is no mention of HC in any of the output either, let me know
what you need from me - Cheers!
First run discovery for those devices so it can detect that HC counters are available, then try the poller again.
Cheers!
Sander
observium mailing list
observium@observium.org mailto:observium@observium.org
http://postman.memetic.org/cgi-bin/mailman/listinfo/observium
observium mailing list observium@observium.org http://postman.memetic.org/cgi-bin/mailman/listinfo/observium
Excellent thanks! Was it a specific tweak for the ASR weirdness or is there a regex somewhere with a default match in it for those two memory pool types?
From: observium [mailto:observium-bounces@observium.org] On Behalf Of Mike Stupalov Sent: 26 February 2014 12:38 To: Observium Network Observation System Subject: Re: [Observium] Memory usage on ASR9k
On 26.02.2014 12:16, Robert Williams wrote: Hi - this just started working by itself with the auto SVN to 5038 this morning - big thanks to everyone involved for sorting!
On a semi-related note, does there happen to be way to exclude the 'Reserved' and 'Image' pools (like you can filter interfaces by regex on their name) because they are always Red/100% by nature and a bit pointless with the A9k? Yep. See that in latest revision :)
Cheers!
Robert Williams Custodian Data Centre Email: Robert@CustodianDC.commailto:Robert@CustodianDC.com http://www.CustodianDC.com
Robert Williams Custodian Data Centre Email: Robert@CustodianDC.com http://www.CustodianDC.com
-----Original Message----- From: observium [mailto:observium-bounces@observium.org] On Behalf Of Sander Steffann Sent: 25 February 2014 20:13 To: Observium Network Observation System Subject: Re: [Observium] Memory usage on ASR9k
Hi Robert,
I've upped to 5037 and the GUI has changed (now shows numerical usage just below the graphics for RAM), but the counters are still out by the same amount unfortunately. Would you like the output from the poller in debug or something from a discovery run?
There is no mention of HC in any of the output either, let me know what you need from me - Cheers!
First run discovery for those devices so it can detect that HC counters are available, then try the poller again.
Cheers! Sander
_______________________________________________ observium mailing list observium@observium.orgmailto:observium@observium.org http://postman.memetic.org/cgi-bin/mailman/listinfo/observium
_______________________________________________ observium mailing list observium@observium.orgmailto:observium@observium.org http://postman.memetic.org/cgi-bin/mailman/listinfo/observium
-- Mike Stupalov http://observium.org
participants (6)
-
 Adam Armstrong
 -
 Matthias Cramer
 -
 Mike Stupalov
 -
 Nikolay Shopik
 -
 Robert Williams
 -
 Sander Steffann