can't get temperature chart

Hi All,
not sure if this is a bug with my browser or a bug with Observium
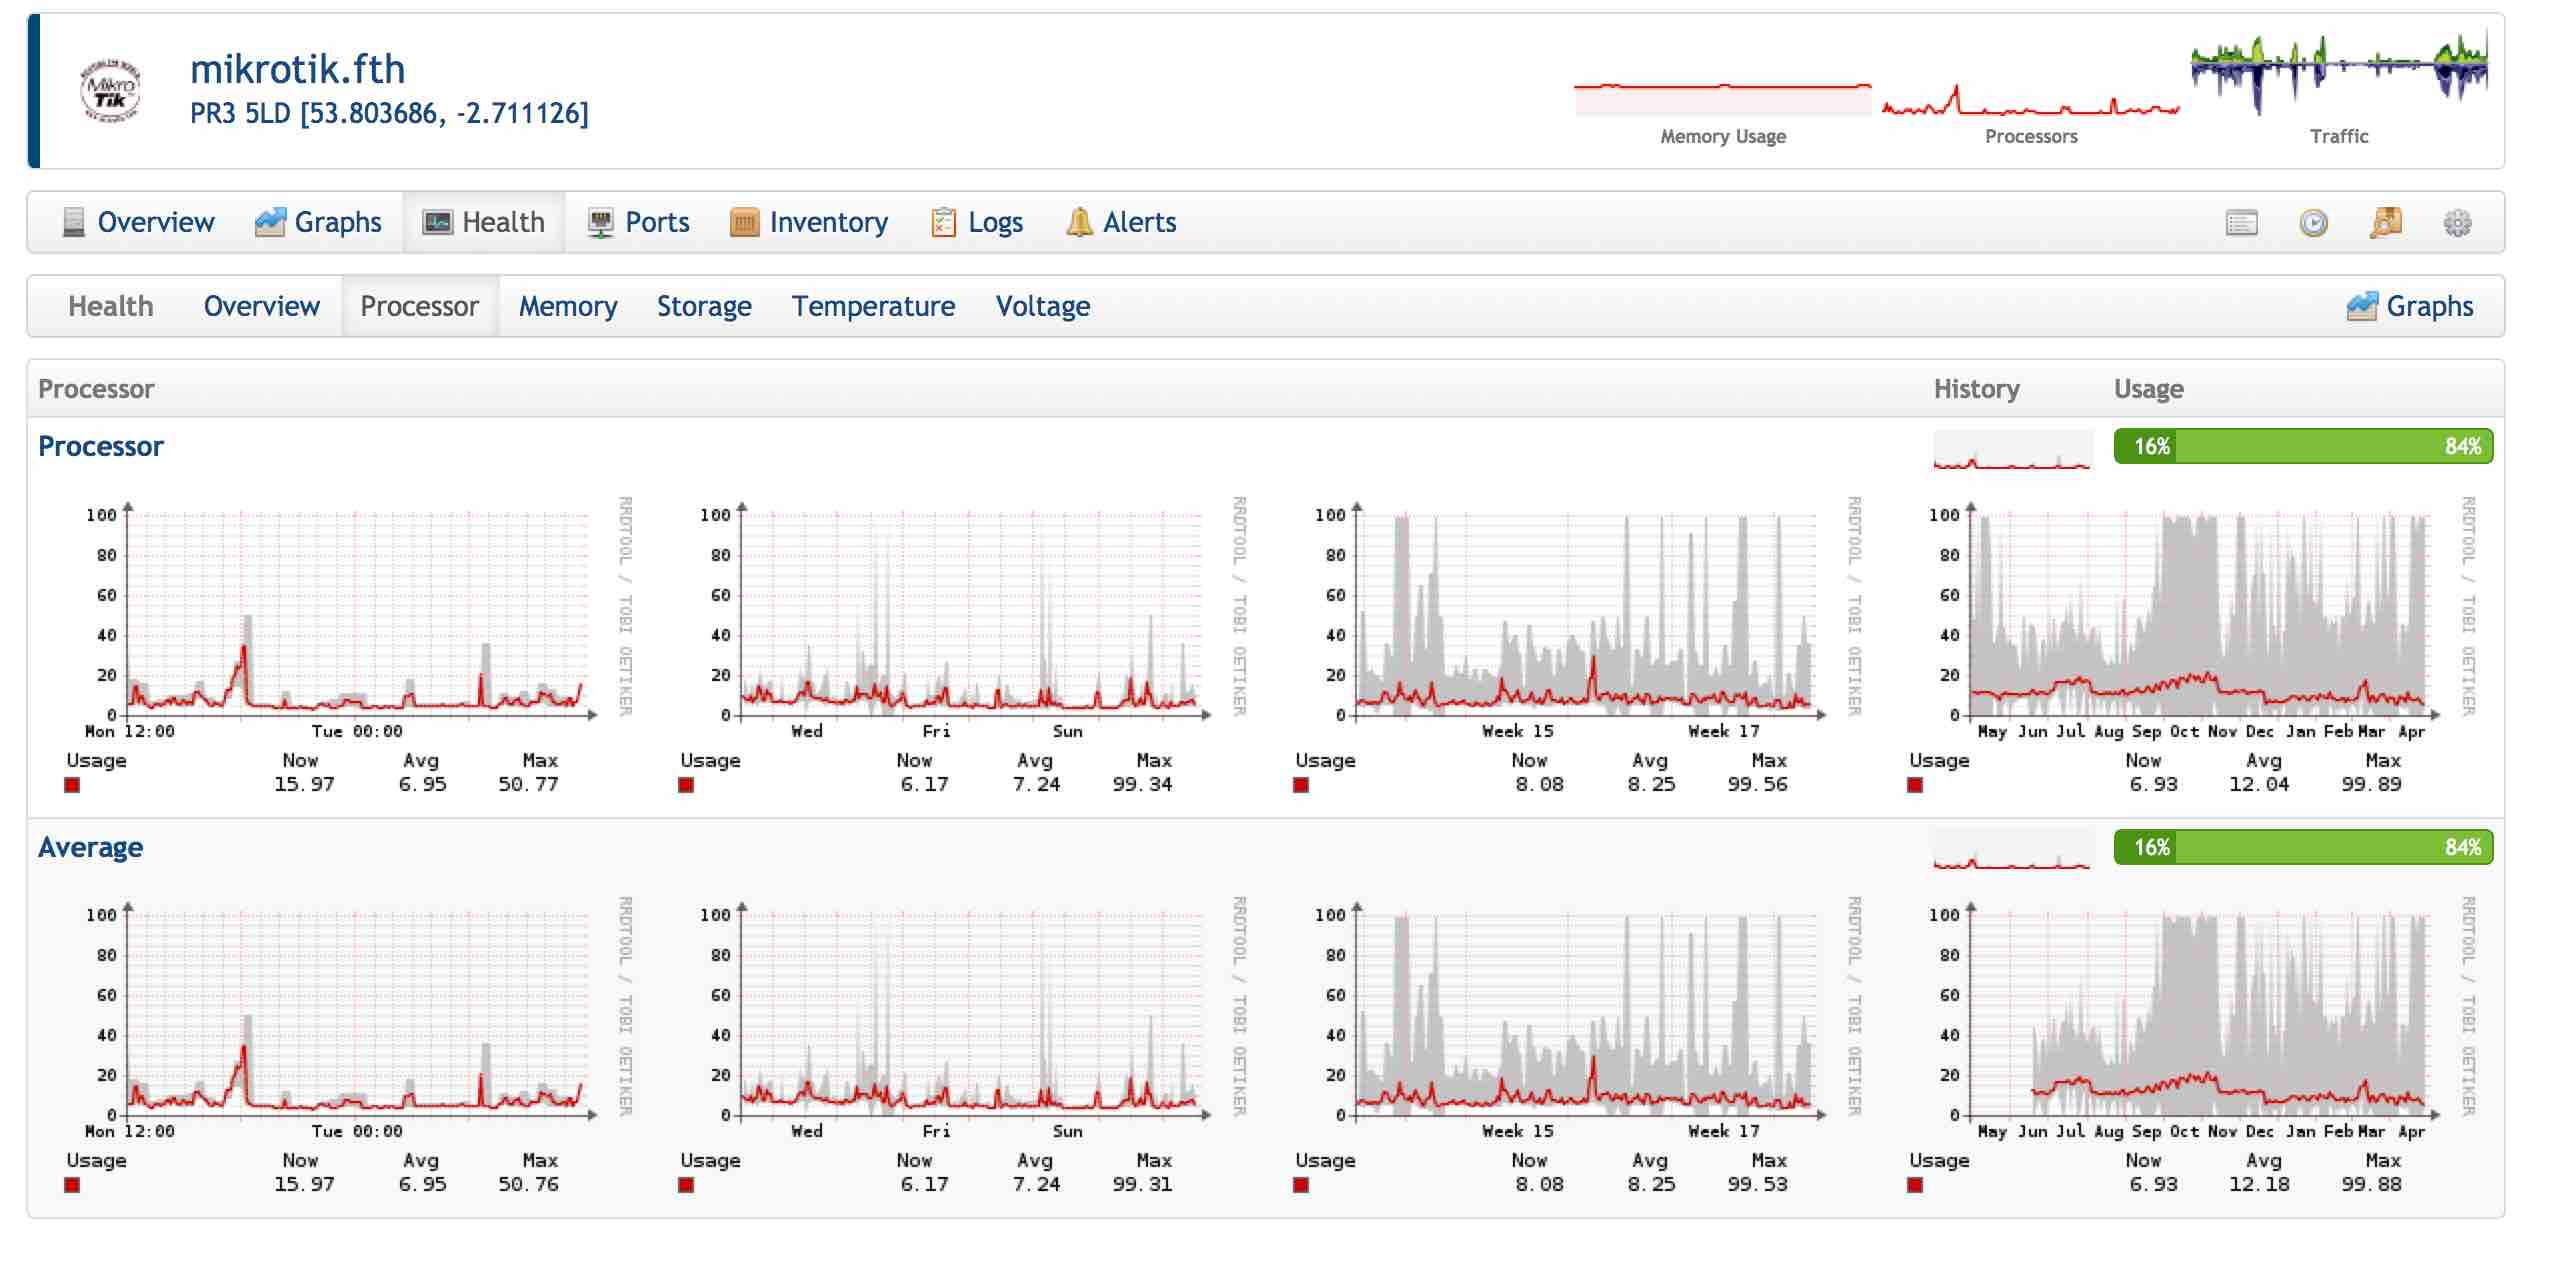
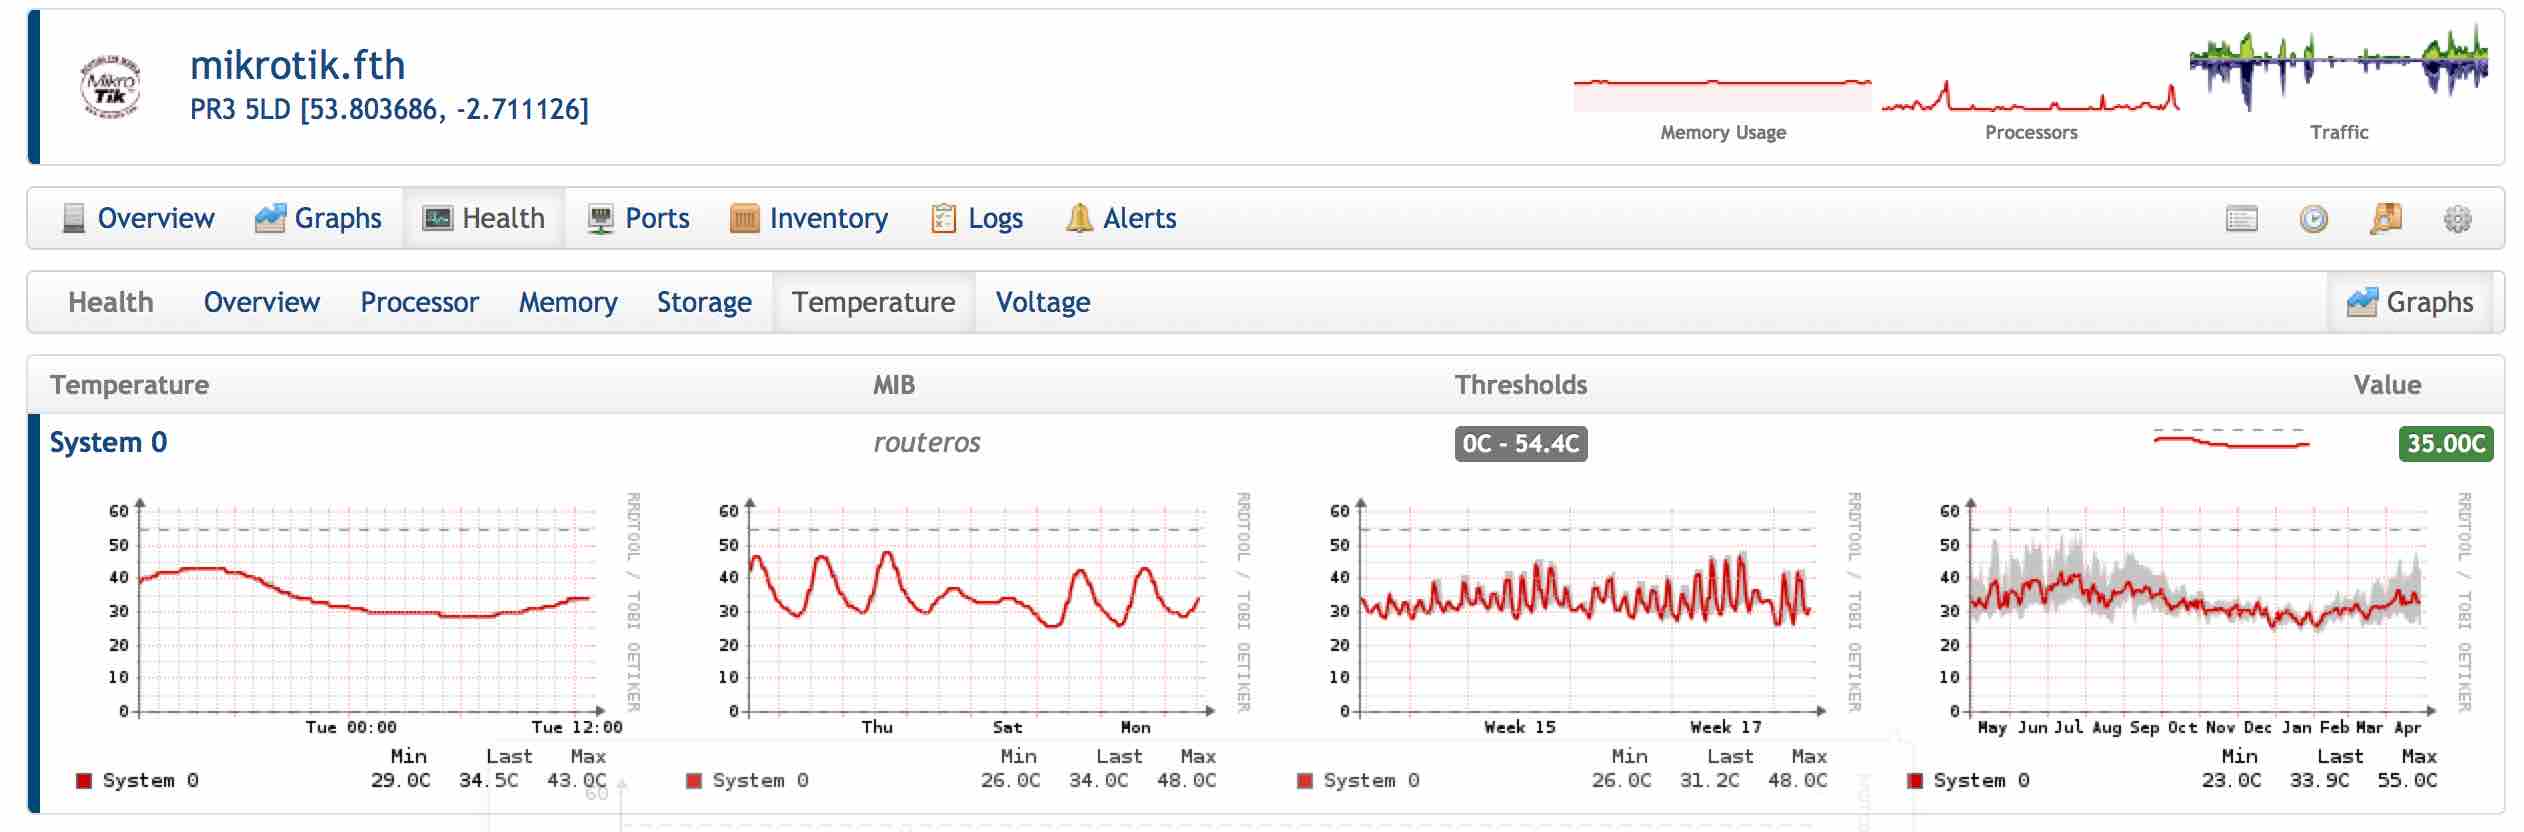
I go into one our mikrotik switches, click Health, then into Temperature
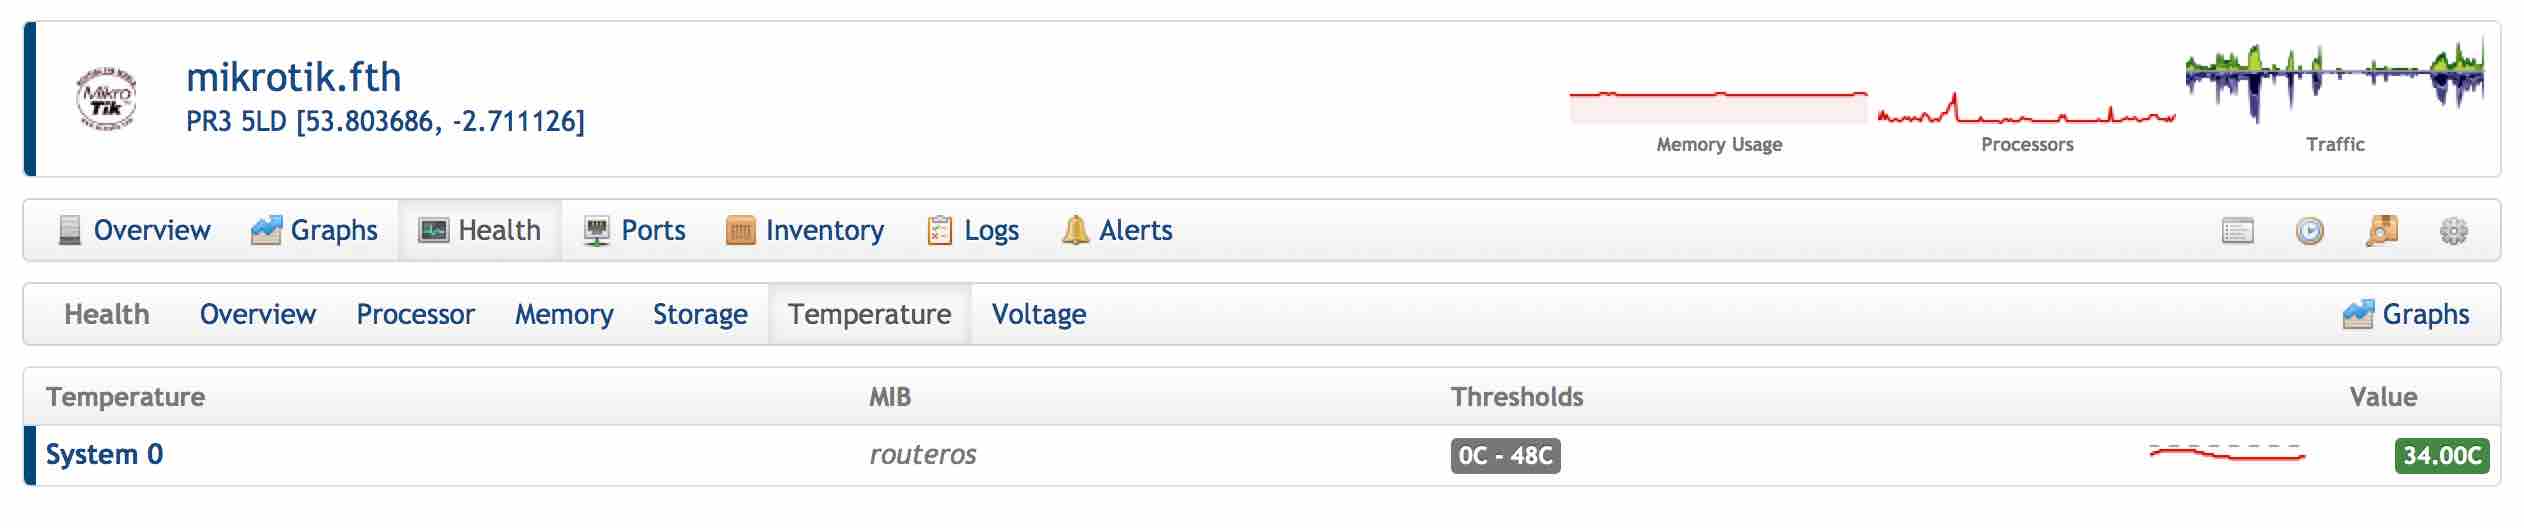
if i then click the System 0 the page just keeps refreshing and going back the the same page ?
it doesn’t appear to be taking me to the Temperature graphs ?
i’ve also noticed that the Temperature page isn’t showing any graphs unlike the Storage or Processor pages ?
Ive attached some screenshots showing what i mean ?
Regards
Simon

These things are by design.
Click the "graphs" on the right hand side to show graphs. Graphs are default off for sensor pages because those pages get HUGE on some devices.
Sensor entities currently don't have their own page, their links go to the relevant sensor type page (same with storage, processors, etc), so that link is also working as designed!
adam.
Sent from Mailbird [http://www.getmailbird.com/?utm_source=Mailbird&utm_medium=email&utm...] On 28/04/2015 11:57:49, Simon Smith simonsmith5521@gmail.com wrote: Hi All,
not sure if this is a bug with my browser or a bug with Observium
I go into one our mikrotik switches, click Health, then into Temperature
if i then click the System 0 the page just keeps refreshing and going back the the same page ?
it doesn’t appear to be taking me to the Temperature graphs ?
i’ve also noticed that the Temperature page isn’t showing any graphs unlike the Storage or Processor pages ?
Ive attached some screenshots showing what i mean ?
Regards
Simon
Hi Adam,
this doesn’t seem correct to me?
because if i Click Graphs i get the graphs listed underneath the System 0 as expected
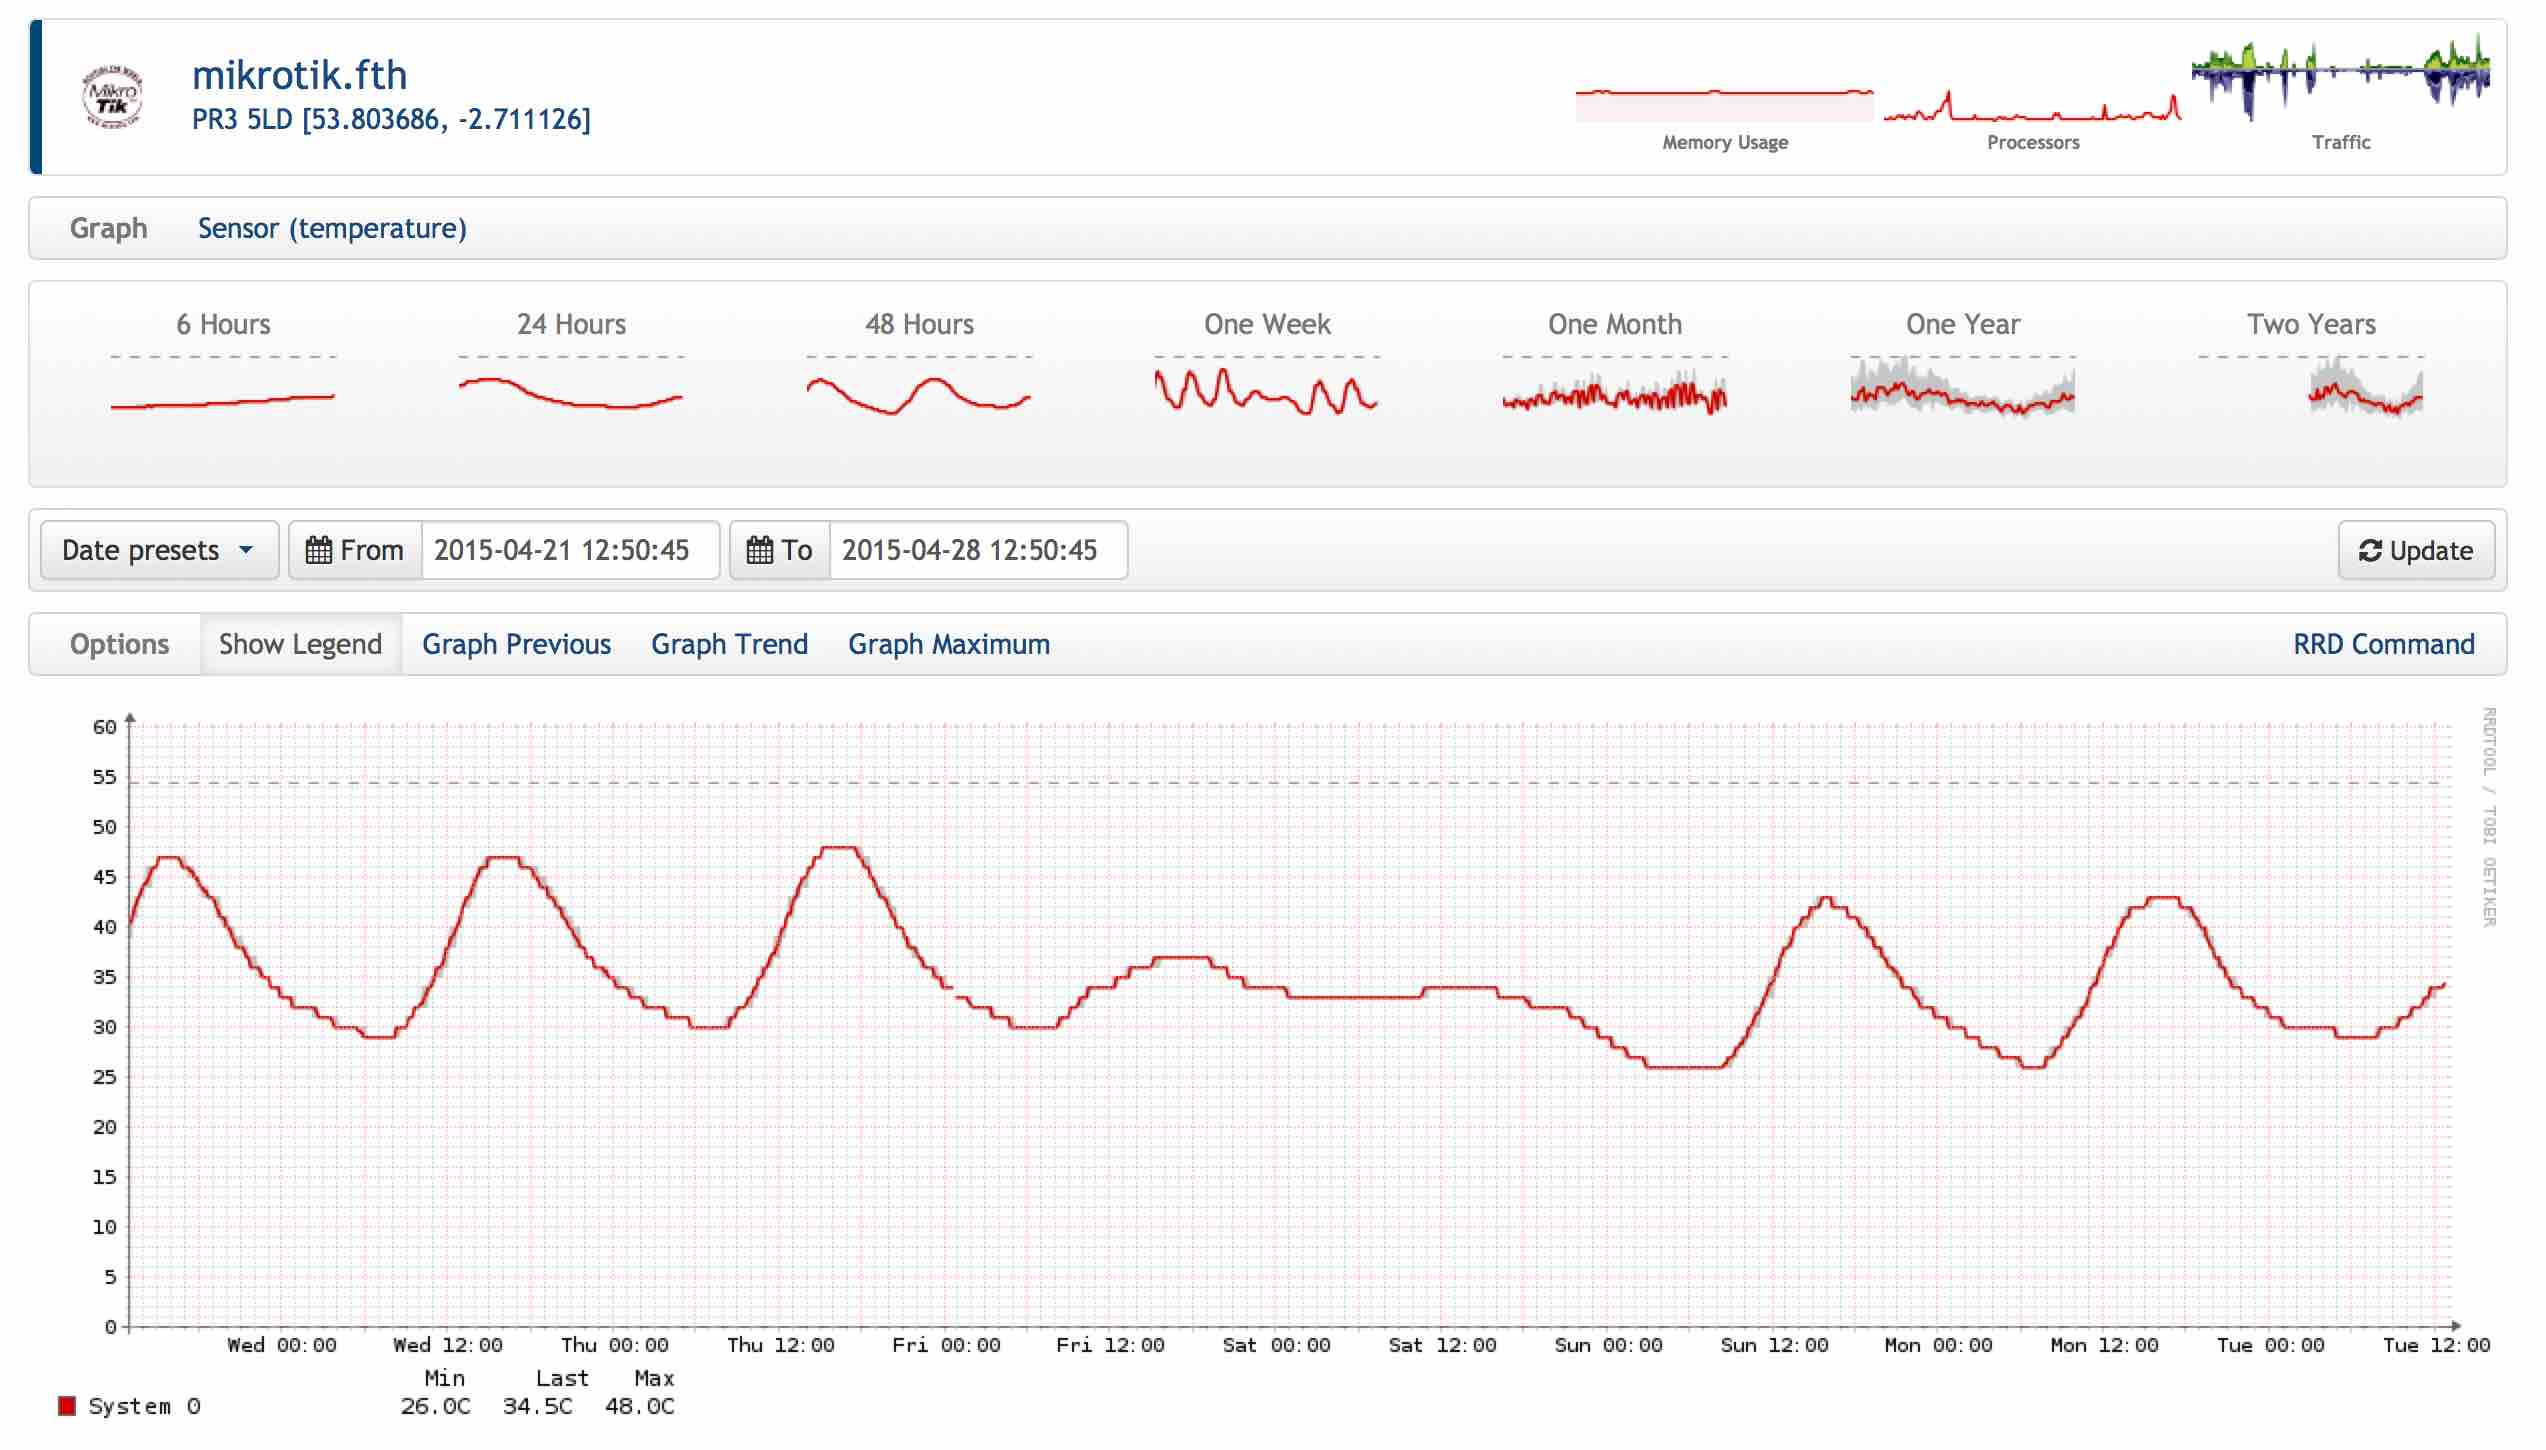
BUT if i click on one of the charts it goes to the Temperature graphs page ?
however whenever i click the System 0 link it goes nowhere and not to the Temperature Graphs Page ?
ive attached some screenshots again as I’m confused now?
Regards
Simon
On 28 Apr 2015, at 12:02 pm, Adam Armstrong adama@memetic.org wrote:
These things are by design.
Click the "graphs" on the right hand side to show graphs. Graphs are default off for sensor pages because those pages get HUGE on some devices.
Sensor entities currently don't have their own page, their links go to the relevant sensor type page (same with storage, processors, etc), so that link is also working as designed!
adam.
Sent from Mailbird http://www.getmailbird.com/?utm_source=Mailbird&utm_medium=email&utm_campaign=sent-from-mailbirdOn 28/04/2015 11:57:49, Simon Smith simonsmith5521@gmail.com wrote:
Hi All,
not sure if this is a bug with my browser or a bug with Observium
I go into one our mikrotik switches, click Health, then into Temperature
if i then click the System 0 the page just keeps refreshing and going back the the same page ?
it doesn’t appear to be taking me to the Temperature graphs ?
i’ve also noticed that the Temperature page isn’t showing any graphs unlike the Storage or Processor pages ?
Ive attached some screenshots showing what i mean ?
Regards
Simon
<processor.jpg>
observium mailing list observium@observium.org http://postman.memetic.org/cgi-bin/mailman/listinfo/observium
I've just checked these on my dev install, and all of the links work as intended.
adam.
Sent from Mailbird [http://www.getmailbird.com/?utm_source=Mailbird&utm_medium=email&utm...] On 28/04/2015 12:55:02, Simon Smith simonsmith5521@gmail.com wrote: Hi Adam,
this doesn’t seem correct to me?
because if i Click Graphs i get the graphs listed underneath the System 0 as expected
BUT if i click on one of the charts it goes to the Temperature graphs page ?
however whenever i click the System 0 link it goes nowhere and not to the Temperature Graphs Page ? ive attached some screenshots again as I’m confused now?
Regards
Simon
On 28 Apr 2015, at 12:02 pm, Adam Armstrong <adama@memetic.org [mailto:adama@memetic.org]> wrote:
These things are by design.
Click the "graphs" on the right hand side to show graphs. Graphs are default off for sensor pages because those pages get HUGE on some devices.
Sensor entities currently don't have their own page, their links go to the relevant sensor type page (same with storage, processors, etc), so that link is also working as designed!
adam.
Sent from Mailbird [http://www.getmailbird.com/?utm_source=Mailbird&utm_medium=email&utm...] On 28/04/2015 11:57:49, Simon Smith <simonsmith5521@gmail.com [mailto:simonsmith5521@gmail.com]> wrote: Hi All,
not sure if this is a bug with my browser or a bug with Observium
I go into one our mikrotik switches, click Health, then into Temperature
if i then click the System 0 the page just keeps refreshing and going back the the same page ?
it doesn’t appear to be taking me to the Temperature graphs ?
i’ve also noticed that the Temperature page isn’t showing any graphs unlike the Storage or Processor pages ?
Ive attached some screenshots showing what i mean ?
Regards
Simon
<processor.jpg> _______________________________________________ observium mailing list observium@observium.org [mailto:observium@observium.org] http://postman.memetic.org/cgi-bin/mailman/listinfo/observium
I will try a fresh install of observium SVN
any advise or links on doing a fresh install?
I want to keep my DB and RRD files
Simon
On 28 Apr 2015, at 12:57 pm, Adam Armstrong adama@memetic.org wrote:
I've just checked these on my dev install, and all of the links work as intended.
adam.
Sent from Mailbird http://www.getmailbird.com/?utm_source=Mailbird&utm_medium=email&utm_campaign=sent-from-mailbirdOn 28/04/2015 12:55:02, Simon Smith simonsmith5521@gmail.com wrote:
Hi Adam,
this doesn’t seem correct to me?
because if i Click Graphs i get the graphs listed underneath the System 0 as expected
BUT if i click on one of the charts it goes to the Temperature graphs page ?
however whenever i click the System 0 link it goes nowhere and not to the Temperature Graphs Page ?
ive attached some screenshots again as I’m confused now?
Regards
Simon
On 28 Apr 2015, at 12:02 pm, Adam Armstrong <adama@memetic.org mailto:adama@memetic.org> wrote:
These things are by design.
Click the "graphs" on the right hand side to show graphs. Graphs are default off for sensor pages because those pages get HUGE on some devices.
Sensor entities currently don't have their own page, their links go to the relevant sensor type page (same with storage, processors, etc), so that link is also working as designed!
adam.
Sent from Mailbird http://www.getmailbird.com/?utm_source=Mailbird&utm_medium=email&utm_campaign=sent-from-mailbirdOn 28/04/2015 11:57:49, Simon Smith <simonsmith5521@gmail.com mailto:simonsmith5521@gmail.com> wrote:
Hi All,
not sure if this is a bug with my browser or a bug with Observium
I go into one our mikrotik switches, click Health, then into Temperature
if i then click the System 0 the page just keeps refreshing and going back the the same page ?
it doesn’t appear to be taking me to the Temperature graphs ?
i’ve also noticed that the Temperature page isn’t showing any graphs unlike the Storage or Processor pages ?
Ive attached some screenshots showing what i mean ?
Regards
Simon
<processor.jpg>
observium mailing list observium@observium.org mailto:observium@observium.org http://postman.memetic.org/cgi-bin/mailman/listinfo/observium
observium mailing list observium@observium.org http://postman.memetic.org/cgi-bin/mailman/listinfo/observium
participants (2)
-
 Adam Armstrong
 -
 Simon Smith