Re: [Observium] False "device rebooted" message

It comes from SNMP. What does the uptime graph show?
Stefano Lobrano stefano.lobrano@staff.aruba.it wrote:
Hello List, I'm testing observium to monitor network devices in our datacenter, I've added a range of different devices and it seems all good, but today it has given me a false notice about a couple of nexus 5000 that are reported as "rebooted" while the switches are correctly reporting uptime of more than 600 days... All the other hosts are reported without errors, apparently.
I've looked in the mailing list archive and I found similar issues, with server, but I understand that was something resolved.
Where does observium takes the info about reboot?
Observium is installed in a VM: Observium 0.13.3.3824 Apache 2.2.22 (Ubuntu) PHP 5.3.10-1ubuntu3.6 MySQL 5.5.29-0ubuntu0.12.04.2 RRDtool 1.4.7
Thanks, Stefano _______________________________________________ observium mailing list observium@observium.org http://postman.memetic.org/cgi-bin/mailman/listinfo/observium

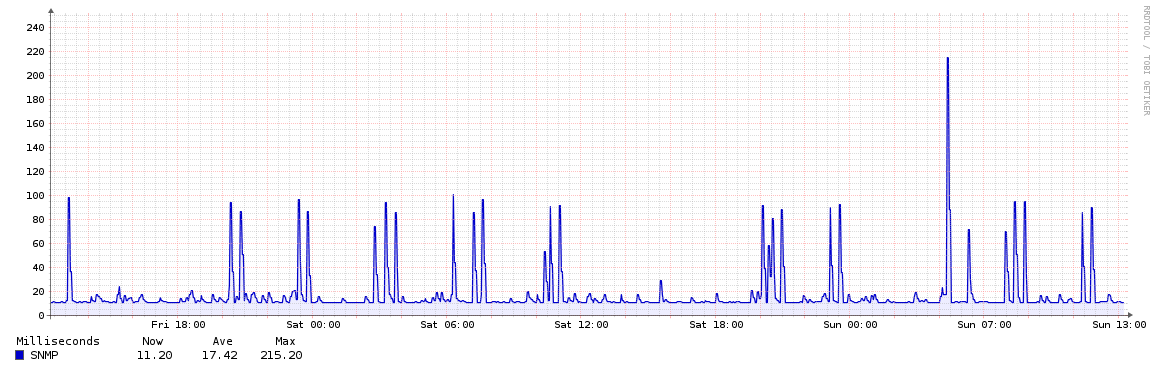
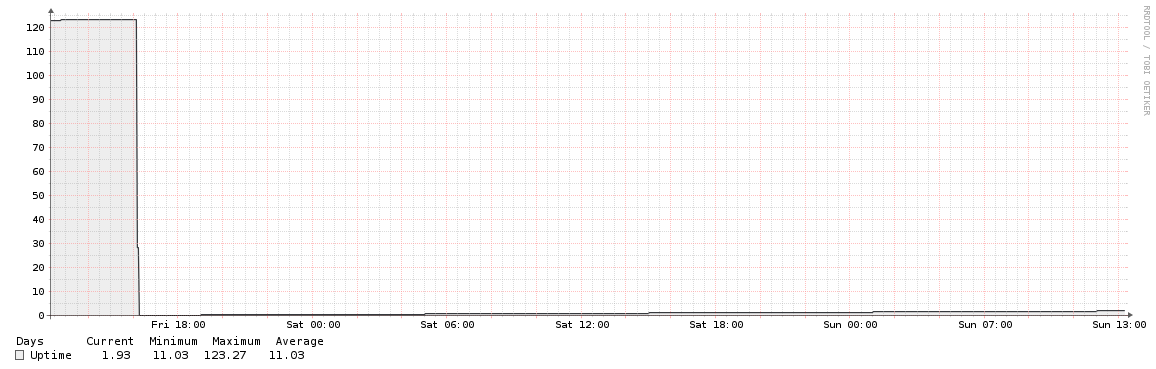
Hello Adam, thanks for your reply. Here are last 48 hrs snmp and uptime graphs.
Best, Stefano
Il 30/03/2013 07.46, Adam Armstrong ha scritto:
It comes from SNMP. What does the uptime graph show?
Stefano Lobrano stefano.lobrano@staff.aruba.it wrote:
Hello List, I'm testing observium to monitor network devices in our datacenter, I've added a range of different devices and it seems all good, but today it has given me a false notice about a couple of nexus 5000 that are reported as "rebooted" while the switches are correctly reporting uptime of more than 600 days... All the other hosts are reported without errors, apparently.
I've looked in the mailing list archive and I found similar issues, with server, but I understand that was something resolved.
Where does observium takes the info about reboot?
Observium is installed in a VM: Observium 0.13.3.3824 Apache 2.2.22 (Ubuntu) PHP 5.3.10-1ubuntu3.6 MySQL 5.5.29-0ubuntu0.12.04.2 RRDtool 1.4.7
Thanks, Stefano _______________________________________________ observium mailing list observium@observium.org http://postman.memetic.org/cgi-bin/mailman/listinfo/observium
observium mailing list observium@observium.org http://postman.memetic.org/cgi-bin/mailman/listinfo/observium
This looks like the counter wrapped at ~123 days.
adam.
On Sun, 31 Mar 2013 13:23:10 +0200, Stefano Lobrano stefano.lobrano@staff.aruba.it wrote:
Hello Adam, thanks for your reply. Here are last 48 hrs snmp and uptime graphs.
Best, Stefano
Il 30/03/2013 07.46, Adam Armstrong ha scritto:
It comes from SNMP. What does the uptime graph show?
Stefano Lobrano stefano.lobrano@staff.aruba.it wrote:
Hello List, I'm testing observium to monitor network devices in our datacenter,
I've
added a range of different devices and it seems all good, but today it has given me a false notice about a couple of nexus 5000 that are reported as "rebooted" while the switches are correctly reporting
uptime
of more than 600 days... All the other hosts are reported without errors, apparently.
I've looked in the mailing list archive and I found similar issues,
with
server, but I understand that was something resolved.
Where does observium takes the info about reboot?
Observium is installed in a VM: Observium 0.13.3.3824 Apache 2.2.22 (Ubuntu) PHP 5.3.10-1ubuntu3.6 MySQL 5.5.29-0ubuntu0.12.04.2 RRDtool 1.4.7
Thanks, Stefano _______________________________________________ observium mailing list observium@observium.org http://postman.memetic.org/cgi-bin/mailman/listinfo/observium
observium mailing list observium@observium.org http://postman.memetic.org/cgi-bin/mailman/listinfo/observium

On 03/31/2013 03:23 PM, Stefano Lobrano wrote:
Hello Adam, thanks for your reply. Here are last 48 hrs snmp and uptime graphs.
Best, Stefano
Please show your out for: php ./poller.php -r -d -m system -h <your_nexus_device>
and from device console: sh ver
Also found that information. Not sure that is your problem, but look at: http://www.cisco.com/en/US/ts/fn/635/fn63560.html
Il 30/03/2013 07.46, Adam Armstrong ha scritto:
It comes from SNMP. What does the uptime graph show?
Stefano Lobrano stefano.lobrano@staff.aruba.it wrote:
Hello List, I'm testing observium to monitor network devices in our datacenter, I've added a range of different devices and it seems all good, but today it has given me a false notice about a couple of nexus 5000 that are reported as "rebooted" while the switches are correctly reporting uptime of more than 600 days... All the other hosts are reported without errors, apparently.
I've looked in the mailing list archive and I found similar issues, with server, but I understand that was something resolved.
Where does observium takes the info about reboot?
Observium is installed in a VM: Observium 0.13.3.3824 Apache 2.2.22 (Ubuntu) PHP 5.3.10-1ubuntu3.6 MySQL 5.5.29-0ubuntu0.12.04.2 RRDtool 1.4.7
Thanks, Stefano _______________________________________________ observium mailing list observium@observium.org http://postman.memetic.org/cgi-bin/mailman/listinfo/observium
observium mailing list observium@observium.org http://postman.memetic.org/cgi-bin/mailman/listinfo/observium
This body part will be downloaded on demand.
Hello Mike, thanks for the FN, should not be that case, since it is a different OS versin, and the device has not actually rebooted.
Here is the output you required:
/opt/observium# php ./poller.php -r -d -m system -h wf2-n5k-st2
Observium Poller v0.13.3.3824

DEBUG!
Starting polling run:


SQL[SELECT `device_id` FROM `devices` WHERE `disabled` = 0 AND
`hostname` LIKE 'wf2-n5k-st2' ORDER BY `device_id` ASC]
SQL[SELECT * FROM `devices` WHERE `device_id` = '41']
SQL[SELECT * FROM devices_attribs WHERE `device_id` = '41']
wf2-n5k-st2 41 nxos (cisco)
DEBUG: SNMP Auth options =  -v2c -c <hidden>
/usr/bin/snmpget -v2c -c <hidden> -Oqv -m SNMPv2-MIB -M
/opt/observium/mibs udp:wf2-n5k-st2:161 sysObjectID.0
SNMPv2-SMI::enterprises.9.12.3.1.3.1084

[RRD Disabled]RRD[update /opt/observium/rrd/wf2-n5k-st2/status.rrd
N:1] [RRD Disabled]RRD[update
/opt/observium/rrd/wf2-n5k-st2/ping.rrd N:8.82] [RRD
Disabled]RRD[update /opt/observium/rrd/wf2-n5k-st2/ping_snmp.rrd
N:20.03] DEBUG: SNMP Auth options =  -v2c -c <hidden>
/usr/bin/snmpget -v2c -c <hidden> -OQUs -m SNMPv2-MIB -M
/opt/observium/mibs udp:wf2-n5k-st2:161 sysUpTime.0 sysLocation.0
sysContact.0 sysName.0
sysUpTime.0 = 3:19:17:57.66
sysLocation.0 = snmplocation
sysContact.0 = who@where
sysName.0 = WF2-N5k-St2

DEBUG: SNMP Auth options =  -v2c -c <hidden>
/usr/bin/snmpget -v2c -c <hidden> -Oqv -m SNMPv2-MIB -M
/opt/observium/mibs udp:wf2-n5k-st2:161 sysDescr.0
Cisco NX-OS(tm) n5000, Software (n5000-uk9), Version 5.0(3)N2(1),
RELEASE SOFTWARE Copyright (c) 2002-2011 by Cisco Systems, Inc.
Device Manager Version 5.2(1),  Compiled 6/13/2011 6:00:00

DEBUG: SNMP Auth options =  -v2c -c <hidden>
/usr/bin/snmpget -v2c -c <hidden> -Oqvn -m SNMPv2-MIB -M
/opt/observium/mibs udp:wf2-n5k-st2:161 sysObjectID.0
.1.3.6.1.4.1.9.12.3.1.3.1084

DEBUG: SNMP Auth options =  -v2c -c <hidden>
/usr/bin/snmpget -v2c -c <hidden> -Oqv -m HOST-RESOURCES-MIB -M
/opt/observium/mibs udp:wf2-n5k-st2:161 hrSystemUptime.0
No Such Object available on this agent at this OID

DEBUG: SNMP Auth options =  -v2c -c <hidden>
/usr/bin/snmpget -v2c -c <hidden> -OUqv -m SNMP-FRAMEWORK-MIB -M
/opt/observium/mibs udp:wf2-n5k-st2:161 snmpEngineTime.0
328677

Using SNMP Agent sysUpTime (328677 seconds)
[RRD Disabled]RRD[update /opt/observium/rrd/wf2-n5k-st2/uptime.rrd
N:328677] Uptime: 3 days, 19h 17m 57s
Polled in 0.153 seconds
Array
(
    [uptime] => 328677
    [last_polled] => Array
        (
            [0] => NOW()
        )

    [last_polled_timetaken] => 0.153
)
Updating wf2-n5k-st2 - 1

SQL[UPDATE `devices` set `uptime` ='328677',`last_polled`
=NOW(),`last_polled_timetaken` ='0.153' WHERE `device_id` = '41']
UPDATED!

SQL[INSERT INTO `perf_times`
(`type`,`doing`,`start`,`duration`,`devices`)  VALUES
('poll','wf2-n5k-st2','1364890842.5634','0.157','1')] ./poller.php
wf2-n5k-st2 April 2, 2013, 10:20 - 1 devices polled in 0.157 secs

MySQL: Cell[0/0s] Row[1/0s] Rows[0/0s] Column[0/0s] Update[1/0s]
Insert[1/0s] Delete[0/0s]
and here is sh ver:
WF2-N5k-St2# sh version
Cisco Nexus Operating System (NX-OS) Software
TAC support: http://www.cisco.com/tac
Copyright (c) 2002-2011, Cisco Systems, Inc. All rights reserved.
The copyrights to certain works contained herein are owned by
other third parties and are used and distributed under license.
Some parts of this software are covered under the GNU Public
License. A copy of the license is available at
http://www.gnu.org/licenses/gpl.html.

Software
  BIOS:      version 3.5.0
  loader:    version N/A
  kickstart: version 5.0(3)N2(1)
  system:    version 5.0(3)N2(1)
  power-seq: Module 1: version v1.0
             Module 3: version v2.0
  uC:        version v1.2.0.1
  SFP uC:    Module 1: v1.0.0.0
  BIOS compile time:       02/03/2011
  kickstart image file is: bootflash:/n5000-uk9-kickstart.5.0.3.N2.1.bin
  kickstart compile time:  6/13/2011 6:00:00 [06/13/2011 13:43:33]
  system image file is:    bootflash:/n5000-uk9.5.0.3.N2.1.bin
  system compile time:     6/13/2011 6:00:00 [06/13/2011 15:33:42]


Hardware
  cisco Nexus5548 Chassis ("O2 32X10GE/Modular Universal Platform
Supervisor")
  Intel(R) Xeon(R) CPU         with 8299528 kB of memory.
  Processor Board ID JAF1522ANPN

  Device name: WF2-N5k-St2
  bootflash:    1908736 kB

Kernel uptime is 619 day(s), 16 hour(s), 58 minute(s), 43 second(s)

Last reset at 471009 usecs after  Fri Jul 22 15:09:54 2011

  Reason: Powered-down due to fan policy trigger
  System version: 5.0(3)N2(1)
  Service:

plugin
  Core Plugin, Ethernet Plugin
WF2-N5k-St2#
Il 01/04/2013 12.41, Mike Stupalov ha scritto:
On 03/31/2013 03:23 PM, Stefano Lobrano wrote:
Hello Adam, thanks for your reply. Here are last 48 hrs snmp and uptime graphs.
Best, Stefano
Please show your out for: php ./poller.php -r -d -m system -h <your_nexus_device>
and from device console: sh ver
Also found that information. Not sure that is your problem, but look at: http://www.cisco.com/en/US/ts/fn/635/fn63560.html
Il 30/03/2013 07.46, Adam Armstrong ha scritto:
It comes from SNMP. What does the uptime graph show?
Stefano Lobrano stefano.lobrano@staff.aruba.it wrote:
Hello List, I'm testing observium to monitor network devices in our datacenter, I've added a range of different devices and it seems all good, but today it has given me a false notice about a couple of nexus 5000 that are reported as "rebooted" while the switches are correctly reporting uptime of more than 600 days... All the other hosts are reported without errors, apparently.
I've looked in the mailing list archive and I found similar issues, with server, but I understand that was something resolved.
Where does observium takes the info about reboot?
Observium is installed in a VM: Observium 0.13.3.3824 Apache 2.2.22 (Ubuntu) PHP 5.3.10-1ubuntu3.6 MySQL 5.5.29-0ubuntu0.12.04.2 RRDtool 1.4.7
Thanks, Stefano _______________________________________________ observium mailing list observium@observium.org http://postman.memetic.org/cgi-bin/mailman/listinfo/observium
observium mailing list observium@observium.org http://postman.memetic.org/cgi-bin/mailman/listinfo/observium
This body part will be downloaded on demand.
observium mailing list observium@observium.org http://postman.memetic.org/cgi-bin/mailman/listinfo/observium
On 04/02/2013 12:32 PM, Stefano Lobrano wrote:
Hello Mike, thanks for the FN, should not be that case, since it is a different OS versin, and the device has not actually rebooted.
Ok. Observium shows what gives your device over snmp. I see that 64bit counter (snmpEngineTime) equal to 32bit counter (sysUpTime). Therefore, the only suggestion that this is a mistake of your version NX-OS.
This is very similar to bug: CSCtx96459 http://tools.cisco.com/Support/BugToolKit/search/getBugDetails.do?method=fet...
I suggest to upgrade your NX-OS (minimum to 5.2(1)N1(1)) or contact Cisco support (but most likely they will be offered the same).
Here is the output you required:
/opt/observium# php ./poller.php -r -d -m system -h wf2-n5k-st2
Observium Poller v0.13.3.3824

DEBUG!
Starting polling run:


SQL[SELECT `device_id` FROM `devices` WHERE `disabled` = 0 AND
`hostname` LIKE 'wf2-n5k-st2' ORDER BY `device_id` ASC]
SQL[SELECT * FROM `devices` WHERE `device_id` = '41']
SQL[SELECT * FROM devices_attribs WHERE `device_id` = '41']
wf2-n5k-st2 41 nxos (cisco)
DEBUG: SNMP Auth options =  -v2c -c <hidden>
/usr/bin/snmpget -v2c -c <hidden> -Oqv -m SNMPv2-MIB -M
/opt/observium/mibs udp:wf2-n5k-st2:161 sysObjectID.0
SNMPv2-SMI::enterprises.9.12.3.1.3.1084

[RRD Disabled]RRD[update /opt/observium/rrd/wf2-n5k-st2/status.rrd
N:1] [RRD Disabled]RRD[update
/opt/observium/rrd/wf2-n5k-st2/ping.rrd N:8.82] [RRD
Disabled]RRD[update /opt/observium/rrd/wf2-n5k-st2/ping_snmp.rrd
N:20.03] DEBUG: SNMP Auth options =  -v2c -c <hidden>
/usr/bin/snmpget -v2c -c <hidden> -OQUs -m SNMPv2-MIB -M
/opt/observium/mibs udp:wf2-n5k-st2:161 sysUpTime.0 sysLocation.0
sysContact.0 sysName.0
sysUpTime.0 = 3:19:17:57.66
sysLocation.0 = snmplocation
sysContact.0 = who@where
sysName.0 = WF2-N5k-St2

DEBUG: SNMP Auth options =  -v2c -c <hidden>
/usr/bin/snmpget -v2c -c <hidden> -Oqv -m SNMPv2-MIB -M
/opt/observium/mibs udp:wf2-n5k-st2:161 sysDescr.0
Cisco NX-OS(tm) n5000, Software (n5000-uk9), Version 5.0(3)N2(1),
RELEASE SOFTWARE Copyright (c) 2002-2011 by Cisco Systems, Inc.
Device Manager Version 5.2(1),  Compiled 6/13/2011 6:00:00

DEBUG: SNMP Auth options =  -v2c -c <hidden>
/usr/bin/snmpget -v2c -c <hidden> -Oqvn -m SNMPv2-MIB -M
/opt/observium/mibs udp:wf2-n5k-st2:161 sysObjectID.0
.1.3.6.1.4.1.9.12.3.1.3.1084

DEBUG: SNMP Auth options =  -v2c -c <hidden>
/usr/bin/snmpget -v2c -c <hidden> -Oqv -m HOST-RESOURCES-MIB -M
/opt/observium/mibs udp:wf2-n5k-st2:161 hrSystemUptime.0
No Such Object available on this agent at this OID

DEBUG: SNMP Auth options =  -v2c -c <hidden>
/usr/bin/snmpget -v2c -c <hidden> -OUqv -m SNMP-FRAMEWORK-MIB -M
/opt/observium/mibs udp:wf2-n5k-st2:161 snmpEngineTime.0
328677

Using SNMP Agent sysUpTime (328677 seconds)
[RRD Disabled]RRD[update /opt/observium/rrd/wf2-n5k-st2/uptime.rrd
N:328677] Uptime: 3 days, 19h 17m 57s
Polled in 0.153 seconds
Array
(
    [uptime] => 328677
    [last_polled] => Array
        (
            [0] => NOW()
        )

    [last_polled_timetaken] => 0.153
)
Updating wf2-n5k-st2 - 1

SQL[UPDATE `devices` set `uptime` ='328677',`last_polled`
=NOW(),`last_polled_timetaken` ='0.153' WHERE `device_id` = '41']
UPDATED!

SQL[INSERT INTO `perf_times`
(`type`,`doing`,`start`,`duration`,`devices`)  VALUES
('poll','wf2-n5k-st2','1364890842.5634','0.157','1')] ./poller.php
wf2-n5k-st2 April 2, 2013, 10:20 - 1 devices polled in 0.157 secs

MySQL: Cell[0/0s] Row[1/0s] Rows[0/0s] Column[0/0s] Update[1/0s]
Insert[1/0s] Delete[0/0s]
and here is sh ver:
WF2-N5k-St2# sh version
Cisco Nexus Operating System (NX-OS) Software
TAC support: http://www.cisco.com/tac
Copyright (c) 2002-2011, Cisco Systems, Inc. All rights reserved.
The copyrights to certain works contained herein are owned by
other third parties and are used and distributed under license.
Some parts of this software are covered under the GNU Public
License. A copy of the license is available at
http://www.gnu.org/licenses/gpl.html.

Software
  BIOS:      version 3.5.0
  loader:    version N/A
  kickstart: version 5.0(3)N2(1)
  system:    version 5.0(3)N2(1)
  power-seq: Module 1: version v1.0
             Module 3: version v2.0
  uC:        version v1.2.0.1
  SFP uC:    Module 1: v1.0.0.0
  BIOS compile time:       02/03/2011
  kickstart image file is:
  bootflash:/n5000-uk9-kickstart.5.0.3.N2.1.bin
  kickstart compile time:  6/13/2011 6:00:00 [06/13/2011 13:43:33]
  system image file is:    bootflash:/n5000-uk9.5.0.3.N2.1.bin
  system compile time:     6/13/2011 6:00:00 [06/13/2011 15:33:42]


Hardware
  cisco Nexus5548 Chassis ("O2 32X10GE/Modular Universal Platform
Supervisor")
  Intel(R) Xeon(R) CPU         with 8299528 kB of memory.
  Processor Board ID JAF1522ANPN

  Device name: WF2-N5k-St2
  bootflash:    1908736 kB

Kernel uptime is 619 day(s), 16 hour(s), 58 minute(s), 43 second(s)

Last reset at 471009 usecs after  Fri Jul 22 15:09:54 2011

  Reason: Powered-down due to fan policy trigger
  System version: 5.0(3)N2(1)
  Service:

plugin
  Core Plugin, Ethernet Plugin
WF2-N5k-St2#
Il 01/04/2013 12.41, Mike Stupalov ha scritto:
On 03/31/2013 03:23 PM, Stefano Lobrano wrote:
Hello Adam, thanks for your reply. Here are last 48 hrs snmp and uptime graphs.
Best, Stefano
Please show your out for: php ./poller.php -r -d -m system -h <your_nexus_device>
and from device console: sh ver
Also found that information. Not sure that is your problem, but look at: http://www.cisco.com/en/US/ts/fn/635/fn63560.html
Il 30/03/2013 07.46, Adam Armstrong ha scritto:
It comes from SNMP. What does the uptime graph show?
Stefano Lobrano stefano.lobrano@staff.aruba.it wrote:
Hello List, I'm testing observium to monitor network devices in our datacenter, I've added a range of different devices and it seems all good, but today it has given me a false notice about a couple of nexus 5000 that are reported as "rebooted" while the switches are correctly reporting uptime of more than 600 days... All the other hosts are reported without errors, apparently.
I've looked in the mailing list archive and I found similar issues, with server, but I understand that was something resolved.
Where does observium takes the info about reboot?
Observium is installed in a VM: Observium 0.13.3.3824 Apache 2.2.22 (Ubuntu) PHP 5.3.10-1ubuntu3.6 MySQL 5.5.29-0ubuntu0.12.04.2 RRDtool 1.4.7
Thanks, Stefano _______________________________________________ observium mailing list observium@observium.org http://postman.memetic.org/cgi-bin/mailman/listinfo/observium
observium mailing list observium@observium.org http://postman.memetic.org/cgi-bin/mailman/listinfo/observium
This body part will be downloaded on demand.
observium mailing list observium@observium.org http://postman.memetic.org/cgi-bin/mailman/listinfo/observium
And thus ends chapter 349283492 of the never-ending saga of the shittily reported router-uptimes.
adam.
On Tue, 02 Apr 2013 13:28:49 +0400, Mike Stupalov landy2005@gmail.com wrote:
On 04/02/2013 12:32 PM, Stefano Lobrano wrote:
Hello Mike, thanks for the FN, should not be that case, since it is a different OS versin, and the device has not actually rebooted.
Ok. Observium shows what gives your device over snmp. I see that 64bit counter (snmpEngineTime) equal to 32bit counter (sysUpTime). Therefore, the only suggestion that this is a mistake of your version NX-OS.
This is very similar to bug: CSCtx96459
http://tools.cisco.com/Support/BugToolKit/search/getBugDetails.do?method=fet...
I suggest to upgrade your NX-OS (minimum to 5.2(1)N1(1)) or contact Cisco support (but most likely they will be offered the same).
Here is the output you required:
 /opt/observium# php ./poller.php -r -d -m system -h wf2-n5k-st2
 Observium Poller v0.13.3.3824

 DEBUG!
 Starting polling run:


 SQL[SELECT `device_id` FROM `devices` WHERE `disabled` = 0 AND
 `hostname` LIKE 'wf2-n5k-st2' ORDER BY `device_id` ASC]
 SQL[SELECT * FROM `devices` WHERE `device_id` = '41']
 SQL[SELECT * FROM devices_attribs WHERE `device_id` = '41']
 wf2-n5k-st2 41 nxos (cisco)
 DEBUG: SNMP Auth options =  -v2c -c <hidden>
 /usr/bin/snmpget -v2c -c <hidden> -Oqv -m SNMPv2-MIB -M
 /opt/observium/mibs udp:wf2-n5k-st2:161 sysObjectID.0
 SNMPv2-SMI::enterprises.9.12.3.1.3.1084

 [RRD Disabled]RRD[update /opt/observium/rrd/wf2-n5k-st2/status.rrd
 N:1] [RRD Disabled]RRD[update
 /opt/observium/rrd/wf2-n5k-st2/ping.rrd N:8.82] [RRD
 Disabled]RRD[update /opt/observium/rrd/wf2-n5k-st2/ping_snmp.rrd
 N:20.03] DEBUG: SNMP Auth options =  -v2c -c <hidden>
 /usr/bin/snmpget -v2c -c <hidden> -OQUs -m SNMPv2-MIB -M
 /opt/observium/mibs udp:wf2-n5k-st2:161 sysUpTime.0 sysLocation.0
 sysContact.0 sysName.0
 sysUpTime.0 = 3:19:17:57.66
 sysLocation.0 = snmplocation
 sysContact.0 = who@where
 sysName.0 = WF2-N5k-St2

 DEBUG: SNMP Auth options =  -v2c -c <hidden>
 /usr/bin/snmpget -v2c -c <hidden> -Oqv -m SNMPv2-MIB -M
 /opt/observium/mibs udp:wf2-n5k-st2:161 sysDescr.0
 Cisco NX-OS(tm) n5000, Software (n5000-uk9), Version 5.0(3)N2(1),
 RELEASE SOFTWARE Copyright (c) 2002-2011 by Cisco Systems, Inc.
 Device Manager Version 5.2(1),  Compiled 6/13/2011 6:00:00

 DEBUG: SNMP Auth options =  -v2c -c <hidden>
 /usr/bin/snmpget -v2c -c <hidden> -Oqvn -m SNMPv2-MIB -M
 /opt/observium/mibs udp:wf2-n5k-st2:161 sysObjectID.0
 .1.3.6.1.4.1.9.12.3.1.3.1084

 DEBUG: SNMP Auth options =  -v2c -c <hidden>
 /usr/bin/snmpget -v2c -c <hidden> -Oqv -m HOST-RESOURCES-MIB -M
 /opt/observium/mibs udp:wf2-n5k-st2:161 hrSystemUptime.0
 No Such Object available on this agent at this OID

 DEBUG: SNMP Auth options =  -v2c -c <hidden>
 /usr/bin/snmpget -v2c -c <hidden> -OUqv -m SNMP-FRAMEWORK-MIB -M
 /opt/observium/mibs udp:wf2-n5k-st2:161 snmpEngineTime.0
 328677

 Using SNMP Agent sysUpTime (328677 seconds)
 [RRD Disabled]RRD[update /opt/observium/rrd/wf2-n5k-st2/uptime.rrd
 N:328677] Uptime: 3 days, 19h 17m 57s
 Polled in 0.153 seconds
 Array
 (
     [uptime] => 328677
     [last_polled] => Array
         (
             [0] => NOW()
         )

     [last_polled_timetaken] => 0.153
 )
 Updating wf2-n5k-st2 - 1

 SQL[UPDATE `devices` set `uptime` ='328677',`last_polled`
 =NOW(),`last_polled_timetaken` ='0.153' WHERE `device_id` = '41']
 UPDATED!

 SQL[INSERT INTO `perf_times`
 (`type`,`doing`,`start`,`duration`,`devices`)  VALUES
 ('poll','wf2-n5k-st2','1364890842.5634','0.157','1')] ./poller.php
 wf2-n5k-st2 April 2, 2013, 10:20 - 1 devices polled in 0.157 secs

 MySQL: Cell[0/0s] Row[1/0s] Rows[0/0s] Column[0/0s] Update[1/0s]
 Insert[1/0s] Delete[0/0s]
and here is sh ver:
 WF2-N5k-St2# sh version
 Cisco Nexus Operating System (NX-OS) Software
 TAC support: http://www.cisco.com/tac
 Copyright (c) 2002-2011, Cisco Systems, Inc. All rights reserved.
 The copyrights to certain works contained herein are owned by
 other third parties and are used and distributed under license.
 Some parts of this software are covered under the GNU Public
 License. A copy of the license is available at
 http://www.gnu.org/licenses/gpl.html.

 Software
   BIOS:      version 3.5.0
   loader:    version N/A
   kickstart: version 5.0(3)N2(1)
   system:    version 5.0(3)N2(1)
   power-seq: Module 1: version v1.0
              Module 3: version v2.0
   uC:        version v1.2.0.1
   SFP uC:    Module 1: v1.0.0.0
   BIOS compile time:       02/03/2011
   kickstart image file is: bootflash:/n5000-uk9-kickstart.5.0.3.N2.1.bin
   kickstart compile time:  6/13/2011 6:00:00 [06/13/2011 13:43:33]
   system image file is:    bootflash:/n5000-uk9.5.0.3.N2.1.bin
   system compile time:     6/13/2011 6:00:00 [06/13/2011 15:33:42]


 Hardware
   cisco Nexus5548 Chassis ("O2 32X10GE/Modular Universal Platform
 Supervisor")
   Intel(R) Xeon(R) CPU         with 8299528 kB of memory.
   Processor Board ID JAF1522ANPN

   Device name: WF2-N5k-St2
   bootflash:    1908736 kB

 Kernel uptime is 619 day(s), 16 hour(s), 58 minute(s), 43 second(s)

 Last reset at 471009 usecs after  Fri Jul 22 15:09:54 2011

   Reason: Powered-down due to fan policy trigger
   System version: 5.0(3)N2(1)
   Service:

 plugin
   Core Plugin, Ethernet Plugin
 WF2-N5k-St2#
Il 01/04/2013 12.41, Mike Stupalov ha scritto:
On 03/31/2013 03:23 PM, Stefano Lobrano wrote:
Hello Adam, thanks for your reply. Here are last 48 hrs snmp and uptime graphs.
Best, Stefano
Please show your out for: php ./poller.php -r -d -m system -h <your_nexus_device>
and from device console: sh ver
Also found that information. Not sure that is your problem, but look
at:
http://www.cisco.com/en/US/ts/fn/635/fn63560.html
Il 30/03/2013 07.46, Adam Armstrong ha scritto:
It comes from SNMP. What does the uptime graph show?
Stefano Lobrano stefano.lobrano@staff.aruba.it wrote:
Hello List, I'm testing observium to monitor network devices in our datacenter, I've added a range of different devices and it seems all good, but today it has given me a false notice about a couple of nexus 5000 that are reported as "rebooted" while the switches are correctly reporting uptime of more than 600 days... All the other hosts are reported without errors, apparently.
I've looked in the mailing list archive and I found similar issues, with server, but I understand that was something resolved.
Where does observium takes the info about reboot?
Observium is installed in a VM: Observium 0.13.3.3824 Apache 2.2.22 (Ubuntu) PHP 5.3.10-1ubuntu3.6 MySQL 5.5.29-0ubuntu0.12.04.2 RRDtool 1.4.7
Thanks, Stefano _______________________________________________ observium mailing list observium@observium.org http://postman.memetic.org/cgi-bin/mailman/listinfo/observium
observium mailing list observium@observium.org http://postman.memetic.org/cgi-bin/mailman/listinfo/observium
This body part will be downloaded on demand.
observium mailing list observium@observium.org http://postman.memetic.org/cgi-bin/mailman/listinfo/observium
Mike, thanks a lot for clarification, this solves the issue. I'm aware NXOS version is old, upgrade is planned.
I'l keep experimenting with Observium.
Thanks again, Stefano
Il 02/04/2013 11.28, Mike Stupalov ha scritto:
On 04/02/2013 12:32 PM, Stefano Lobrano wrote:
Hello Mike, thanks for the FN, should not be that case, since it is a different OS versin, and the device has not actually rebooted.
Ok. Observium shows what gives your device over snmp. I see that 64bit counter (snmpEngineTime) equal to 32bit counter (sysUpTime). Therefore, the only suggestion that this is a mistake of your version NX-OS.
This is very similar to bug: CSCtx96459 http://tools.cisco.com/Support/BugToolKit/search/getBugDetails.do?method=fet...
I suggest to upgrade your NX-OS (minimum to 5.2(1)N1(1)) or contact Cisco support (but most likely they will be offered the same).
Here is the output you required:
/opt/observium# php ./poller.php -r -d -m system -h wf2-n5k-st2
Observium Poller v0.13.3.3824

DEBUG!
Starting polling run:


SQL[SELECT `device_id` FROM `devices` WHERE `disabled` = 0 AND
`hostname` LIKE 'wf2-n5k-st2' ORDER BY `device_id` ASC]
SQL[SELECT * FROM `devices` WHERE `device_id` = '41']
SQL[SELECT * FROM devices_attribs WHERE `device_id` = '41']
wf2-n5k-st2 41 nxos (cisco)
DEBUG: SNMP Auth options =  -v2c -c <hidden>
/usr/bin/snmpget -v2c -c <hidden> -Oqv -m SNMPv2-MIB -M
/opt/observium/mibs udp:wf2-n5k-st2:161 sysObjectID.0
SNMPv2-SMI::enterprises.9.12.3.1.3.1084

[RRD Disabled]RRD[update /opt/observium/rrd/wf2-n5k-st2/status.rrd
N:1] [RRD Disabled]RRD[update
/opt/observium/rrd/wf2-n5k-st2/ping.rrd N:8.82] [RRD
Disabled]RRD[update /opt/observium/rrd/wf2-n5k-st2/ping_snmp.rrd
N:20.03] DEBUG: SNMP Auth options =  -v2c -c <hidden>
/usr/bin/snmpget -v2c -c <hidden> -OQUs -m SNMPv2-MIB -M
/opt/observium/mibs udp:wf2-n5k-st2:161 sysUpTime.0 sysLocation.0
sysContact.0 sysName.0
sysUpTime.0 = 3:19:17:57.66
sysLocation.0 = snmplocation
sysContact.0 = who@where
sysName.0 = WF2-N5k-St2

DEBUG: SNMP Auth options =  -v2c -c <hidden>
/usr/bin/snmpget -v2c -c <hidden> -Oqv -m SNMPv2-MIB -M
/opt/observium/mibs udp:wf2-n5k-st2:161 sysDescr.0
Cisco NX-OS(tm) n5000, Software (n5000-uk9), Version 5.0(3)N2(1),
RELEASE SOFTWARE Copyright (c) 2002-2011 by Cisco Systems, Inc.
Device Manager Version 5.2(1),  Compiled 6/13/2011 6:00:00

DEBUG: SNMP Auth options =  -v2c -c <hidden>
/usr/bin/snmpget -v2c -c <hidden> -Oqvn -m SNMPv2-MIB -M
/opt/observium/mibs udp:wf2-n5k-st2:161 sysObjectID.0
.1.3.6.1.4.1.9.12.3.1.3.1084

DEBUG: SNMP Auth options =  -v2c -c <hidden>
/usr/bin/snmpget -v2c -c <hidden> -Oqv -m HOST-RESOURCES-MIB -M
/opt/observium/mibs udp:wf2-n5k-st2:161 hrSystemUptime.0
No Such Object available on this agent at this OID

DEBUG: SNMP Auth options =  -v2c -c <hidden>
/usr/bin/snmpget -v2c -c <hidden> -OUqv -m SNMP-FRAMEWORK-MIB -M
/opt/observium/mibs udp:wf2-n5k-st2:161 snmpEngineTime.0
328677

Using SNMP Agent sysUpTime (328677 seconds)
[RRD Disabled]RRD[update /opt/observium/rrd/wf2-n5k-st2/uptime.rrd
N:328677] Uptime: 3 days, 19h 17m 57s
Polled in 0.153 seconds
Array
(
    [uptime] => 328677
    [last_polled] => Array
        (
            [0] => NOW()
        )

    [last_polled_timetaken] => 0.153
)
Updating wf2-n5k-st2 - 1

SQL[UPDATE `devices` set `uptime` ='328677',`last_polled`
=NOW(),`last_polled_timetaken` ='0.153' WHERE `device_id` = '41']
UPDATED!

SQL[INSERT INTO `perf_times`
(`type`,`doing`,`start`,`duration`,`devices`)  VALUES
('poll','wf2-n5k-st2','1364890842.5634','0.157','1')] ./poller.php
wf2-n5k-st2 April 2, 2013, 10:20 - 1 devices polled in 0.157 secs

MySQL: Cell[0/0s] Row[1/0s] Rows[0/0s] Column[0/0s] Update[1/0s]
Insert[1/0s] Delete[0/0s]
and here is sh ver:
WF2-N5k-St2# sh version
Cisco Nexus Operating System (NX-OS) Software
TAC support: http://www.cisco.com/tac
Copyright (c) 2002-2011, Cisco Systems, Inc. All rights reserved.
The copyrights to certain works contained herein are owned by
other third parties and are used and distributed under license.
Some parts of this software are covered under the GNU Public
License. A copy of the license is available at
http://www.gnu.org/licenses/gpl.html.

Software
  BIOS:      version 3.5.0
  loader:    version N/A
  kickstart: version 5.0(3)N2(1)
  system:    version 5.0(3)N2(1)
  power-seq: Module 1: version v1.0
             Module 3: version v2.0
  uC:        version v1.2.0.1
  SFP uC:    Module 1: v1.0.0.0
  BIOS compile time:       02/03/2011
  kickstart image file is: bootflash:/n5000-uk9-kickstart.5.0.3.N2.1.bin
  kickstart compile time:  6/13/2011 6:00:00 [06/13/2011 13:43:33]
  system image file is:    bootflash:/n5000-uk9.5.0.3.N2.1.bin
  system compile time:     6/13/2011 6:00:00 [06/13/2011 15:33:42]


Hardware
  cisco Nexus5548 Chassis ("O2 32X10GE/Modular Universal Platform
Supervisor")
  Intel(R) Xeon(R) CPU         with 8299528 kB of memory.
  Processor Board ID JAF1522ANPN

  Device name: WF2-N5k-St2
  bootflash:    1908736 kB

Kernel uptime is 619 day(s), 16 hour(s), 58 minute(s), 43 second(s)

Last reset at 471009 usecs after  Fri Jul 22 15:09:54 2011

  Reason: Powered-down due to fan policy trigger
  System version: 5.0(3)N2(1)
  Service:

plugin
  Core Plugin, Ethernet Plugin
WF2-N5k-St2#
Il 01/04/2013 12.41, Mike Stupalov ha scritto:
On 03/31/2013 03:23 PM, Stefano Lobrano wrote:
Hello Adam, thanks for your reply. Here are last 48 hrs snmp and uptime graphs.
Best, Stefano
Please show your out for: php ./poller.php -r -d -m system -h <your_nexus_device>
and from device console: sh ver
Also found that information. Not sure that is your problem, but look at: http://www.cisco.com/en/US/ts/fn/635/fn63560.html
Il 30/03/2013 07.46, Adam Armstrong ha scritto:
It comes from SNMP. What does the uptime graph show?
Stefano Lobrano stefano.lobrano@staff.aruba.it wrote:
Hello List, I'm testing observium to monitor network devices in our datacenter, I've added a range of different devices and it seems all good, but today it has given me a false notice about a couple of nexus 5000 that are reported as "rebooted" while the switches are correctly reporting uptime of more than 600 days... All the other hosts are reported without errors, apparently.
I've looked in the mailing list archive and I found similar issues, with server, but I understand that was something resolved.
Where does observium takes the info about reboot?
Observium is installed in a VM: Observium 0.13.3.3824 Apache 2.2.22 (Ubuntu) PHP 5.3.10-1ubuntu3.6 MySQL 5.5.29-0ubuntu0.12.04.2 RRDtool 1.4.7
Thanks, Stefano _______________________________________________ observium mailing list observium@observium.org http://postman.memetic.org/cgi-bin/mailman/listinfo/observium
observium mailing list observium@observium.org http://postman.memetic.org/cgi-bin/mailman/listinfo/observium
This body part will be downloaded on demand.
observium mailing list observium@observium.org http://postman.memetic.org/cgi-bin/mailman/listinfo/observium
observium mailing list observium@observium.org http://postman.memetic.org/cgi-bin/mailman/listinfo/observium

Are there any other statistics that happen to get reset at device reboot? Maybe a secondary check could verify a system reboot? Just throwing a general idea out there..
Morgan
On Tue, Apr 2, 2013 at 2:40 AM, Stefano Lobrano < stefano.lobrano@staff.aruba.it> wrote:
Mike, thanks a lot for clarification, this solves the issue. I'm aware NXOS version is old, upgrade is planned.
I'l keep experimenting with Observium.
Thanks again, Stefano
Il 02/04/2013 11.28, Mike Stupalov ha scritto:
On 04/02/2013 12:32 PM, Stefano Lobrano wrote:
Hello Mike, thanks for the FN, should not be that case, since it is a different OS versin, and the device has not actually rebooted.
Ok. Observium shows what gives your device over snmp. I see that 64bit counter (snmpEngineTime) equal to 32bit counter (sysUpTime). Therefore, the only suggestion that this is a mistake of your version NX-OS.
This is very similar to bug: CSCtx96459http://tools.cisco.com/Support/BugToolKit/search/getBugDetails.do?method=fet...
I suggest to upgrade your NX-OS (minimum to 5.2(1)N1(1)) or contact Cisco support (but most likely they will be offered the same).
Here is the output you required:
/opt/observium# php ./poller.php -r -d -m system -h wf2-n5k-st2 Observium Poller v0.13.3.3824 DEBUG! Starting polling run: SQL[SELECT `device_id` FROM `devices` WHERE `disabled` = 0 AND `hostname` LIKE 'wf2-n5k-st2' ORDER BY `device_id` ASC] SQL[SELECT * FROM `devices` WHERE `device_id` = '41'] SQL[SELECT * FROM devices_attribs WHERE `device_id` = '41'] wf2-n5k-st2 41 nxos (cisco) DEBUG: SNMP Auth options = -v2c -c <hidden> /usr/bin/snmpget -v2c -c <hidden> -Oqv -m SNMPv2-MIB -M /opt/observium/mibs udp:wf2-n5k-st2:161 sysObjectID.0 SNMPv2-SMI::enterprises.9.12.3.1.3.1084 [RRD Disabled]RRD[update /opt/observium/rrd/wf2-n5k-st2/status.rrd N:1] [RRD Disabled]RRD[update /opt/observium/rrd/wf2-n5k-st2/ping.rrd N:8.82] [RRD Disabled]RRD[update /opt/observium/rrd/wf2-n5k-st2/ping_snmp.rrd N:20.03] DEBUG: SNMP Auth options = -v2c -c <hidden> /usr/bin/snmpget -v2c -c <hidden> -OQUs -m SNMPv2-MIB -M /opt/observium/mibs udp:wf2-n5k-st2:161 sysUpTime.0 sysLocation.0 sysContact.0 sysName.0 sysUpTime.0 = 3:19:17:57.66 sysLocation.0 = snmplocation sysContact.0 = who@where sysName.0 = WF2-N5k-St2 DEBUG: SNMP Auth options = -v2c -c <hidden> /usr/bin/snmpget -v2c -c <hidden> -Oqv -m SNMPv2-MIB -M /opt/observium/mibs udp:wf2-n5k-st2:161 sysDescr.0 Cisco NX-OS(tm) n5000, Software (n5000-uk9), Version 5.0(3)N2(1), RELEASE SOFTWARE Copyright (c) 2002-2011 by Cisco Systems, Inc. Device Manager Version 5.2(1), Compiled 6/13/2011 6:00:00 DEBUG: SNMP Auth options = -v2c -c <hidden> /usr/bin/snmpget -v2c -c <hidden> -Oqvn -m SNMPv2-MIB -M /opt/observium/mibs udp:wf2-n5k-st2:161 sysObjectID.0 .1.3.6.1.4.1.9.12.3.1.3.1084 DEBUG: SNMP Auth options = -v2c -c <hidden> /usr/bin/snmpget -v2c -c <hidden> -Oqv -m HOST-RESOURCES-MIB -M /opt/observium/mibs udp:wf2-n5k-st2:161 hrSystemUptime.0 No Such Object available on this agent at this OID DEBUG: SNMP Auth options = -v2c -c <hidden> /usr/bin/snmpget -v2c -c <hidden> -OUqv -m SNMP-FRAMEWORK-MIB -M /opt/observium/mibs udp:wf2-n5k-st2:161 snmpEngineTime.0 328677 Using SNMP Agent sysUpTime (328677 seconds) [RRD Disabled]RRD[update /opt/observium/rrd/wf2-n5k-st2/uptime.rrd N:328677] Uptime: 3 days, 19h 17m 57s Polled in 0.153 seconds Array ( [uptime] => 328677 [last_polled] => Array ( [0] => NOW() ) [last_polled_timetaken] => 0.153 ) Updating wf2-n5k-st2 - 1 SQL[UPDATE `devices` set `uptime` ='328677',`last_polled` =NOW(),`last_polled_timetaken` ='0.153' WHERE `device_id` = '41'] UPDATED! SQL[INSERT INTO `perf_times` (`type`,`doing`,`start`,`duration`,`devices`) VALUES ('poll','wf2-n5k-st2','1364890842.5634','0.157','1')] ./poller.php wf2-n5k-st2 April 2, 2013, 10:20 - 1 devices polled in 0.157 secs MySQL: Cell[0/0s] Row[1/0s] Rows[0/0s] Column[0/0s] Update[1/0s] Insert[1/0s] Delete[0/0s]and here is sh ver:
WF2-N5k-St2# sh version Cisco Nexus Operating System (NX-OS) Software TAC support: http://www.cisco.com/tac Copyright (c) 2002-2011, Cisco Systems, Inc. All rights reserved. The copyrights to certain works contained herein are owned by other third parties and are used and distributed under license. Some parts of this software are covered under the GNU Public License. A copy of the license is available at http://www.gnu.org/licenses/gpl.html. Software BIOS: version 3.5.0 loader: version N/A kickstart: version 5.0(3)N2(1) system: version 5.0(3)N2(1) power-seq: Module 1: version v1.0 Module 3: version v2.0 uC: version v1.2.0.1 SFP uC: Module 1: v1.0.0.0 BIOS compile time: 02/03/2011 kickstart image file is: bootflash:/n5000-uk9-kickstart.5.0.3.N2.1.bin kickstart compile time: 6/13/2011 6:00:00 [06/13/2011 13:43:33] system image file is: bootflash:/n5000-uk9.5.0.3.N2.1.bin system compile time: 6/13/2011 6:00:00 [06/13/2011 15:33:42] Hardware cisco Nexus5548 Chassis ("O2 32X10GE/Modular Universal Platform Supervisor") Intel(R) Xeon(R) CPU with 8299528 kB of memory. Processor Board ID JAF1522ANPN Device name: WF2-N5k-St2 bootflash: 1908736 kB Kernel uptime is 619 day(s), 16 hour(s), 58 minute(s), 43 second(s) Last reset at 471009 usecs after Fri Jul 22 15:09:54 2011 Reason: Powered-down due to fan policy trigger System version: 5.0(3)N2(1) Service: plugin Core Plugin, Ethernet Plugin WF2-N5k-St2#Il 01/04/2013 12.41, Mike Stupalov ha scritto:
On 03/31/2013 03:23 PM, Stefano Lobrano wrote:
Hello Adam, thanks for your reply. Here are last 48 hrs snmp and uptime graphs.
Best, Stefano
Please show your out for: php ./poller.php -r -d -m system -h <your_nexus_device>
and from device console: sh ver
Also found that information. Not sure that is your problem, but look at:http://www.cisco.com/en/US/ts/fn/635/fn63560.html
Il 30/03/2013 07.46, Adam Armstrong ha scritto:
It comes from SNMP. What does the uptime graph show?
Stefano Lobrano stefano.lobrano@staff.aruba.it stefano.lobrano@staff.aruba.it wrote:
Hello List, I'm testing observium to monitor network devices in our datacenter, I've added a range of different devices and it seems all good, but today it has given me a false notice about a couple of nexus 5000 that are reported as "rebooted" while the switches are correctly reporting uptime of more than 600 days... All the other hosts are reported without errors, apparently.
I've looked in the mailing list archive and I found similar issues, with server, but I understand that was something resolved.
Where does observium takes the info about reboot?
Observium is installed in a VM: Observium 0.13.3.3824 Apache 2.2.22 (Ubuntu) PHP 5.3.10-1ubuntu3.6 MySQL 5.5.29-0ubuntu0.12.04.2 RRDtool 1.4.7
Thanks, Stefano _______________________________________________ observium mailing listobservium@observium.orghttp://postman.memetic.org/cgi-bin/mailman/listinfo/observium
observium mailing listobservium@observium.orghttp://postman.memetic.org/cgi-bin/mailman/listinfo/observium
This body part will be downloaded on demand.
observium mailing listobservium@observium.orghttp://postman.memetic.org/cgi-bin/mailman/listinfo/observium
observium mailing listobservium@observium.orghttp://postman.memetic.org/cgi-bin/mailman/listinfo/observium
observium mailing list observium@observium.org http://postman.memetic.org/cgi-bin/mailman/listinfo/observium
participants (4)
-
 Adam Armstrong
 -
 Mike Stupalov
 -
 Morgan McLean
 -
 Stefano Lobrano