Ports down, but not shown?

Hi all,
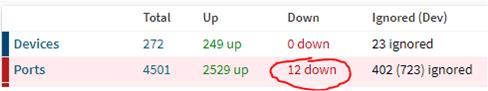
I've got 12 ports showing as 'Down', both on the main page here...
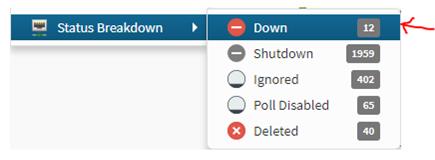
...and on the menu:
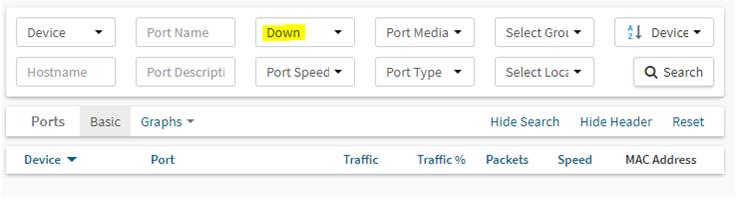
However, when you click the link, you don't get any results: (the link goes to: https://observius.cdc.local/ports/state=down/ignore=0/ )
So... How can I find out what/where/how these 12 ports are, so I can 'resolve' them please?
Cheers!
Robert Williams Custodian Data Centres https://www.CustodianDC.com

Hi,
Seems fine on our install/setup?
Have you tried using the debug in the url and see what the SQL querys show?
Do you have the Cache switched on? As it can take up to 2mins for the cache to clear and show pages correctly
https://observius.cdc.local/ports/state=down/ignore=0/debug https://observius.cdc.local/ports/state=down/ignore=0/debug
Regards
Simon
On 4 Sep 2017, at 15:14, Robert Williams Robert@CustodianDC.com wrote:
Hi all,
I’ve got 12 ports showing as ‘Down’, both on the main page here…
<Picture (Device Independent Bitmap) 1.jpg>
…and on the menu:
<Picture (Device Independent Bitmap) 2.jpg>
However, when you click the link, you don’t get any results: (the link goes to: https://observius.cdc.local/ports/state=down/ignore=0/ https://observius.cdc.local/ports/state=down/ignore=0/ )
<Picture (Device Independent Bitmap) 3.jpg>
So… How can I find out what/where/how these 12 ports are, so I can ‘resolve’ them please?
Cheers!
Robert Williams Custodian Data Centres https://www.CustodianDC.com https://www.custodiandc.com/
observium mailing list observium@observium.org mailto:observium@observium.org http://postman.memetic.org/cgi-bin/mailman/listinfo/observium http://postman.memetic.org/cgi-bin/mailman/listinfo/observium

Jesus these god damn status numbers.
They're probably on deleted/ignored/disabled devices. These will not be shown on the page, but will appear on global stats because the queries generating these things are not identical.
Adam.
Sent from BlueMail
On 4 Sep 2017, 16:14, at 16:14, Robert Williams Robert@CustodianDC.com wrote:
Hi all,
I've got 12 ports showing as 'Down', both on the main page here...
...and on the menu:
However, when you click the link, you don't get any results: (the link goes to: https://observius.cdc.local/ports/state=down/ignore=0/ )
So... How can I find out what/where/how these 12 ports are, so I can 'resolve' them please?
Cheers!
Robert Williams Custodian Data Centres https://www.CustodianDC.com
observium mailing list observium@observium.org http://postman.memetic.org/cgi-bin/mailman/listinfo/observium
Hi – they are indeed a pain, although it’s a victim of its own success – the problem is that it’s such a brilliantly useful “Summary” feature that I hate having the engineers just ignore it in case they miss a real event.
Unfortunately with quite a few ignored / disabled devices I’m unable to spot which one is causing it. I’ve tried clearing a few and enabling/disabling some to try to get them to show in the results but no luck so far.
Is it possible to get the query which produces the numerical counter total? With this, I can run it separately and resolve it whenever it happens. I tried the /debug for the page but the output of the homepage is so extensive I’ve got no hope of spotting the specific line :(
Cheers,
Robert Williams Custodian Data Centres https://www.CustodianDC.com From: observium [mailto:observium-bounces@observium.org] On Behalf Of Adam Armstrong Sent: 04 September 2017 16:07 To: Observium observium@observium.org Cc: Observium observium@observium.org Subject: Re: [Observium] Ports down, but not shown?
WARNING: This email may contain attachments that have bypassed our filters. Please be cautious. If in doubt, speak to the NOC first. You can ignore this warning if there aren't any visible attachments.
________________________________
Jesus these god damn status numbers. They're probably on deleted/ignored/disabled devices. These will not be shown on the page, but will appear on global stats because the queries generating these things are not identical. Adam. Sent from BlueMailhttp://www.bluemail.me/r?b=10455 On 4 Sep 2017, at 16:14, Robert Williams <Robert@CustodianDC.commailto:Robert@CustodianDC.com> wrote: Hi all,
I’ve got 12 ports showing as ‘Down’, both on the main page here…
[cid:7C69CD60E80BB549B60E20B0C6109CC5@cdc.local]
…and on the menu:
[cid:EC69AD4E71BFBB4BAD1BA0B3C2281E19@cdc.local]
However, when you click the link, you don’t get any results: (the link goes to: https://observius.cdc.local/ports/state=down/ignore=0/ )
[cid:BF7D31E8D7A25D448C5A1E49654FDE42@cdc.local]
So… How can I find out what/where/how these 12 ports are, so I can ‘resolve’ them please?
Cheers!
Robert Williams Custodian Data Centres https://www.CustodianDC.com
________________________________
observium mailing list observium@observium.org http://postman.memetic.org/cgi-bin/mailman/listinfo/observium

See, it's even more complex than that. It's actually a query which pulls the whole table and then does a bunch of if() checks to decide which category each port belongs to.
That's why we can't easily reconcile it with the queries.
Let me see if I can do something...
adam. On 2017-09-04 21:01:03, Robert Williams robert@custodiandc.com wrote: Hi – they are indeed a pain, although it’s a victim of its own success – the problem is that it’s such a brilliantly useful “Summary” feature that I hate having the engineers just ignore it in case they miss a real event. Unfortunately with quite a few ignored / disabled devices I’m unable to spot which one is causing it. I’ve tried clearing a few and enabling/disabling some to try to get them to show in the results but no luck so far. Is it possible to get the query which produces the numerical counter total? With this, I can run it separately and resolve it whenever it happens. I tried the /debug for the page but the output of the homepage is so extensive I’ve got no hope of spotting the specific line :( Cheers, Robert Williams Custodian Data Centres https://www.CustodianDC.com From: observium [mailto:observium-bounces@observium.org] On Behalf Of Adam Armstrong Sent: 04 September 2017 16:07 To: Observium observium@observium.org Cc: Observium observium@observium.org Subject: Re: [Observium] Ports down, but not shown? WARNING: This email may contain attachments that have bypassed our filters. Please be cautious. If in doubt, speak to the NOC first. You can ignore this warning if there aren't any visible attachments. Jesus these god damn status numbers. They're probably on deleted/ignored/disabled devices. These will not be shown on the page, but will appear on global stats because the queries generating these things are not identical. Adam. Sent from BlueMail [http://www.bluemail.me/r?b=10455] On 4 Sep 2017, at 16:14, Robert Williams <Robert@CustodianDC.com [mailto:Robert@CustodianDC.com]> wrote: Hi all, I’ve got 12 ports showing as ‘Down’, both on the main page here… …and on the menu: However, when you click the link, you don’t get any results: (the link goes to: https://observius.cdc.local/ports/state=down/ignore=0/ [https://observius.cdc.local/ports/state=down/ignore=0/] ) So… How can I find out what/where/how these 12 ports are, so I can ‘resolve’ them please? Cheers! Robert Williams Custodian Data Centres https://www.CustodianDC.com [https://www.CustodianDC.com]
observium mailing list observium@observium.org http://postman.memetic.org/cgi-bin/mailman/listinfo/observium [http://postman.memetic.org/cgi-bin/mailman/listinfo/observium]
Oh, it's not. Now it's actually queries!
Having a look at this, it seems that the discontinuity for down/ignored/up/shutdown is solved with :
./housekeeping.php -b
I seem to still have had some ports for devices I had deleted. You probably do too! One of the queries joins the devices table, which cuts out the ports which don't have a device!
adam. On 2017-09-04 21:03:22, Adam Armstrong adama@observium.org wrote: See, it's even more complex than that. It's actually a query which pulls the whole table and then does a bunch of if() checks to decide which category each port belongs to.
That's why we can't easily reconcile it with the queries.
Let me see if I can do something...
adam. On 2017-09-04 21:01:03, Robert Williams robert@custodiandc.com wrote: Hi – they are indeed a pain, although it’s a victim of its own success – the problem is that it’s such a brilliantly useful “Summary” feature that I hate having the engineers just ignore it in case they miss a real event. Unfortunately with quite a few ignored / disabled devices I’m unable to spot which one is causing it. I’ve tried clearing a few and enabling/disabling some to try to get them to show in the results but no luck so far. Is it possible to get the query which produces the numerical counter total? With this, I can run it separately and resolve it whenever it happens. I tried the /debug for the page but the output of the homepage is so extensive I’ve got no hope of spotting the specific line :( Cheers, Robert Williams Custodian Data Centres https://www.CustodianDC.com From: observium [mailto:observium-bounces@observium.org] On Behalf Of Adam Armstrong Sent: 04 September 2017 16:07 To: Observium observium@observium.org Cc: Observium observium@observium.org Subject: Re: [Observium] Ports down, but not shown? WARNING: This email may contain attachments that have bypassed our filters. Please be cautious. If in doubt, speak to the NOC first. You can ignore this warning if there aren't any visible attachments. Jesus these god damn status numbers. They're probably on deleted/ignored/disabled devices. These will not be shown on the page, but will appear on global stats because the queries generating these things are not identical. Adam. Sent from BlueMail [http://www.bluemail.me/r?b=10455] On 4 Sep 2017, at 16:14, Robert Williams <Robert@CustodianDC.com [mailto:Robert@CustodianDC.com]> wrote: Hi all, I’ve got 12 ports showing as ‘Down’, both on the main page here… …and on the menu: However, when you click the link, you don’t get any results: (the link goes to: https://observius.cdc.local/ports/state=down/ignore=0/ [https://observius.cdc.local/ports/state=down/ignore=0/] ) So… How can I find out what/where/how these 12 ports are, so I can ‘resolve’ them please? Cheers! Robert Williams Custodian Data Centres https://www.CustodianDC.com [https://www.CustodianDC.com]
observium mailing list observium@observium.org http://postman.memetic.org/cgi-bin/mailman/listinfo/observium [http://postman.memetic.org/cgi-bin/mailman/listinfo/observium]
Oh, there was also an issue where the cached counts were excluding ports with "ignore" set, and the ports page doesn't as default. I've added /ignore=0/ onto the links on the status page to make these counts match.
I think all of the counts should match there now!
adam. On 2017-09-04 21:30:37, Adam Armstrong adama@observium.org wrote: Oh, it's not. Now it's actually queries!
Having a look at this, it seems that the discontinuity for down/ignored/up/shutdown is solved with :
./housekeeping.php -b
I seem to still have had some ports for devices I had deleted. You probably do too! One of the queries joins the devices table, which cuts out the ports which don't have a device!
adam. On 2017-09-04 21:03:22, Adam Armstrong adama@observium.org wrote: See, it's even more complex than that. It's actually a query which pulls the whole table and then does a bunch of if() checks to decide which category each port belongs to.
That's why we can't easily reconcile it with the queries.
Let me see if I can do something...
adam. On 2017-09-04 21:01:03, Robert Williams robert@custodiandc.com wrote: Hi – they are indeed a pain, although it’s a victim of its own success – the problem is that it’s such a brilliantly useful “Summary” feature that I hate having the engineers just ignore it in case they miss a real event. Unfortunately with quite a few ignored / disabled devices I’m unable to spot which one is causing it. I’ve tried clearing a few and enabling/disabling some to try to get them to show in the results but no luck so far. Is it possible to get the query which produces the numerical counter total? With this, I can run it separately and resolve it whenever it happens. I tried the /debug for the page but the output of the homepage is so extensive I’ve got no hope of spotting the specific line :( Cheers, Robert Williams Custodian Data Centres https://www.CustodianDC.com From: observium [mailto:observium-bounces@observium.org] On Behalf Of Adam Armstrong Sent: 04 September 2017 16:07 To: Observium observium@observium.org Cc: Observium observium@observium.org Subject: Re: [Observium] Ports down, but not shown? WARNING: This email may contain attachments that have bypassed our filters. Please be cautious. If in doubt, speak to the NOC first. You can ignore this warning if there aren't any visible attachments. Jesus these god damn status numbers. They're probably on deleted/ignored/disabled devices. These will not be shown on the page, but will appear on global stats because the queries generating these things are not identical. Adam. Sent from BlueMail [http://www.bluemail.me/r?b=10455] On 4 Sep 2017, at 16:14, Robert Williams <Robert@CustodianDC.com [mailto:Robert@CustodianDC.com]> wrote: Hi all, I’ve got 12 ports showing as ‘Down’, both on the main page here… …and on the menu: However, when you click the link, you don’t get any results: (the link goes to: https://observius.cdc.local/ports/state=down/ignore=0/ [https://observius.cdc.local/ports/state=down/ignore=0/] ) So… How can I find out what/where/how these 12 ports are, so I can ‘resolve’ them please? Cheers! Robert Williams Custodian Data Centres https://www.CustodianDC.com [https://www.CustodianDC.com]
observium mailing list observium@observium.org http://postman.memetic.org/cgi-bin/mailman/listinfo/observium [http://postman.memetic.org/cgi-bin/mailman/listinfo/observium]
Hi Adam,
Thanks very much for that – I’ve come in this morning and everything now matches (the rogue counts have gone away). We have a housekeeping event scheduled as well as svn up, so I can’t confirm which one sorted it but I’m not sure it actually matters :)
Thanks again!
Robert Williams Custodian Data Centres https://www.CustodianDC.com From: observium [mailto:observium-bounces@observium.org] On Behalf Of Adam Armstrong Sent: 04 September 2017 20:53 To: observium@observium.org Subject: Re: [Observium] Ports down, but not shown?
Oh, there was also an issue where the cached counts were excluding ports with "ignore" set, and the ports page doesn't as default. I've added /ignore=0/ onto the links on the status page to make these counts match.
I think all of the counts should match there now!
adam.
Hi – they are indeed a pain, although it’s a victim of its own success – the problem is that it’s such a brilliantly useful “Summary” feature that I hate having the engineers just ignore it in case they miss a real event.
Unfortunately with quite a few ignored / disabled devices I’m unable to spot which one is causing it. I’ve tried clearing a few and enabling/disabling some to try to get them to show in the results but no luck so far.
Is it possible to get the query which produces the numerical counter total? With this, I can run it separately and resolve it whenever it happens. I tried the /debug for the page but the output of the homepage is so extensive I’ve got no hope of spotting the specific line :(
Cheers,
Robert Williams Custodian Data Centres https://www.CustodianDC.com From: observium [mailto:observium-bounces@observium.org] On Behalf Of Adam Armstrong Sent: 04 September 2017 16:07 To: Observium observium@observium.org Cc: Observium observium@observium.org Subject: Re: [Observium] Ports down, but not shown?
WARNING: This email may contain attachments that have bypassed our filters. Please be cautious. If in doubt, speak to the NOC first. You can ignore this warning if there aren't any visible attachments.
________________________________
Jesus these god damn status numbers. They're probably on deleted/ignored/disabled devices. These will not be shown on the page, but will appear on global stats because the queries generating these things are not identical. Adam. Sent from BlueMailhttp://www.bluemail.me/r?b=10455 On 4 Sep 2017, at 16:14, Robert Williams <Robert@CustodianDC.commailto:Robert@CustodianDC.com> wrote: Hi all,
I’ve got 12 ports showing as ‘Down’, both on the main page here…
[cid:7C69CD60E80BB549B60E20B0C6109CC5@cdc.local]
…and on the menu:
[cid:EC69AD4E71BFBB4BAD1BA0B3C2281E19@cdc.local]
However, when you click the link, you don’t get any results: (the link goes to: https://observius.cdc.local/ports/state=down/ignore=0/ )
[cid:BF7D31E8D7A25D448C5A1E49654FDE42@cdc.local]
So… How can I find out what/where/how these 12 ports are, so I can ‘resolve’ them please?
Cheers!
Robert Williams Custodian Data Centres https://www.CustodianDC.com
________________________________
observium mailing list observium@observium.org http://postman.memetic.org/cgi-bin/mailman/listinfo/observium
Didn't we fix this all last week? :P
Adam.
Sent from BlueMail
On 11 Sep 2017, 17:00, at 17:00, Robert Williams Robert@CustodianDC.com wrote:
Hi – they are indeed a pain, although it’s a victim of its own success – the problem is that it’s such a brilliantly useful “Summary” feature that I hate having the engineers just ignore it in case they miss a real event.
Unfortunately with quite a few ignored / disabled devices I’m unable to spot which one is causing it. I’ve tried clearing a few and enabling/disabling some to try to get them to show in the results but no luck so far.
Is it possible to get the query which produces the numerical counter total? With this, I can run it separately and resolve it whenever it happens. I tried the /debug for the page but the output of the homepage is so extensive I’ve got no hope of spotting the specific line :(
Cheers,
Robert Williams Custodian Data Centres https://www.CustodianDC.com From: observium [mailto:observium-bounces@observium.org] On Behalf Of Adam Armstrong Sent: 04 September 2017 16:07 To: Observium observium@observium.org Cc: Observium observium@observium.org Subject: Re: [Observium] Ports down, but not shown?
WARNING: This email may contain attachments that have bypassed our filters. Please be cautious. If in doubt, speak to the NOC first. You can ignore this warning if there aren't any visible attachments.
Jesus these god damn status numbers. They're probably on deleted/ignored/disabled devices. These will not be shown on the page, but will appear on global stats because the queries generating these things are not identical. Adam. Sent from BlueMailhttp://www.bluemail.me/r?b=10455 On 4 Sep 2017, at 16:14, Robert Williams <Robert@CustodianDC.commailto:Robert@CustodianDC.com> wrote: Hi all,
I’ve got 12 ports showing as ‘Down’, both on the main page here…
[cid:7C69CD60E80BB549B60E20B0C6109CC5@cdc.local]
…and on the menu:
[cid:EC69AD4E71BFBB4BAD1BA0B3C2281E19@cdc.local]
However, when you click the link, you don’t get any results: (the link goes to: https://observius.cdc.local/ports/state=down/ignore=0/ )
[cid:BF7D31E8D7A25D448C5A1E49654FDE42@cdc.local]
So… How can I find out what/where/how these 12 ports are, so I can ‘resolve’ them please?
Cheers!
Robert Williams Custodian Data Centres https://www.CustodianDC.com
observium mailing list observium@observium.org http://postman.memetic.org/cgi-bin/mailman/listinfo/observium
observium mailing list observium@observium.org http://postman.memetic.org/cgi-bin/mailman/listinfo/observium
participants (4)
-
 Adam Armstrong
 -
 Adam Armstrong
 -
 Robert Williams
 -
 Simon Mousey Smith