
Hi all, Feel free to tell me to get stuffed, but I couldn't find an answer anywhere in google or on the mailing list so thought it worth asking.. As a (very) keen user of HAProxy, is it on the roadmap to be an application Observium can monitor? The stats are quite easily gained through something like HAProxyctl or socat interface. Keepalived would be nice too, and has snmp functionality.
:)
Thanks Andy

Should be pretty easy to implement atleast. Could you provide example output from HAProxyctl and point out what values you are interested to graph? /Markus
Den 20 feb. 2018 18:38 skrev "Franks Andy (IT Technical Architecture Manager)" Andy.Franks@sath.nhs.uk:
Hi all,
Feel free to tell me to get stuffed, but I couldn’t find an answer anywhere in google or on the mailing list so thought it worth asking..
As a (very) keen user of HAProxy, is it on the roadmap to be an application Observium can monitor? The stats are quite easily gained through something like HAProxyctl or socat interface.
Keepalived would be nice too, and has snmp functionality.
J
Thanks
Andy
_______________________________________________ observium mailing list observium@observium.org http://postman.memetic.org/cgi-bin/mailman/listinfo/observium
Thanks for the reply. Ideally observium would work out what front and backends have been specified from the output of HAProxyctl and provide stats for those. There are general stats though, provided for the “engine” of HAProxy with, e.g.
haproxyctl show info
Name: HAProxy Version: 1.8.2-1ppa1~xenial Release_date: 2017/12/26 Nbproc: 1 Process_num: 1 Pid: 5515 Uptime: 6d 23h24m08s Uptime_sec: 602648 Memmax_MB: 0 PoolAlloc_MB: 0 PoolUsed_MB: 0 PoolFailed: 0 Ulimit-n: 4034 Maxsock: 4034 Maxconn: 2000 Hard_maxconn: 2000 CurrConns: 8 CumConns: 207821 CumReq: 371215 MaxSslConns: 0 CurrSslConns: 16 CumSslConns: 705404 Maxpipes: 0 PipesUsed: 0 PipesFree: 0 ConnRate: 2 ConnRateLimit: 0 MaxConnRate: 31 SessRate: 2 SessRateLimit: 0 MaxSessRate: 31 SslRate: 2 SslRateLimit: 0 MaxSslRate: 31 SslFrontendKeyRate: 2 SslFrontendMaxKeyRate: 19 SslFrontendSessionReuse_pct: 0 SslBackendKeyRate: 0 SslBackendMaxKeyRate: 2 SslCacheLookups: 31451 SslCacheMisses: 28166 CompressBpsIn: 0 CompressBpsOut: 0 CompressBpsRateLim: 0 ZlibMemUsage: 0 MaxZlibMemUsage: 0 Tasks: 26 Run_queue: 0 Idle_pct: 98 node: haproxy-rp1
If it could cope with parsing frontend and backend info, all sorts are available, .e.g
haproxyctl show stat
#pxname,svname,qcur,qmax,scur,smax,slim,stot,bin,bout,dreq,dresp,ereq,econ,eresp,wretr,wredis,status,weight,act,bck,chkfail,chkdown,lastchg,downtime,qlimit,pid,iid,sid,throttle,lbtot,tracked,type,rate,rate_lim,rate_max,check_status,check_code,check_duration,hrsp_1xx,hrsp_2xx,hrsp_3xx,hrsp_4xx,hrsp_5xx,hrsp_other,hanafail,req_rate,req_rate_max,req_tot,cli_abrt,srv_abrt,comp_in,comp_out,comp_byp,comp_rsp,lastsess,last_chk,last_agt,qtime,ctime,rtime,ttime,agent_status,agent_code,agent_duration,check_desc,agent_desc,check_rise,check_fall,check_health,agent_rise,agent_fall,agent_health,addr,cookie,mode,algo,conn_rate,conn_rate_max,conn_tot,intercepted,dcon,dses, connections_acme_challenge_80,BACKEND,0,0,0,0,1,0,0,0,0,0,,0,0,0,0,UP,0,0,0,,0,698129,,,1,2,0,,0,,1,0,,0,,,,0,0,0,0,0,0,,,,0,0,0,0,0,0,0,-1,,,0,0,0,0,,,,,,,,,,,,,,http,roundrobin,,,,,,, connections_deadend_80,BACKEND,0,0,0,0,1,0,0,0,0,0,,0,0,0,0,UP,0,0,0,,0,698129,,,1,3,0,,0,,1,0,,0,,,,0,0,0,0,0,0,,,,0,0,0,0,0,0,0,-1,,,0,0,0,0,,,,,,,,,,,,,,http,roundrobin,,,,,,, connections_mail_443,BACKEND,0,0,0,0,1,0,0,0,0,0,,0,0,0,0,UP,0,0,0,,0,698129,,,1,4,0,,0,,1,0,,0,,,,0,0,0,0,0,0,,,,0,0,0,0,0,0,0,-1,,,0,0,0,0,,,,,,,,,,,,,,http,roundrobin,,,,,,, connections_deadend_443,BACKEND,0,0,0,0,1,0,0,0,0,0,,0,0,0,0,UP,0,0,0,,0,698129,,,1,5,0,,0,,1,0,,0,,,,0,0,0,0,0,0,,,,0,0,0,0,0,0,0,-1,,,0,0,0,0,,,,,,,,,,,,,,http,roundrobin,,,,,,, ft_web_80,FRONTEND,,,0,2,2000,173,23454,21113,0,0,24,,,,,OPEN,,,,,,,,,1,6,0,,,,0,0,0,8,,,,0,0,149,24,0,0,,0,8,173,,,0,0,0,0,,,,,,,,,,,,,,,,,,,,,http,,0,8,173,0,0,0, bk_acme_challenge,prh-haproxy-cp1,0,0,0,0,,0,0,0,,0,,0,0,0,0,no check,1,1,0,,,698129,,,1,7,1,,0,,2,0,,0,,,,0,0,0,0,0,0,,,,,0,0,,,,,-1,,,0,0,0,0,,,,,,,,,,,,127.0.0.1:81,,http,,,,,,,, bk_acme_challenge,BACKEND,0,0,0,0,200,0,0,0,0,0,,0,0,0,0,UP,1,1,0,,0,698129,0,,1,7,0,,0,,1,0,,0,,,,0,0,0,0,0,0,,,,0,0,0,0,0,0,0,-1,,,0,0,0,0,,,,,,,,,,,,,,http,roundrobin,,,,,,, bk_deadend_80,BACKEND,0,0,0,0,200,0,0,0,0,0,,0,0,0,0,UP,0,0,0,,0,698129,,,1,8,0,,0,,1,0,,0,,,,0,0,0,0,0,0,,,,0,0,0,0,0,0,0,-1,,,0,0,0,0,,,,,,,,,,,,,,http,roundrobin,,,,,,, ft_web_8443,FRONTEND,,,0,12,2000,60,175866,367414,0,0,0,,,,,OPEN,,,,,,,,,1,9,0,,,,0,0,0,8,,,,0,235,32,0,5,0,,0,43,272,,,0,0,0,0,,,,,,,,,,,,,,,,,,,,,http,,0,8,2669,0,0,0, ft_web_443,FRONTEND,,,13,44,2000,241103,675133100,4430775375,0,0,1954,,,,,OPEN,,,,,,,,,1,10,0,,,,0,1,0,20,,,,0,173390,703,50297,72513,16757,,1,40,313670,,,0,0,0,0,,,,,,,,,,,,,,,,,,,,,http,,2,53,243062,0,0,0, bk_mail_443,mail,0,0,10,39,,311220,674980983,4430694083,,0,,0,72138,0,0,UP,1,1,0,0,0,698129,0,,1,11,1,,1440,,2,1,,43,L6OK,,1,0,173626,32,48351,311,0,,,,,20419,11120,,,,,1,,,0,1,1847,5663,,,,Layer6 check passed,,10,20,29,,,,10.51.0.140:443,1,http,,,,,,,, bk_mail_443,BACKEND,0,0,10,39,400,311228,674980983,4430694083,0,0,,0,72138,0,0,UP,1,1,0,,0,698129,0,,1,11,0,,1440,,1,1,,43,,,,0,173625,32,48351,72453,16757,,,,311218,20419,11120,0,0,0,0,1,,,0,1,1847,5663,,,,,,,,,,,,,SERVERID,http,roundrobin,,,,,,, bk_deadend_443,BACKEND,0,0,0,1,400,65,9667,13845,0,0,,65,0,0,0,UP,0,0,0,,0,698129,,,1,12,0,,0,,1,0,,3,,,,0,0,0,0,65,0,,,,65,0,0,0,0,0,0,-1,,,0,0,0,0,,,,,,,,,,,,,,http,roundrobin,,,,,,,
etc..
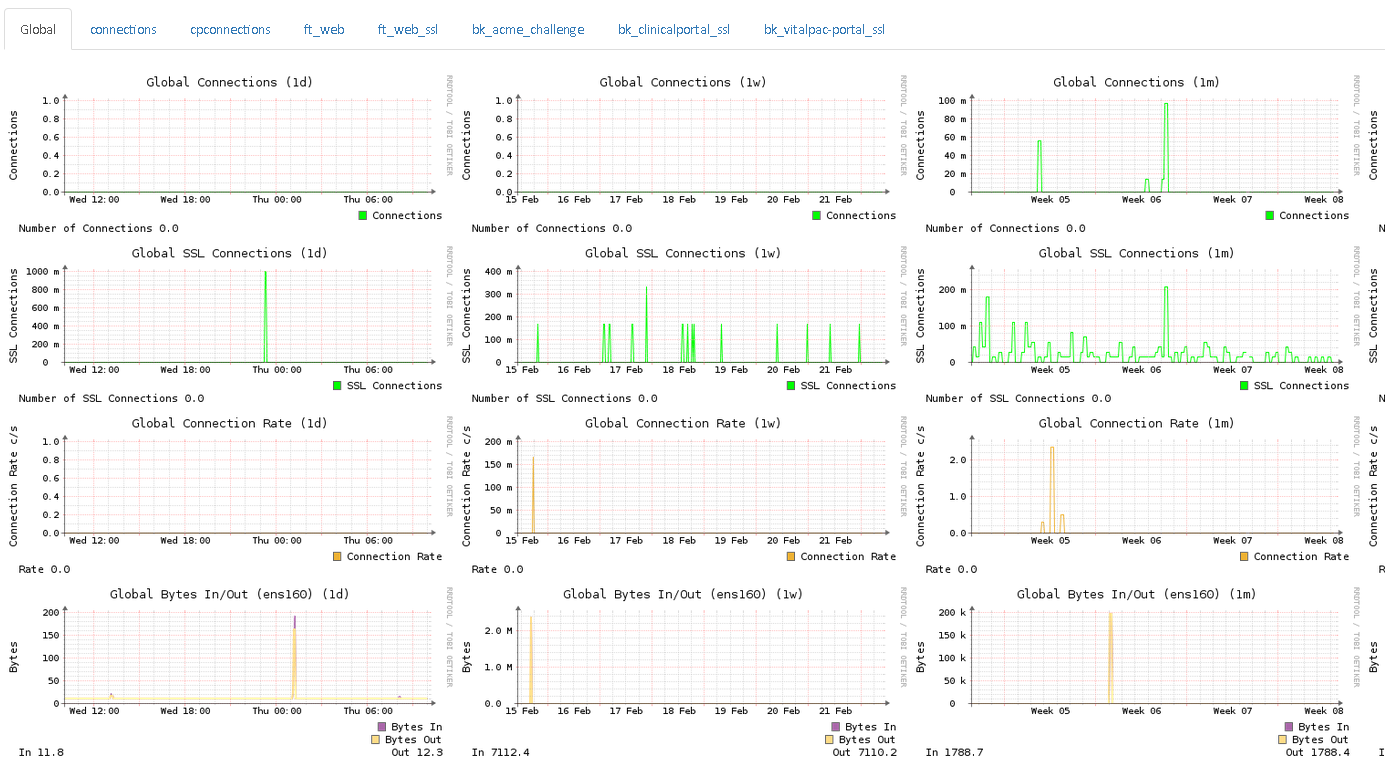
We’ve already implemented drawing of graphs using a custom frontend php / rrdtool and it was pretty straightforward, the only bit is working out what the stats belong to and tying the front and back end stuff together if necessary, but would be great to have this in observium too, and maybe to get alerts when certain stats are too high etc.. [cid:image001.png@01D3ABD1.2F1FE3D0]
Thanks! Andy
From: observium [mailto:observium-bounces@observium.org] On Behalf Of Markus Klock Sent: 20 February 2018 17:56 To: Observium Network Observation System Subject: Re: [Observium] HAProxy stats
Should be pretty easy to implement atleast. Could you provide example output from HAProxyctl and point out what values you are interested to graph? /Markus
Den 20 feb. 2018 18:38 skrev "Franks Andy (IT Technical Architecture Manager)" <Andy.Franks@sath.nhs.ukmailto:Andy.Franks@sath.nhs.uk>: Hi all, Feel free to tell me to get stuffed, but I couldn’t find an answer anywhere in google or on the mailing list so thought it worth asking.. As a (very) keen user of HAProxy, is it on the roadmap to be an application Observium can monitor? The stats are quite easily gained through something like HAProxyctl or socat interface. Keepalived would be nice too, and has snmp functionality.
☺
Thanks Andy
_______________________________________________ observium mailing list observium@observium.orgmailto:observium@observium.org http://postman.memetic.org/cgi-bin/mailman/listinfo/observium
participants (2)
-
 Franks Andy (IT Technical Architecture Manager)
 -
 Markus Klock