Alert checkers triggering on down/0 speed interfaces

Since updating to 10134 we've seen some odd behavior out of our high interface utilization alerts.
The alert itself is very simple, device matches *, entity is ifType equals ethernetCsmacd, and the test conditions are any of:
ifInOctets_perc ge 80 ifOutOctets_perc ge 80
Which has worked fine forever.
Now it's throwing alarms on an odd mix of devices (UBNT, Palo Alto, Arista, Kemp VLM, Infoblox) for ports that are down/down loopbacks or HA interfaces not connected.
All of the ports it is alarming on show this in the data (Speed 0, and down/down):
ifSpeed=>0 ifHighSpeed=>0 ifOperStatus=>down ifAdminStatus=>down
Any idea what changed or why it's alarming on these now? I'm guessing its trying to do the 80% math on....0 but I'd imagine that shouldn't even run if the port is admin+operationally down.
This is a mgmt interface on an arista (which is unconnected and admin down):
As you can see the *_perc calcs are 0, it almost seems some kind of divide by 0 error.
Thanks in advance!
Spencer Ryan | Senior Systems Administrator | spencer.ryan@netscout.commailto:spencer.ryan@netscout.com Arbor Networks | The security division of NETSCOUT +1.734.794.5033 (d) | +1.734.846.2053 (m) www.arbornetworks.comhttp://www.arbornetworks.com/

ifHighSpeed => 0
This seems to be because ifspeed and ifhighspeed are both zero.
You might see why this is in the debugging output.
Adam.
Sent from BlueMail
On 20 Oct 2019, 16:49, at 16:49, "Ryan, Spencer via observium" observium@observium.org wrote:
Since updating to 10134 we've seen some odd behavior out of our high interface utilization alerts.
The alert itself is very simple, device matches *, entity is ifType equals ethernetCsmacd, and the test conditions are any of:
ifInOctets_perc ge 80 ifOutOctets_perc ge 80
Which has worked fine forever.
Now it's throwing alarms on an odd mix of devices (UBNT, Palo Alto, Arista, Kemp VLM, Infoblox) for ports that are down/down loopbacks or HA interfaces not connected.
All of the ports it is alarming on show this in the data (Speed 0, and down/down):
ifSpeed=>0 ifHighSpeed=>0 ifOperStatus=>down ifAdminStatus=>down
Any idea what changed or why it's alarming on these now? I'm guessing its trying to do the 80% math on....0 but I'd imagine that shouldn't even run if the port is admin+operationally down.
This is a mgmt interface on an arista (which is unconnected and admin down):
As you can see the *_perc calcs are 0, it almost seems some kind of divide by 0 error.
Thanks in advance!
Spencer Ryan | Senior Systems Administrator | spencer.ryan@netscout.commailto:spencer.ryan@netscout.com Arbor Networks | The security division of NETSCOUT +1.734.794.5033 (d) | +1.734.846.2053 (m) www.arbornetworks.comhttp://www.arbornetworks.com/
observium mailing list observium@observium.org http://postman.memetic.org/cgi-bin/mailman/listinfo/observium

I’ll second that. 1100 alerts this morning 😊
From: observium observium-bounces@observium.org On Behalf Of Adam Armstrong via observium Sent: Monday, 21 October 2019 05:48 To: Ryan, Spencer via observium observium@observium.org Cc: Adam Armstrong adama@memetic.org Subject: Re: [Observium] Alert checkers triggering on down/0 speed interfaces
ifHighSpeed => 0 This seems to be because ifspeed and ifhighspeed are both zero. You might see why this is in the debugging output. Adam. Sent from BlueMailhttp://www.bluemail.me/r?b=15704 On 20 Oct 2019, at 16:49, "Ryan, Spencer via observium" <observium@observium.orgmailto:observium@observium.org> wrote: Since updating to 10134 we’ve seen some odd behavior out of our high interface utilization alerts.
The alert itself is very simple, device matches *, entity is ifType equals ethernetCsmacd, and the test conditions are any of:
ifInOctets_perc ge 80 ifOutOctets_perc ge 80
Which has worked fine forever.
Now it’s throwing alarms on an odd mix of devices (UBNT, Palo Alto, Arista, Kemp VLM, Infoblox) for ports that are down/down loopbacks or HA interfaces not connected.
All of the ports it is alarming on show this in the data (Speed 0, and down/down):
ifSpeed=>0 ifHighSpeed=>0 ifOperStatus=>down ifAdminStatus=>down
Any idea what changed or why it’s alarming on these now? I’m guessing its trying to do the 80% math on….0 but I’d imagine that shouldn’t even run if the port is admin+operationally down.
This is a mgmt interface on an arista (which is unconnected and admin down):
As you can see the *_perc calcs are 0, it almost seems some kind of divide by 0 error.
Thanks in advance!
Spencer Ryan | Senior Systems Administrator | spencer.ryan@netscout.commailto:spencer.ryan@netscout.com Arbor Networks | The security division of NETSCOUT +1.734.794.5033 (d) | +1.734.846.2053 (m) www.arbornetworks.comhttp://www.arbornetworks.com/
________________________________
observium mailing list observium@observium.orgmailto:observium@observium.org http://postman.memetic.org/cgi-bin/mailman/listinfo/observium

same problem here - lot’s of false positive alarms. any quick fix suggestions on how to remedy the symptoms?
cheers, Andreas
On 20. Oct 2019, at 17:48, Ryan, Spencer via observium <observium@observium.org mailto:observium@observium.org> wrote:
Since updating to 10134 we’ve seen some odd behavior out of our high interface utilization alerts.
The alert itself is very simple, device matches *, entity is ifType equals ethernetCsmacd, and the test conditions are any of:
ifInOctets_perc ge 80 ifOutOctets_perc ge 80
Which has worked fine forever.
Now it’s throwing alarms on an odd mix of devices (UBNT, Palo Alto, Arista, Kemp VLM, Infoblox) for ports that are down/down loopbacks or HA interfaces not connected.
All of the ports it is alarming on show this in the data (Speed 0, and down/down):
ifSpeed=>0 ifHighSpeed=>0 ifOperStatus=>down ifAdminStatus=>down
Any idea what changed or why it’s alarming on these now? I’m guessing its trying to do the 80% math on….0 but I’d imagine that shouldn’t even run if the port is admin+operationally down.
This is a mgmt interface on an arista (which is unconnected and admin down):
https://pastebin.com/JsNvre40 https://pastebin.com/JsNvre40
As you can see the *_perc calcs are 0, it almost seems some kind of divide by 0 error.
Thanks in advance!
Spencer Ryan | Senior Systems Administrator | spencer.ryan@netscout.com mailto:spencer.ryan@netscout.com Arbor Networks | The security division of NETSCOUT +1.734.794.5033 (d) | +1.734.846.2053 (m) www.arbornetworks.com http://www.arbornetworks.com/
observium mailing list observium@observium.org mailto:observium@observium.org http://postman.memetic.org/cgi-bin/mailman/listinfo/observium http://postman.memetic.org/cgi-bin/mailman/listinfo/observium

Quick fix for us was:
Am Mo., 21. Okt. 2019 um 08:29 Uhr schrieb Andreas Kotowicz via observium < observium@observium.org>:
same problem here - lot’s of false positive alarms. any quick fix suggestions on how to remedy the symptoms?
cheers, Andreas
On 20. Oct 2019, at 17:48, Ryan, Spencer via observium < observium@observium.org> wrote:
Since updating to 10134 we’ve seen some odd behavior out of our high interface utilization alerts.
The alert itself is very simple, device matches *, entity is ifType equals ethernetCsmacd, and the test conditions are any of:
ifInOctets_perc ge 80 ifOutOctets_perc ge 80
Which has worked fine forever.
Now it’s throwing alarms on an odd mix of devices (UBNT, Palo Alto, Arista, Kemp VLM, Infoblox) for ports that are down/down loopbacks or HA interfaces not connected.
All of the ports it is alarming on show this in the data (Speed 0, and down/down):
ifSpeed=>0 ifHighSpeed=>0 ifOperStatus=>down ifAdminStatus=>down
Any idea what changed or why it’s alarming on these now? I’m guessing its trying to do the 80% math on….0 but I’d imagine that shouldn’t even run if the port is admin+operationally down.
This is a mgmt interface on an arista (which is unconnected and admin down):
As you can see the *_perc calcs are 0, it almost seems some kind of divide by 0 error.
Thanks in advance!
*Spencer Ryan* | Senior Systems Administrator | spencer.ryan@netscout.com *Arbor Networks* | *The security division of NETSCOUT* +1.734.794.5033 (d) | +1.734.846.2053 (m) www.arbornetworks.com
observium mailing list observium@observium.org http://postman.memetic.org/cgi-bin/mailman/listinfo/observium
observium mailing list observium@observium.org http://postman.memetic.org/cgi-bin/mailman/listinfo/observium
That’s probably what we will end up doing. Clearly something changed though since none of us saw this behavior before.
I’m curious if new interfaces showed up after the update, or if the alert processor is now doing something different for interfaces that are reporting ifSpeed = 0
From: observium observium-bounces@observium.org On Behalf Of Basile Bluntschli via observium Sent: Monday, October 21, 2019 10:58 AM To: Observium observium@observium.org Cc: Basile Bluntschli basile.bluntschli@gmail.com Subject: Re: [Observium] Alert checkers triggering on down/0 speed interfaces
This message originated outside of NETSCOUT. Do not click links or open attachments unless you recognize the sender and know the content is safe. Quick fix for us was:
Am Mo., 21. Okt. 2019 um 08:29 Uhr schrieb Andreas Kotowicz via observium <observium@observium.orgmailto:observium@observium.org>: same problem here - lot’s of false positive alarms. any quick fix suggestions on how to remedy the symptoms?
cheers, Andreas
On 20. Oct 2019, at 17:48, Ryan, Spencer via observium <observium@observium.orgmailto:observium@observium.org> wrote:
Since updating to 10134 we’ve seen some odd behavior out of our high interface utilization alerts.
The alert itself is very simple, device matches *, entity is ifType equals ethernetCsmacd, and the test conditions are any of:
ifInOctets_perc ge 80 ifOutOctets_perc ge 80
Which has worked fine forever.
Now it’s throwing alarms on an odd mix of devices (UBNT, Palo Alto, Arista, Kemp VLM, Infoblox) for ports that are down/down loopbacks or HA interfaces not connected.
All of the ports it is alarming on show this in the data (Speed 0, and down/down):
ifSpeed=>0 ifHighSpeed=>0 ifOperStatus=>down ifAdminStatus=>down
Any idea what changed or why it’s alarming on these now? I’m guessing its trying to do the 80% math on….0 but I’d imagine that shouldn’t even run if the port is admin+operationally down.
This is a mgmt interface on an arista (which is unconnected and admin down):
As you can see the *_perc calcs are 0, it almost seems some kind of divide by 0 error.
Thanks in advance!
Spencer Ryan | Senior Systems Administrator | spencer.ryan@netscout.commailto:spencer.ryan@netscout.com Arbor Networks | The security division of NETSCOUT +1.734.794.5033 (d) | +1.734.846.2053 (m) www.arbornetworks.comhttp://www.arbornetworks.com/
_______________________________________________ observium mailing list observium@observium.orgmailto:observium@observium.org http://postman.memetic.org/cgi-bin/mailman/listinfo/observium
_______________________________________________ observium mailing list observium@observium.orgmailto:observium@observium.org http://postman.memetic.org/cgi-bin/mailman/listinfo/observium

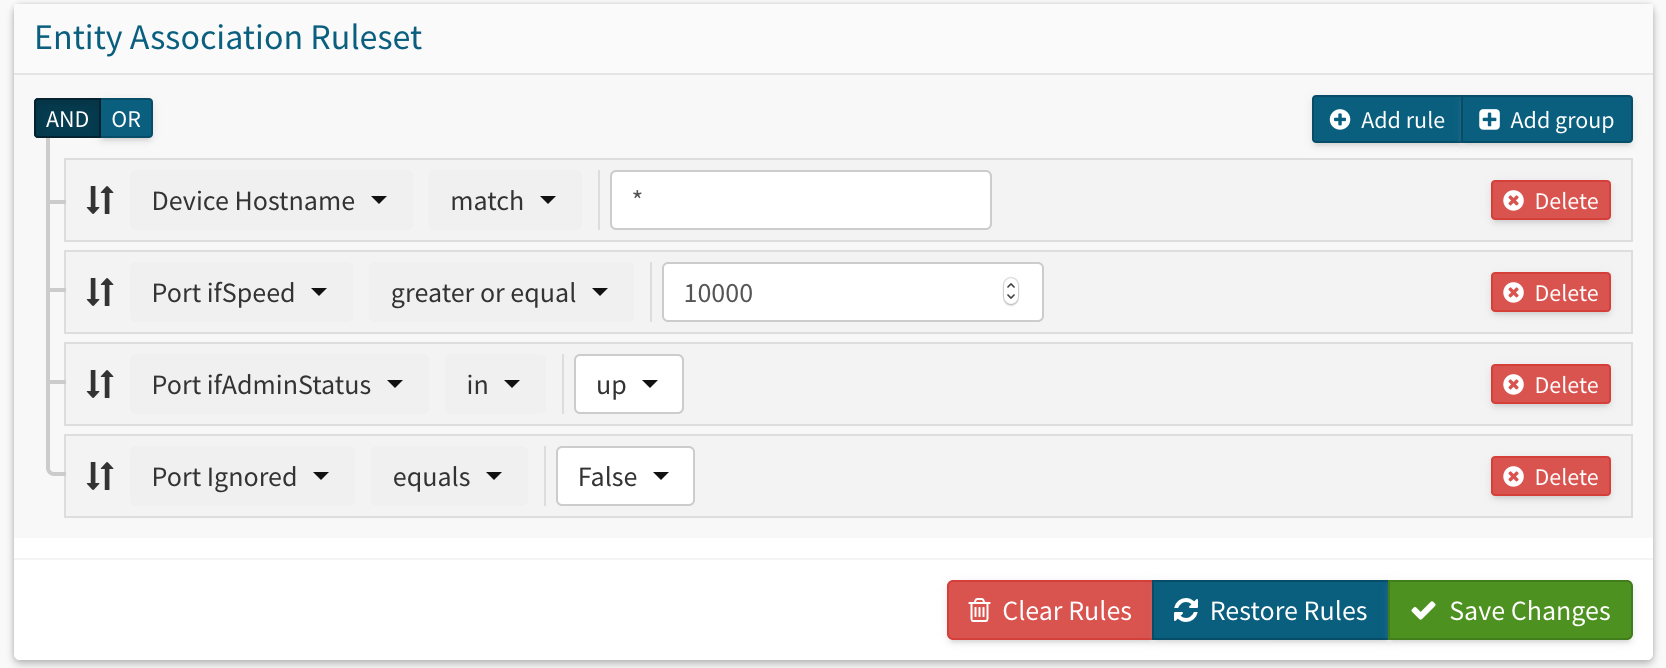
As I see, quick fix is append this to check condition:
ifSpeed gt 0
Ryan, Spencer via observium wrote on 20/10/2019 18:48:
Since updating to 10134 we’ve seen some odd behavior out of our high interface utilization alerts.
The alert itself is very simple, device matches *, entity is |ifType equals ethernetCsmacd, |and the test conditions are any of:
|ifInOctets_perc ge 80| |ifOutOctets_perc ge 80|
| |
Which has worked fine forever.
Now it’s throwing alarms on an odd mix of devices (UBNT, Palo Alto, Arista, Kemp VLM, Infoblox) for ports that are down/down loopbacks or HA interfaces not connected.
All of the ports it is alarming on show this in the data (Speed 0, and down/down):
ifSpeed=>0
ifHighSpeed=>0
ifOperStatus=>down
ifAdminStatus=>down
Any idea what changed or why it’s alarming on these now? I’m guessing its trying to do the 80% math on….0 but I’d imagine that shouldn’t even run if the port is admin+operationally down.
This is a mgmt interface on an arista (which is unconnected and admin down):
As you can see the *_perc calcs are 0, it almost seems some kind of divide by 0 error.
Thanks in advance!
*Spencer Ryan*| Senior Systems Administrator | spencer.ryan@netscout.com mailto:spencer.ryan@netscout.com
*Arbor Networks*| *The security division of NETSCOUT*
+1.734.794.5033 (d) | +1.734.846.2053 (m)
www.arbornetworks.com http://www.arbornetworks.com/
observium mailing list observium@observium.org http://postman.memetic.org/cgi-bin/mailman/listinfo/observium
That's what we ended up doing and it seems to be just fine. It was also a kick for me to rebuild all my checks, they're so old none of them had the ruleset builder available.
From: Mike Stupalov mike@stupalov.ru On Behalf Of Mike Stupalov Sent: Monday, October 21, 2019 12:06 PM To: Observium observium@observium.org; Ryan, Spencer via observium observium@observium.org Cc: Ryan, Spencer spencer.ryan@netscout.com Subject: Re: [Observium] Alert checkers triggering on down/0 speed interfaces
This message originated outside of NETSCOUT. Do not click links or open attachments unless you recognize the sender and know the content is safe. As I see, quick fix is append this to check condition:
ifSpeed gt 0
Ryan, Spencer via observium wrote on 20/10/2019 18:48:
Since updating to 10134 we've seen some odd behavior out of our high interface utilization alerts.
The alert itself is very simple, device matches *, entity is ifType equals ethernetCsmacd, and the test conditions are any of:
ifInOctets_perc ge 80 ifOutOctets_perc ge 80
Which has worked fine forever.
Now it's throwing alarms on an odd mix of devices (UBNT, Palo Alto, Arista, Kemp VLM, Infoblox) for ports that are down/down loopbacks or HA interfaces not connected.
All of the ports it is alarming on show this in the data (Speed 0, and down/down):
ifSpeed=>0 ifHighSpeed=>0 ifOperStatus=>down ifAdminStatus=>down
Any idea what changed or why it's alarming on these now? I'm guessing its trying to do the 80% math on....0 but I'd imagine that shouldn't even run if the port is admin+operationally down.
This is a mgmt interface on an arista (which is unconnected and admin down):
As you can see the *_perc calcs are 0, it almost seems some kind of divide by 0 error.
Thanks in advance!
Spencer Ryan | Senior Systems Administrator | spencer.ryan@netscout.commailto:spencer.ryan@netscout.com Arbor Networks | The security division of NETSCOUT +1.734.794.5033 (d) | +1.734.846.2053 (m) www.arbornetworks.comhttp://www.arbornetworks.com/
_______________________________________________
observium mailing list
observium@observium.orgmailto:observium@observium.org
http://postman.memetic.org/cgi-bin/mailman/listinfo/observium
-- Mike Stupalov Observium Limited, http://observium.org

There's a manual migration tool you can use at /migrate_alerts/
It'll try to build the ruleset builder array from the plain text.
It was always intended to be auto-run as part of an update, but I've not been brave enough yet.
Adam.
From: observium observium-bounces@observium.org On Behalf Of Ryan, Spencer via observium Sent: 21 October 2019 17:24 To: Observium observium@observium.org Cc: Ryan, Spencer spencer.ryan@netscout.com Subject: Re: [Observium] Alert checkers triggering on down/0 speed interfaces
That's what we ended up doing and it seems to be just fine. It was also a kick for me to rebuild all my checks, they're so old none of them had the ruleset builder available.
From: Mike Stupalov <mike@stupalov.ru mailto:mike@stupalov.ru > On Behalf Of Mike Stupalov Sent: Monday, October 21, 2019 12:06 PM To: Observium <observium@observium.org mailto:observium@observium.org >; Ryan, Spencer via observium <observium@observium.org mailto:observium@observium.org > Cc: Ryan, Spencer <spencer.ryan@netscout.com mailto:spencer.ryan@netscout.com > Subject: Re: [Observium] Alert checkers triggering on down/0 speed interfaces
This message originated outside of NETSCOUT. Do not click links or open attachments unless you recognize the sender and know the content is safe.
As I see, quick fix is append this to check condition:
ifSpeed gt 0
Ryan, Spencer via observium wrote on 20/10/2019 18:48:
Since updating to 10134 we've seen some odd behavior out of our high interface utilization alerts.
The alert itself is very simple, device matches *, entity is ifType equals ethernetCsmacd, and the test conditions are any of:
ifInOctets_perc ge 80 ifOutOctets_perc ge 80
Which has worked fine forever.
Now it's throwing alarms on an odd mix of devices (UBNT, Palo Alto, Arista, Kemp VLM, Infoblox) for ports that are down/down loopbacks or HA interfaces not connected.
All of the ports it is alarming on show this in the data (Speed 0, and down/down):
ifSpeed=>0
ifHighSpeed=>0
ifOperStatus=>down
ifAdminStatus=>down
Any idea what changed or why it's alarming on these now? I'm guessing its trying to do the 80% math on..0 but I'd imagine that shouldn't even run if the port is admin+operationally down.
This is a mgmt interface on an arista (which is unconnected and admin down):
As you can see the *_perc calcs are 0, it almost seems some kind of divide by 0 error.
Thanks in advance!
Spencer Ryan | Senior Systems Administrator | spencer.ryan@netscout.com mailto:spencer.ryan@netscout.com
Arbor Networks | The security division of NETSCOUT
+1.734.794.5033 (d) | +1.734.846.2053 (m)
http://www.arbornetworks.com/ www.arbornetworks.com
_______________________________________________ observium mailing list observium@observium.org mailto:observium@observium.org http://postman.memetic.org/cgi-bin/mailman/listinfo/observium
participants (7)
-
 Adam Armstrong
 -
 adama@observium.org
 -
 Andreas Kotowicz
 -
 Basile Bluntschli
 -
 Mike Stupalov
 -
 Rowlands Mark
 -
 Ryan, Spencer