Abnormal spike in billing graphs - r2719

Hello,
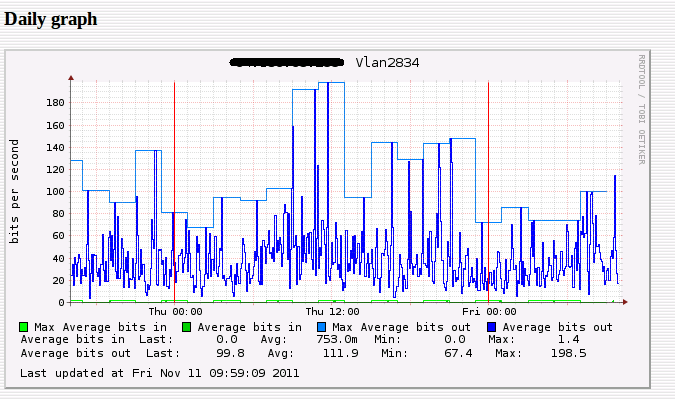
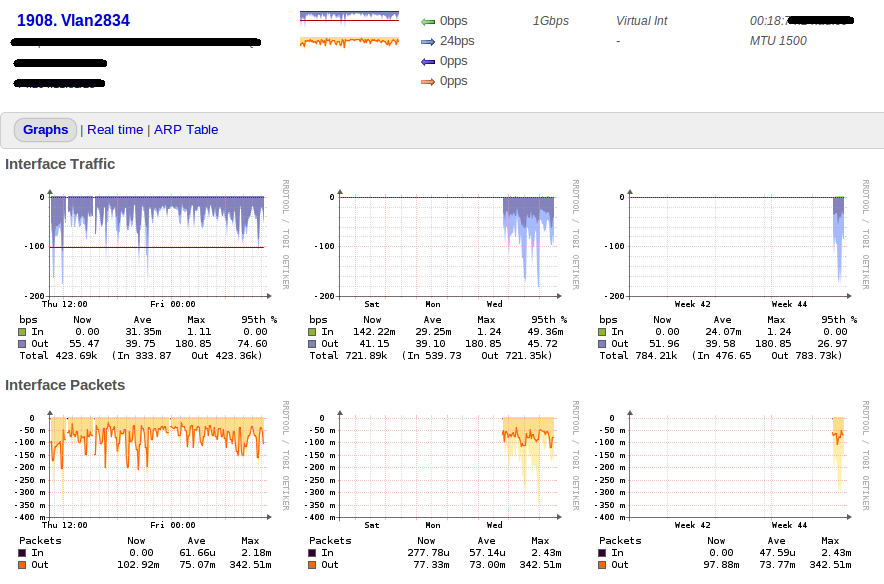
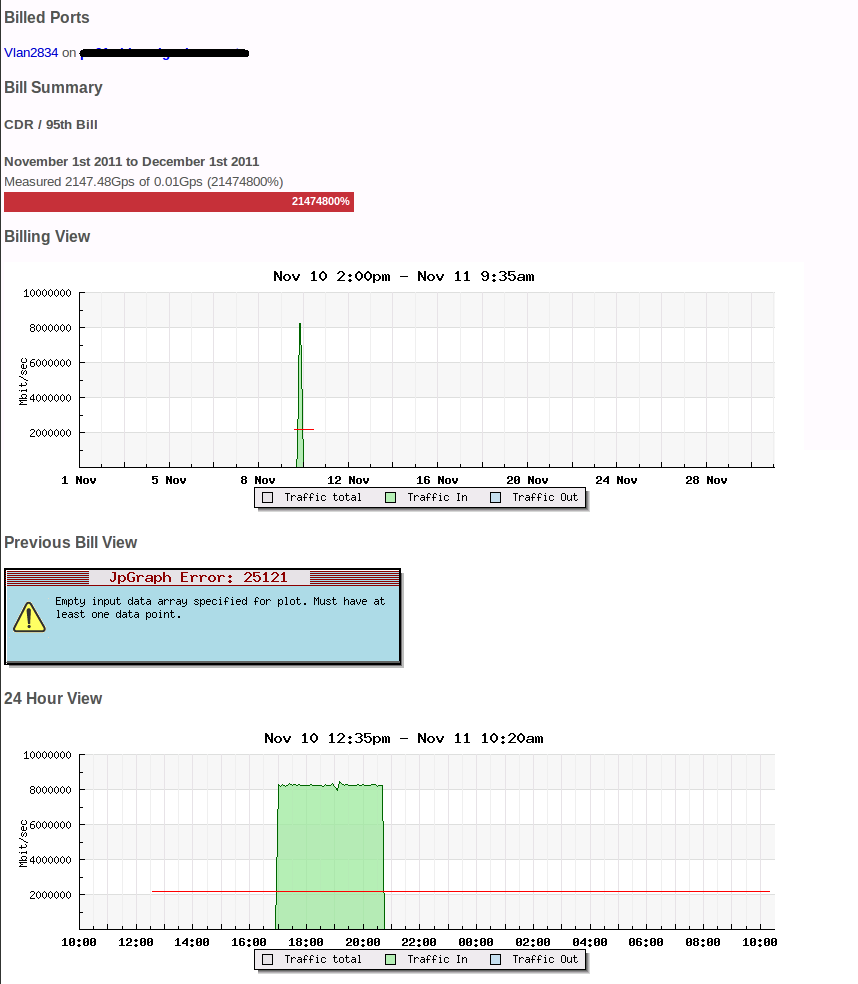
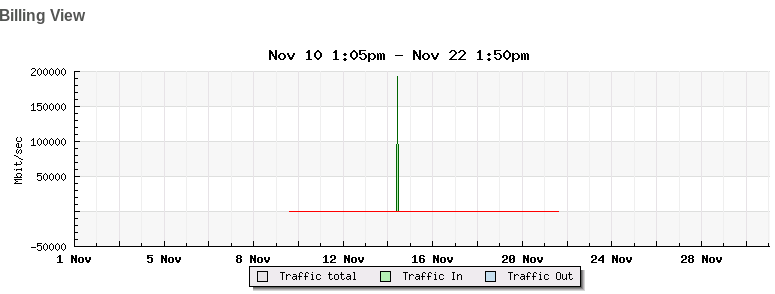
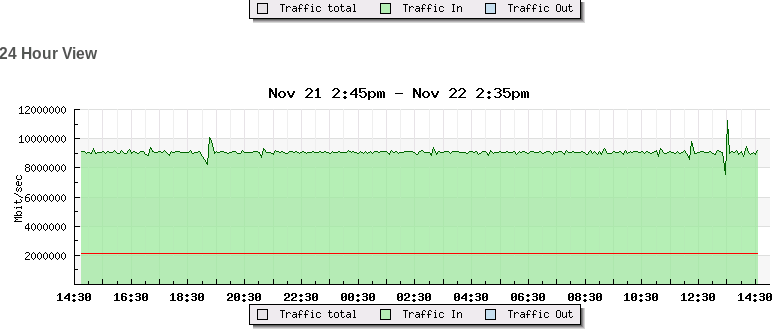
I've just recently setup Observium and noticed a strange spike in reported usage for one billing item, that wasn't reported in the actual interfaces stats.
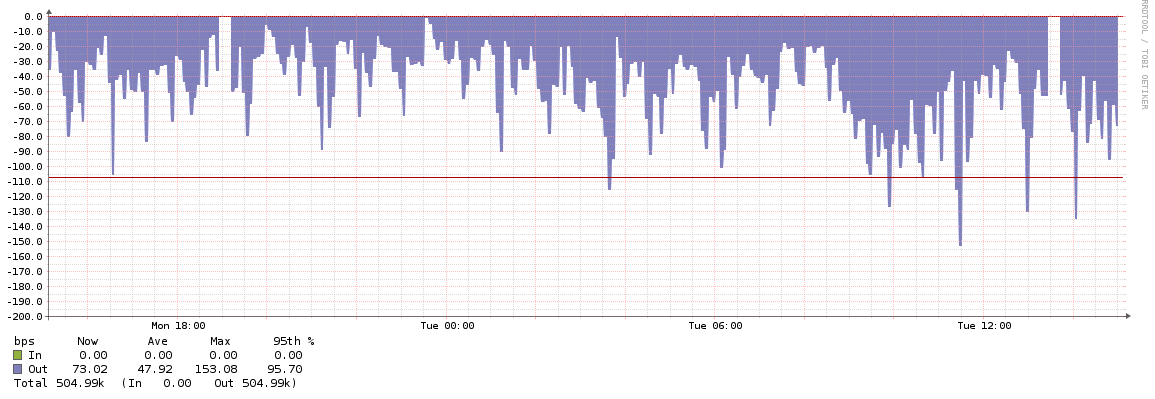
I've attached three screen shots, one of the accurate billing page for the billing entry in question, the 2nd for the interface page under the device, and the 3rd for the same interface as seen from a cricket install.
As you can see the physical interface graphs in Observium or cricket don't show this extended period of ~ 8Gb/s that show up in the mysql based graphs.
Looking at bill_data for the bill_id in question there were 45 entries where in_delta was exactly 309525032051591 while out_delta continues to change. Here is an example row:
31, 2011-11-10 17:35:06, 299, 309525032052787, 309525032051591, 1196
This has only manifested in this one billing.
Let me know if there is anything else I can look at or provide that would assist.
Thank you in advance.
Thanks, Berant

Hmm. That is very bizarre.
What is the current counter for that interface? My only guess is that it for whatever reason managed to not get the "previous" value from the database, and kept inserting current-0 = delta, giving you a value of "current total as if it had all ahppened in the last 5 minutes" for the period of time the bug manifested.
The billing code is a little weird, it's very old. I REALLY, REALLY want to clean it up, but because people are now using it, it's a little difficult :)
adam.
On Fri, 11 Nov 2011 14:51:58 -0500, Berant Lemmenes berant@lemmenes.com wrote:
Hello,
I've just recently setup Observium and noticed a strange spike in
reported
usage for one billing item, that wasn't reported in the actual
interfaces
stats.
I've attached three screen shots, one of the accurate billing page for
the
billing entry in question, the 2nd for the interface page under the
device,
and the 3rd for the same interface as seen from a cricket install.
As you can see the physical interface graphs in Observium or cricket
don't
show this extended period of ~ 8Gb/s that show up in the mysql based graphs.
Looking at bill_data for the bill_id in question there were 45 entries where in_delta was exactly 309525032051591 while out_delta continues to change. Here is an example row:
31, 2011-11-10 17:35:06, 299, 309525032052787, 309525032051591, 1196
This has only manifested in this one billing.
Let me know if there is anything else I can look at or provide that
would
assist.
Thank you in advance.
Thanks, Berant
Here is the current counter for that interface:
IF-MIB::ifHCInOctets.1908 = Counter64: 644216574
Yeah, and I imagine people don't want oddities happening in billing during a re-write.
Is there anything else I can provide to help narrow things down?
Thanks, Berant
On Fri, Nov 11, 2011 at 3:48 PM, Adam Armstrong adama@memetic.org wrote:
Hmm. That is very bizarre.
What is the current counter for that interface? My only guess is that it for whatever reason managed to not get the "previous" value from the database, and kept inserting current-0 = delta, giving you a value of "current total as if it had all ahppened in the last 5 minutes" for the period of time the bug manifested.
The billing code is a little weird, it's very old. I REALLY, REALLY want to clean it up, but because people are now using it, it's a little difficult :)
adam.
On Fri, 11 Nov 2011 14:51:58 -0500, Berant Lemmenes berant@lemmenes.com wrote:
Hello,
I've just recently setup Observium and noticed a strange spike in
reported
usage for one billing item, that wasn't reported in the actual
interfaces
stats.
I've attached three screen shots, one of the accurate billing page for
the
billing entry in question, the 2nd for the interface page under the
device,
and the 3rd for the same interface as seen from a cricket install.
As you can see the physical interface graphs in Observium or cricket
don't
show this extended period of ~ 8Gb/s that show up in the mysql based graphs.
Looking at bill_data for the bill_id in question there were 45 entries where in_delta was exactly 309525032051591 while out_delta continues to change. Here is an example row:
31, 2011-11-10 17:35:06, 299, 309525032052787, 309525032051591, 1196
This has only manifested in this one billing.
Let me know if there is anything else I can look at or provide that
would
assist.
Thank you in advance.
Thanks, Berant
observium mailing list observium@observium.org http://postman.memetic.org/cgi-bin/mailman/listinfo/observium
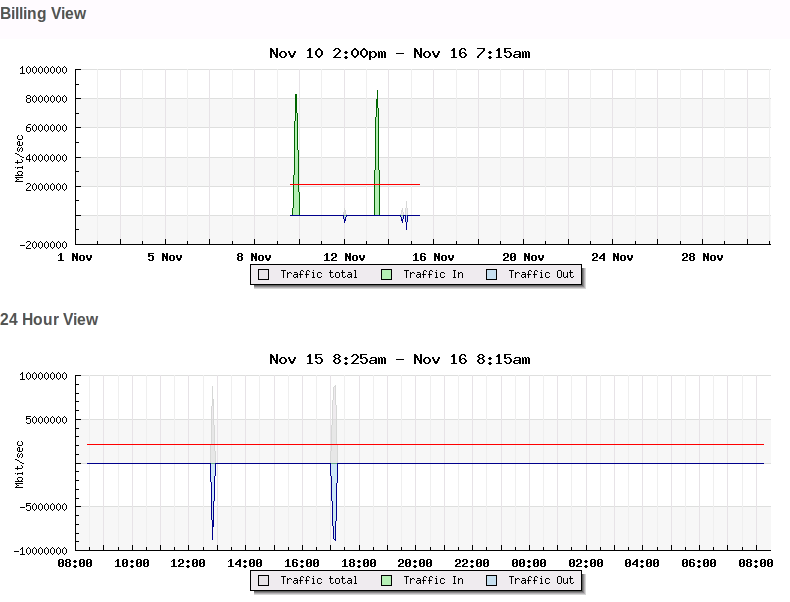
The same bill entry that I first reported an issue with has had another 8Gib/s spike as you can see attached below.
I'm up for assisting in anyway to help root this out.
Thanks.
On Fri, Nov 11, 2011 at 4:50 PM, Berant Lemmenes berant@lemmenes.comwrote:
Here is the current counter for that interface:
IF-MIB::ifHCInOctets.1908 = Counter64: 644216574
Yeah, and I imagine people don't want oddities happening in billing during a re-write.
Is there anything else I can provide to help narrow things down?
Thanks, Berant
On Fri, Nov 11, 2011 at 3:48 PM, Adam Armstrong adama@memetic.org wrote:
Hmm. That is very bizarre.
What is the current counter for that interface? My only guess is that it for whatever reason managed to not get the "previous" value from the database, and kept inserting current-0 = delta, giving you a value of "current total as if it had all ahppened in the last 5 minutes" for the period of time the bug manifested.
The billing code is a little weird, it's very old. I REALLY, REALLY want to clean it up, but because people are now using it, it's a little difficult :)
adam.
On Fri, 11 Nov 2011 14:51:58 -0500, Berant Lemmenes berant@lemmenes.com wrote:
Hello,
I've just recently setup Observium and noticed a strange spike in
reported
usage for one billing item, that wasn't reported in the actual
interfaces
stats.
I've attached three screen shots, one of the accurate billing page for
the
billing entry in question, the 2nd for the interface page under the
device,
and the 3rd for the same interface as seen from a cricket install.
As you can see the physical interface graphs in Observium or cricket
don't
show this extended period of ~ 8Gb/s that show up in the mysql based graphs.
Looking at bill_data for the bill_id in question there were 45 entries where in_delta was exactly 309525032051591 while out_delta continues to change. Here is an example row:
31, 2011-11-10 17:35:06, 299, 309525032052787, 309525032051591, 1196
This has only manifested in this one billing.
Let me know if there is anything else I can look at or provide that
would
assist.
Thank you in advance.
Thanks, Berant
observium mailing list observium@observium.org http://postman.memetic.org/cgi-bin/mailman/listinfo/observium
Same thing, I should imagine. I've never seen this bug present anywhere else.
Is the device being polled quite far away? Or attached on the end of some string?
What is the measurement directly before the spike?
adam.
On Wed, 16 Nov 2011 08:20:19 -0500, Berant Lemmenes berant@lemmenes.com wrote:
The same bill entry that I first reported an issue with has had another 8Gib/s spike as you can see attached below.
I'm up for assisting in anyway to help root this out.
Thanks.
On Fri, Nov 11, 2011 at 4:50 PM, Berant Lemmenes berant@lemmenes.comwrote:
Here is the current counter for that interface:
IF-MIB::ifHCInOctets.1908 = Counter64: 644216574
Yeah, and I imagine people don't want oddities happening in billing during a re-write.
Is there anything else I can provide to help narrow things down?
Thanks, Berant
On Fri, Nov 11, 2011 at 3:48 PM, Adam Armstrong adama@memetic.org wrote:
Hmm. That is very bizarre.
What is the current counter for that interface? My only guess is that
it
for whatever reason managed to not get the "previous" value from the database, and kept inserting current-0 = delta, giving you a value of "current total as if it had all ahppened in the last 5 minutes" for
the
period of time the bug manifested.
The billing code is a little weird, it's very old. I REALLY, REALLY
want
to clean it up, but because people are now using it, it's a little difficult :)
adam.
On Fri, 11 Nov 2011 14:51:58 -0500, Berant Lemmenes berant@lemmenes.com wrote:
Hello,
I've just recently setup Observium and noticed a strange spike in
reported
usage for one billing item, that wasn't reported in the actual
interfaces
stats.
I've attached three screen shots, one of the accurate billing page
for
the
billing entry in question, the 2nd for the interface page under the
device,
and the 3rd for the same interface as seen from a cricket install.
As you can see the physical interface graphs in Observium or cricket
don't
show this extended period of ~ 8Gb/s that show up in the mysql based graphs.
Looking at bill_data for the bill_id in question there were 45
entries
where in_delta was exactly 309525032051591 while out_delta continues to change. Here is an example row:
31, 2011-11-10 17:35:06, 299, 309525032052787, 309525032051591, 1196
This has only manifested in this one billing.
Let me know if there is anything else I can look at or provide that
would
assist.
Thank you in advance.
Thanks, Berant
observium mailing list observium@observium.org http://postman.memetic.org/cgi-bin/mailman/listinfo/observium
On Wed, Nov 16, 2011 at 8:16 AM, Adam Armstrong adama@memetic.org wrote:
Same thing, I should imagine. I've never seen this bug present anywhere else.
Is the device being polled quite far away? Or attached on the end of some string?
What is the measurement directly before the spike?
adam.
It's actually diversely routed bailing wire. :) It's about ~300 miles away or 6ms as the packet flies.
Looking at the data it looks like in_delta is looking suspicious, it's either 0, 64, 896, or some crazy large value during the spike. There is essentially 0 inbound traffic on this interface and barely any outbound, could that play into it?
Here are the values before and at the start of the large blocks of high values:
31, 2011-11-10 16:55:07, 300, 400, 64, 336 31, 2011-11-10 17:00:06, 299, 309525032052119, 309525032051591, 528
31, 2011-11-14 07:40:09, 299, 2608, 64, 2544 31, 2011-11-14 07:45:11, 302, 321074668856640, 321074668848076, 8564
Ahh shit, that table doesn't store counters, only deltas.
What is the current SNMP counter for that port?
adam.
On Wed, 16 Nov 2011 09:12:21 -0500, Berant Lemmenes berant@lemmenes.com wrote:
On Wed, Nov 16, 2011 at 8:16 AM, Adam Armstrong adama@memetic.org
wrote:
Same thing, I should imagine. I've never seen this bug present anywhere else.
Is the device being polled quite far away? Or attached on the end of
some
string?
What is the measurement directly before the spike?
adam.
It's actually diversely routed bailing wire. :) It's about ~300 miles
away
or 6ms as the packet flies.
Looking at the data it looks like in_delta is looking suspicious, it's either 0, 64, 896, or some crazy large value during the spike. There is essentially 0 inbound traffic on this interface and barely any outbound, could that play into it?
Here are the values before and at the start of the large blocks of high values:
31, 2011-11-10 16:55:07, 300, 400, 64, 336 31, 2011-11-10 17:00:06, 299, 309525032052119, 309525032051591, 528
31, 2011-11-14 07:40:09, 299, 2608, 64, 2544 31, 2011-11-14 07:45:11, 302, 321074668856640, 321074668848076, 8564
IF-MIB::ifHCOutOctets.1908 = Counter64: 1302403640
IF-MIB::ifHCInOctets.1908 = Counter64: 644218878
On Wed, Nov 16, 2011 at 9:18 AM, Adam Armstrong adama@memetic.org wrote:
Ahh shit, that table doesn't store counters, only deltas.
What is the current SNMP counter for that port?
adam.
On Wed, 16 Nov 2011 09:12:21 -0500, Berant Lemmenes berant@lemmenes.com wrote:
On Wed, Nov 16, 2011 at 8:16 AM, Adam Armstrong adama@memetic.org
wrote:
Same thing, I should imagine. I've never seen this bug present anywhere else.
Is the device being polled quite far away? Or attached on the end of
some
string?
What is the measurement directly before the spike?
adam.
It's actually diversely routed bailing wire. :) It's about ~300 miles
away
or 6ms as the packet flies.
Looking at the data it looks like in_delta is looking suspicious, it's either 0, 64, 896, or some crazy large value during the spike. There is essentially 0 inbound traffic on this interface and barely any outbound, could that play into it?
Here are the values before and at the start of the large blocks of high values:
31, 2011-11-10 16:55:07, 300, 400, 64, 336 31, 2011-11-10 17:00:06, 299, 309525032052119, 309525032051591, 528
31, 2011-11-14 07:40:09, 299, 2608, 64, 2544 31, 2011-11-14 07:45:11, 302, 321074668856640, 321074668848076, 8564
observium mailing list observium@observium.org http://postman.memetic.org/cgi-bin/mailman/listinfo/observium
So was the "Ahh shit.." comment a revelation indicating you can see an issue?
I've seen a couple other entries where there is a burst that doesn't fit with the interface counters, however none as consistent as the one I originally emailed on.
The below bill/interface just had a burst small burst inbound that doesn't show up in the counters, but does in the billing graph (bill1-accurate.png).
bill_data:
20, 2011-11-15 08:15:08, 299, 749963913, 2972, 749960941 20, 2011-11-15 08:20:07, 300, 1020775706, 1885, 1020773821 20, 2011-11-15 08:25:09, 302, 813072182, 1806, 813070376 20, 2011-11-15 08:30:08, 299, 803081017, 4671, 803076346 20, 2011-11-15 08:35:07, 299, 1182257940, 2472, 1182255468 20, 2011-11-15 08:40:08, 301, 65126192730628, 65124905329746, 1287400882 20, 2011-11-15 08:45:07, 300, 65126107460041, 65124905329746, 1202130295 20, 2011-11-15 08:50:08, 301, 1268579798, 3388, 1268576410 20, 2011-11-15 08:55:08, 300, 1223124545, 3515, 1223121030 20, 2011-11-15 09:00:07, 299, 1459063239, 2204, 1459061035
Which stands out not only because of the massive increase, but also being exactly the same. bill_history:
20, XXXXX, cdr, 10000, 1, 0, 0, 62454, 62454, out, 134360224, 130251020, 4109204, 0, 0, 1032722, 2011-11-22 12:23:34, , , , 0
The original interface (index 1908) has been showing a continual 8Gb/s of inbound delta (bill2-accurate.png), even though if you look at the ifHCInOctets there is actually zero change. And it doesn't show up in the interface graphs (bill2-interface.png)
Tue Nov 22 14:27:45 EST 2011 berant@observium:/opt/observium$ date ; snmpget -c Not4SnMpP -v 2c X.X.X.X 1.3.6.1.2.1.31.1.1.1.6.1908 Tue Nov 22 14:28:01 EST 2011 IF-MIB::ifHCInOctets.1908 = Counter64: 644220606 berant@observium:/opt/observium$ date ; snmpget -c Not4SnMpP -v 2c X.X.X.X 1.3.6.1.2.1.31.1.1.1.6.1908 Tue Nov 22 14:35:04 EST 2011 IF-MIB::ifHCInOctets.1908 = Counter64: 644220606 berant@observium:/opt/observium$ date ; snmpget -c Not4SnMpP -v 2c X.X.X.X 1.3.6.1.2.1.31.1.1.1.6.1908 Tue Nov 22 14:42:39 EST 2011 IF-MIB::ifHCInOctets.1908 = Counter64: 644220606 berant@observium:/opt/observium$ date ; snmpget -c Not4SnMpP -v 2c X.X.X.X 1.3.6.1.2.1.31.1.1.1.6.1908 Tue Nov 22 14:47:39 EST 2011 IF-MIB::ifHCInOctets.1908 = Counter64: 644220606
All of the bills I've seen this issue on have extremely minimal or in the above case zero traffic in one direction or another.
Anything else I can provide?
Thanks, Berant
On Wed, Nov 16, 2011 at 9:34 AM, Berant Lemmenes berant@lemmenes.comwrote:
IF-MIB::ifHCOutOctets.1908 = Counter64: 1302403640
IF-MIB::ifHCInOctets.1908 = Counter64: 644218878
On Wed, Nov 16, 2011 at 9:18 AM, Adam Armstrong adama@memetic.org wrote:
Ahh shit, that table doesn't store counters, only deltas.
What is the current SNMP counter for that port?
adam.
On Wed, 16 Nov 2011 09:12:21 -0500, Berant Lemmenes berant@lemmenes.com wrote:
On Wed, Nov 16, 2011 at 8:16 AM, Adam Armstrong adama@memetic.org
wrote:
Same thing, I should imagine. I've never seen this bug present anywhere else.
Is the device being polled quite far away? Or attached on the end of
some
string?
What is the measurement directly before the spike?
adam.
It's actually diversely routed bailing wire. :) It's about ~300 miles
away
or 6ms as the packet flies.
Looking at the data it looks like in_delta is looking suspicious, it's either 0, 64, 896, or some crazy large value during the spike. There is essentially 0 inbound traffic on this interface and barely any outbound, could that play into it?
Here are the values before and at the start of the large blocks of high values:
31, 2011-11-10 16:55:07, 300, 400, 64, 336 31, 2011-11-10 17:00:06, 299, 309525032052119, 309525032051591, 528
31, 2011-11-14 07:40:09, 299, 2608, 64, 2544 31, 2011-11-14 07:45:11, 302, 321074668856640, 321074668848076, 8564
observium mailing list observium@observium.org http://postman.memetic.org/cgi-bin/mailman/listinfo/observium
Are you able to give me access to that installation, to try to find the bit of code generating those values?
adam.
On Tue, 22 Nov 2011 15:29:16 -0500, Berant Lemmenes berant@lemmenes.com wrote:
So was the "Ahh shit.." comment a revelation indicating you can see an issue?
I've seen a couple other entries where there is a burst that doesn't fit with the interface counters, however none as consistent as the one I originally emailed on.
The below bill/interface just had a burst small burst inbound that
doesn't
show up in the counters, but does in the billing graph (bill1-accurate.png).
bill_data:
20, 2011-11-15 08:15:08, 299, 749963913, 2972, 749960941 20, 2011-11-15 08:20:07, 300, 1020775706, 1885, 1020773821 20, 2011-11-15 08:25:09, 302, 813072182, 1806, 813070376 20, 2011-11-15 08:30:08, 299, 803081017, 4671, 803076346 20, 2011-11-15 08:35:07, 299, 1182257940, 2472, 1182255468 20, 2011-11-15 08:40:08, 301, 65126192730628, 65124905329746, 1287400882 20, 2011-11-15 08:45:07, 300, 65126107460041, 65124905329746, 1202130295 20, 2011-11-15 08:50:08, 301, 1268579798, 3388, 1268576410 20, 2011-11-15 08:55:08, 300, 1223124545, 3515, 1223121030 20, 2011-11-15 09:00:07, 299, 1459063239, 2204, 1459061035
Which stands out not only because of the massive increase, but also
being
exactly the same. bill_history:
20, XXXXX, cdr, 10000, 1, 0, 0, 62454, 62454, out, 134360224, 130251020, 4109204, 0, 0, 1032722, 2011-11-22 12:23:34, , , , 0
The original interface (index 1908) has been showing a continual 8Gb/s
of
inbound delta (bill2-accurate.png), even though if you look at the ifHCInOctets there is actually zero change. And it doesn't show up
in
the interface graphs (bill2-interface.png)
Tue Nov 22 14:27:45 EST 2011 berant@observium:/opt/observium$ date ; snmpget -c Not4SnMpP -v 2c
X.X.X.X
1.3.6.1.2.1.31.1.1.1.6.1908 Tue Nov 22 14:28:01 EST 2011 IF-MIB::ifHCInOctets.1908 = Counter64: 644220606 berant@observium:/opt/observium$ date ; snmpget -c Not4SnMpP -v 2c X.X.X.X 1.3.6.1.2.1.31.1.1.1.6.1908 Tue Nov 22 14:35:04 EST 2011 IF-MIB::ifHCInOctets.1908 = Counter64: 644220606 berant@observium:/opt/observium$ date ; snmpget -c Not4SnMpP -v 2c X.X.X.X 1.3.6.1.2.1.31.1.1.1.6.1908 Tue Nov 22 14:42:39 EST 2011 IF-MIB::ifHCInOctets.1908 = Counter64: 644220606 berant@observium:/opt/observium$ date ; snmpget -c Not4SnMpP -v 2c X.X.X.X 1.3.6.1.2.1.31.1.1.1.6.1908 Tue Nov 22 14:47:39 EST 2011 IF-MIB::ifHCInOctets.1908 = Counter64: 644220606
All of the bills I've seen this issue on have extremely minimal or in
the
above case zero traffic in one direction or another.
Anything else I can provide?
Thanks, Berant
On Wed, Nov 16, 2011 at 9:34 AM, Berant Lemmenes berant@lemmenes.comwrote:
IF-MIB::ifHCOutOctets.1908 = Counter64: 1302403640
IF-MIB::ifHCInOctets.1908 = Counter64: 644218878
On Wed, Nov 16, 2011 at 9:18 AM, Adam Armstrong adama@memetic.org wrote:
Ahh shit, that table doesn't store counters, only deltas.
What is the current SNMP counter for that port?
adam.
On Wed, 16 Nov 2011 09:12:21 -0500, Berant Lemmenes berant@lemmenes.com wrote:
On Wed, Nov 16, 2011 at 8:16 AM, Adam Armstrong adama@memetic.org
wrote:
Same thing, I should imagine. I've never seen this bug present anywhere else.
Is the device being polled quite far away? Or attached on the end
of
some
string?
What is the measurement directly before the spike?
adam.
It's actually diversely routed bailing wire. :) It's about ~300
miles
away
or 6ms as the packet flies.
Looking at the data it looks like in_delta is looking suspicious,
it's
either 0, 64, 896, or some crazy large value during the spike. There is essentially 0 inbound traffic on this interface and barely any outbound, could that play into it?
Here are the values before and at the start of the large blocks of high values:
31, 2011-11-10 16:55:07, 300, 400, 64, 336 31, 2011-11-10 17:00:06, 299, 309525032052119, 309525032051591, 528
31, 2011-11-14 07:40:09, 299, 2608, 64, 2544 31, 2011-11-14 07:45:11, 302, 321074668856640, 321074668848076, 8564
observium mailing list observium@observium.org http://postman.memetic.org/cgi-bin/mailman/listinfo/observium
participants (2)
-
 Adam Armstrong
 -
 Berant Lemmenes