is_file() usage for rrd file existance

Gday folks.
I'm fiddling around with remote RRD storage via rrdcached. Most of the rrdtool stuff is wrapped in includes/rrdtool.inc.php which is wonderful from this perspective.
Not within this include is the usage of is_file() to determine the existence of an rrd file.
In discovery the pattern is something like If( ! is_file( some.rrd ) ) { rrdtool_create ( … )}
In graphing the pattern is something like If ( is_file( some.rrd ) { graph some stuff… }
Would there be any support for moving this usage into a rrdtool_file_exists( ) thin wrapper for is_file ?
This would make it much easier to extended includes/rrdtool.inc.php to support storage of RRD's on remote storage (and potentially distribute over multiple remote storage devices ..)
Thoughts?
I had a quick check for usage of scandir/readdir to determine all the rrd's in a 'device' directory, but this doesn't seem to be a common pattern.
My other evil thought is to use rename_function/override_function to work around this, but it seems very very WRONG.
Cheers, Peter

On 2013-08-28 03:40, Peter Childs wrote:
Gday folks.
I'm fiddling around with remote RRD storage via rrdcached. Most of the rrdtool stuff is wrapped in includes/rrdtool.inc.php which is wonderful from this perspective.
Not within this include is the usage of is_file() to determine the existence of an rrd file.
In discovery the pattern is something like If( ! is_file( some.rrd ) ) { rrdtool_create ( … )}
In graphing the pattern is something like If ( is_file( some.rrd ) { graph some stuff… }
Would there be any support for moving this usage into a rrdtool_file_exists( ) thin wrapper for is_file ?
This would make it much easier to extended includes/rrdtool.inc.php to support storage of RRD's on remote storage (and potentially distribute over multiple remote storage devices ..)
Thoughts?
Why ever would you want to do such a thing?
adam.
On 28/08/13 1:03 PM, "Adam Armstrong" adama@memetic.org wrote:
On 2013-08-28 03:40, Peter Childs wrote:
Gday folks.
I'm fiddling around with remote RRD storage via rrdcached. Most of the rrdtool stuff is wrapped in includes/rrdtool.inc.php which is wonderful from this perspective.
Not within this include is the usage of is_file() to determine the existence of an rrd file.
In discovery the pattern is something like If( ! is_file( some.rrd ) ) { rrdtool_create ( Š )}
In graphing the pattern is something like If ( is_file( some.rrd ) { graph some stuffŠ }
Would there be any support for moving this usage into a rrdtool_file_exists( ) thin wrapper for is_file ?
This would make it much easier to extended includes/rrdtool.inc.php to support storage of RRD's on remote storage (and potentially distribute over multiple remote storage devices ..)
Thoughts?
Why ever would you want to do such a thing?
Scale basically.
If the metrics can be stored on a scalable cluster of 'metric boxes' then the polling load can be scaled over multiple poller nodes, the UI load can be scaled across a set of UI-nodes, etc... (single shared sql)
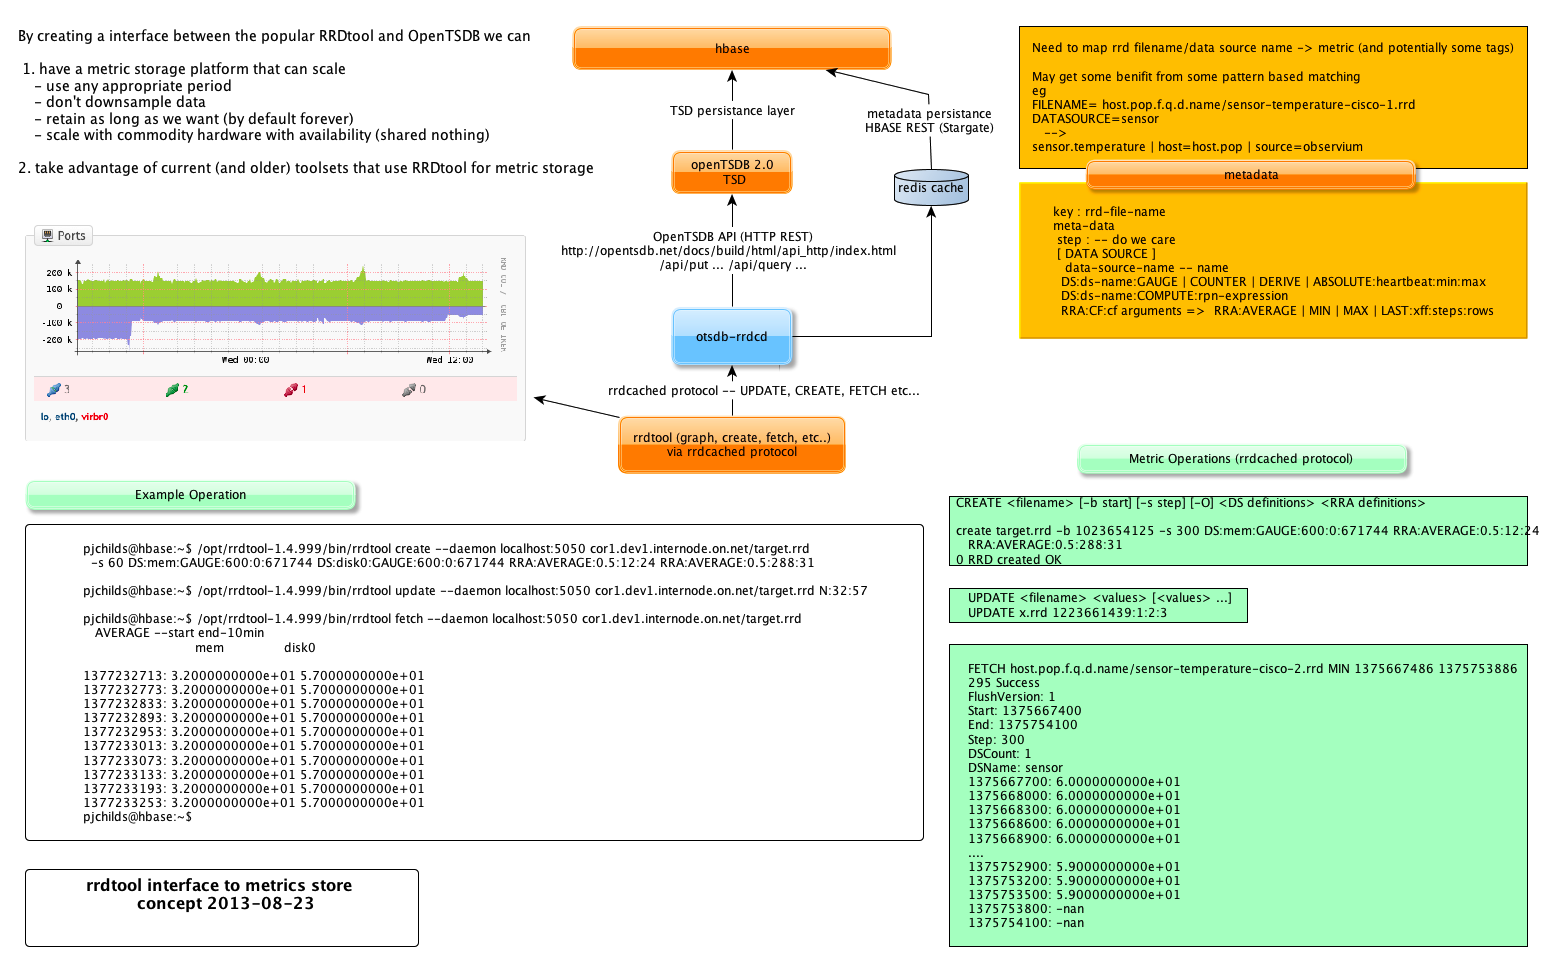
I have some proof-of-concept code that talks 'rrdcached' protocol for CREATE/UPDATE/FETCH and persists the data into OpenTSDB which is ontop of a hbase cluster, so can scale pretty much horizontally (ie more nodes=more metrics).
Having the boxes test for the existence of a file on a local file system sort of breaks this. Could hack around it by 'touching' the file on all the UI nodes when a CREATE is done, but its not very clean.
Cheers, Peter
I have some proof-of-concept code that talks 'rrdcached' protocol for CREATE/UPDATE/FETCH and persists the data into OpenTSDB which is ontop of a hbase cluster, so can scale pretty much horizontally (ie more nodes=more metrics).
Well, that sounds interesting.
How does it work, exactly?
Does rrdtool get/give the data to the "cache", and never look at the disk?
How does the single-node performance compare to rrd?
adam.
On 29/08/13 12:28 AM, "Adam Armstrong" adama@memetic.org wrote:
I have some proof-of-concept code that talks 'rrdcached' protocol for CREATE/UPDATE/FETCH and persists the data into OpenTSDB which is ontop of a hbase cluster, so can scale pretty much horizontally (ie more nodes=more metrics).
Well, that sounds interesting.
How does it work, exactly?
Does rrdtool get/give the data to the "cache", and never look at the disk?
How does the single-node performance compare to rrd?
adam.
Attached my 'concept' diagram. Current rrdtool versions can put 'CREATE' and 'UPDATE' messages via rrdcached (or in this case, a replacement) .. 'trunk' versions have 'FETCH' enabled.
Currently the 'concept' code (which is pretty terrible) can do a simple rrdtool create, update, and fetch, and never touches local disk.
I sort of assume that a single node of this would suck vs rrd storage tuned on disk. I need to create some 'real-world' scenarios and perform some appropriate benchmarking.
Here is an interesting talk from the guys @ box regarding their usage of OpenTSDB, with over 350,000/sec avg updates peaking to 1m/s. I assume they size the metric cluster to suite.
http://www.cloudera.com/content/cloudera/en/resources/library/hbasecon/hbas econ-2013-opentsdb-at-box-video.html
Will have a bit more of a fiddle...
My 'target' is a service provider network with over 3000 active network elements (not going to count the servers), which currently has multiple metric collection/display systems (think cacti, customised mrtg, cricket, collectd) none of which can handle all the elements, and most which do not gather the comprehensive metrics set that observium currently does out-of-the-box.
Interesting.
I was thinking of trying to replace rrdtool with graphite/ceres, but I don't really want to give up the rrdtool graph generation stuff.
I know of a fair few installs which would benefit from a method of scaling the rrdtool storage throughput across multiple hosts.
adam.

On 08/29/2013 08:32 AM, Adam Armstrong wrote:
Attached my 'concept' diagram. Current rrdtool versions can put 'CREATE' and 'UPDATE' messages via rrdcached (or in this case, a replacement) .. 'trunk' versions have 'FETCH' enabled.
Currently the 'concept' code (which is pretty terrible) can do a simple rrdtool create, update, and fetch, and never touches local disk.
I sort of assume that a single node of this would suck vs rrd storage tuned on disk. I need to create some 'real-world' scenarios and perform some appropriate benchmarking.
Here is an interesting talk from the guys @ box regarding their usage of OpenTSDB, with over 350,000/sec avg updates peaking to 1m/s. I assume they size the metric cluster to suite.
http://www.cloudera.com/content/cloudera/en/resources/library/hbasecon/hbas
econ-2013-opentsdb-at-box-video.html
Will have a bit more of a fiddle...
My 'target' is a service provider network with over 3000 active network elements (not going to count the servers), which currently has multiple metric collection/display systems (think cacti, customised mrtg, cricket, collectd) none of which can handle all the elements, and most which do not gather the comprehensive metrics set that observium currently does out-of-the-box.
Interesting.
I was thinking of trying to replace rrdtool with graphite/ceres, but I don't really want to give up the rrdtool graph generation stuff.
I know of a fair few installs which would benefit from a method of scaling the rrdtool storage throughput across multiple hosts.
Simply sharding the rrd directory over multiple NFS servers is not a solution?
(ie rrd/u/ubuntunoob.observium.org..., rrd/s/shisco1.observium.org, etc)
Tom
On 29/08/13 6:37 PM, "Tom Laermans" tom.laermans@powersource.cx wrote:
On 08/29/2013 08:32 AM, Adam Armstrong wrote:
Attached my 'concept' diagram. Current rrdtool versions can put 'CREATE' and 'UPDATE' messages via rrdcached (or in this case, a replacement) .. 'trunk' versions have 'FETCH' enabled.
Currently the 'concept' code (which is pretty terrible) can do a simple rrdtool create, update, and fetch, and never touches local disk.
I sort of assume that a single node of this would suck vs rrd storage tuned on disk. I need to create some 'real-world' scenarios and perform some appropriate benchmarking.
Here is an interesting talk from the guys @ box regarding their usage of OpenTSDB, with over 350,000/sec avg updates peaking to 1m/s. I assume they size the metric cluster to suite.
http://www.cloudera.com/content/cloudera/en/resources/library/hbasecon/h bas
econ-2013-opentsdb-at-box-video.html
Will have a bit more of a fiddle...
My 'target' is a service provider network with over 3000 active network elements (not going to count the servers), which currently has multiple metric collection/display systems (think cacti, customised mrtg, cricket, collectd) none of which can handle all the elements, and most which do not gather the comprehensive metrics set that observium currently does out-of-the-box.
Interesting.
I was thinking of trying to replace rrdtool with graphite/ceres, but I don't really want to give up the rrdtool graph generation stuff.
I know of a fair few installs which would benefit from a method of scaling the rrdtool storage throughput across multiple hosts.
Simply sharding the rrd directory over multiple NFS servers is not a solution?
(ie rrd/u/ubuntunoob.observium.org..., rrd/s/shisco1.observium.org, etc)
Tom
Two interesting points.
Graphite(the web-ui) and carbon/ceres/whisper(the engine/storage) have some of the same characteristics as rrd
. You aggregate stats over time into buckets, you define these retention characteristics
. It doesn't bring you any availability benefits .. So its processes running on boxes with storage, the availability of that is pushed to another layer (ie if you care you need to HA that box/services and use reliable storage, box-level-ha)
. It doesn't scale at its core.. You can shard the metrics over multiple instances, and the web-ui can access multiple instances .. But its not really horizontally scaling, and each of those instances you need to consider your HA again
I had thought about a distributed clustered shared nothing file-system approach(say ceph) (or you could use multiple NFS nodes) .. I guess typically with my experience a NFS box dies and your hosts mounting them all shit themselves. I assume again you need to consider with NFS type thing how you do the HA component of that.. Does each box need RAID, does each box need capacity management, does each box need a HA failover pair, shared NFS on SAN or something...
I also believe that writing a RRD update is moderately IO intensive, as it updates the various aggregated metrics as you do it, so you are not just adding to one point of the file, but you are writing to various places in the file (I could be wrong on this) -- rrdcached is supposed to help with this by collecting multiple writes to the same file so a single write occurs. If you are going to use rrdcached for update caching you could probably have it (or a proxy in front of it) do the sharding across multiple rrdcached servers, and hence you could probably also use rrdcached for 'reads' and throw out the NFS bit ...
My other thought on backing the filesystem onto a shared 'storage pool' (NFS or other) is you still end up with all your metrics in RRD files, and all your data aggregated, you loose it after your retention period (sometimes I think I would like to see aggregated traffic stats back more than 1 year...)
Having the metrics in something that can be queried 'out-of-box' I think opens interesting possibilities for making it easy to get this data from other systems. For example you might want to
. write a monitor that looks at backhaul link percentage utilisation and generates alarms
. Generate a 'php-weathermap' type interface for large networks, or pipe realtime collection data into http://code.google.com/p/webgl-globe/
. Feed 'annotations' into OpenTSDB against bgp-peer-metrics when you generate BGP policy changes, and have a custom view of prefixes send/received per-peer vs peering traffic
I guess from a 'scale' perspective there are issues involving
. Metric storage
. Metric consumption (ie making the graphs/UI/UX)
. Metric collection (the pollers)
If the capability of the platform scales with the addition of 1RU/2RU boxes then that sounds like a good thing.
If none of the 1RU/2RU boxes are single points of failure thats a good thing.
If I don't need expensive boxes (think Vmware vSphere motion licenses, dual-path'd san fabrics, dual-DC 'smart' switching fabrics) this is also a good thing.
If I can drop a poller in london and the US because SNMP runs like crap over long distances (AU->LON=300ms, AU=>LAX=160ms) that is a 'good thing'
If I can put a 'web-ui' instances (or instances behind a load balancer) in any of our NOC follow the Sun locations that might be a 'good thing' as well (not sure that is going to make much of a difference -- one is 200ms from AU, another 80ms from AU ..)
Just some thoughts I am knocking around.
Just thought I would share some of my progress with my work on scaling -- just incase anyone was interested.
( see http://postman.memetic.org/pipermail/observium/attachments/20130829/6208eb9 8/attachment-0001.png for concept diag )
I decided I needed to stop 'theory-ing' around and have a crack.
As such I created a fresh install, stuffed in my code, and bashed and bashed and bashed.
Create/Update ------------- I overloaded rrdtool.inc.php after rrdtool_create to 'touch' the filename on disk (solves that is_file issue for the moment on a single poller).
The CREATE gets sent to the otsdb-rrdcd(shim) .. It stores all the metadata in both redis and hbase, and creates all the metrics in OpenTSDB. No problems here.
Updates are sent to the otsdb-rrdcd which uses the meta-data to map them to metric updates and pushes them into OpenTSDB.
The only thing I noted here is that OpenTSDB does not support 'Unknown' or 'U' or 'NaN' or NULL or any of that .. If you don't have a metric it doesn't write one.
The polling times on all the devices I have tried on both native rrd and otsdb-rrdcd are similar
(like identical .. I assume with a loaded platform the rrd could potentially be slower as it would be disk-whacking and doing all those consolidations and writes all the time)
Fetch(aka Graph) ---------------- A bit trickier.
The data is stored in 'raw' format in OpenTSDB, so when we pull out data from 'type' DERIVE or COUNTER we turn it into a rate (well OpenTSDB does that if we ask nicely).
RRDtool is expecting that the data that is returned is at the highest resolution available for the period (start->end).
I use the RRA data stored during the 'CREATE' to work out the appropriate 'sample' size.
When I query OpenTSDB I ask it to 'downsample' to that sample size, then I create a 2D array and fill it -- my first attempt didn't do this, but giving back 5 minute samples for a 2 year period seems to slow things up a bit... (*cough*)
Interesting things about RRDtool -- when it does a FETCH it doesn't ask for a metric, it expects all the metrics in the RRD.
So that makes for a bit of additional data get/packing. It also appears that if you reference the same RRD for say INOCTECTS and OUTOCTECTS it does 2 fetch operations (even though it got all the DataSource's in the first...)
So I cache any FETCH return for 'TTL=period' (limited to max 1800s).
I needed to put some small modification in a few graph definition files as the 'trunk' version of rrdtool doesn't like some of the formatting (meh)
Ok -- so how does it work.
Simple and small single or couple of item (ie mem usage) data stacks work pretty well. It is a bit slower that the native version on a side-by-side vmware, but performance is acceptable and I assume could benefit from some tuning of my hbase, my code, my deployment or some dedicated fast hardware (or a couple of UI hosts behind a ha-proxy/load-balancer)
The composite traffic graphs are a bit of a different beast
A 3750G 24 port switch 'traffic aggregate' swiggle-line or overview graph pulls in 34 RRD files (the ports). It hits IN and OUT octets, and then it sums them.
On a 3750 with 34 ports ___pre-cached___ example (ie it had a query response ready to go) Otsdb-rrdcd = Runtime 0.21555590629578 secs
RRD = Runtime 0.141361951828 secs OTSDB-GRAPH/UI = 38144 points retrieved, 11654 points plotted in 245ms (Query /#start=2013/09/04-19:42:00&m=sum:5m-avg:rate:observium.INOCTETS{host=sw1.d ev1,port=*}&o=&m=sum:5m-avg:rate:observium.OUTOCTETS{host=sw1.dev1,port=*}& o=axis x1y2&yrange=[0:]&key=out bottom center&wxh=1400x600)
On a 7600 with 88 ports with no pre-cache (ie we haven't accessed the data prior we have) Otsdb-rrdcd = Runtime 30.283470869064 secs RRD = Runtime 0.18092679977417 secs OTSDB-GRAPH/UI = 52272 points retrieved, 28838 points plotted in 670ms. (Query http://.../#start=2013/09/04-19:42:00&m=sum:5m-avg:rate:observium.INOCTE... host=7600.devtest,port=*}&o=&m=sum:5m-avg:rate:observium.OUTOCTETS{host=760 0.devtest,port=*}&o=axis%20x1y2&yrange=[0:]&key=out%20bottom%20center&wxh=1 400x600)
Same 7600 if we are getting 'cached' results from otsdb-rrdcd Otsdb-rrcd = Runtime 0.68489003181458 secs
A 2811 with 3 ports with no pre-cache Otsdb-rrdcd = Runtime 0.70869016647339 secs RRD = Runtime 0.12454390525818 secs OTSDB-GRAPH/UI = 1740 points retrieved, 1110 points plotted in 117ms. (Query http://.../#start=2013/09/04-19:42:00&m=sum:5m-avg:rate:observium.INOCTE... host=tr1.adl6,port=*}&o=&m=sum:5m-avg:rate:observium.OUTOCTETS{host=tr1.adl 6,port=*}&o=axis%20x1y2&yrange=[0:]&key=out%20bottom%20center&wxh=1400x600)
As you can see with multiple ports 'stacked' squiggles can bog down.
If you watching what happens RRDtool does a sequential set of 'FETCH' commands (twice for IN and OUT). Each one needs to complete before the other is started (single thread).
I'm not actually as unhappy about this performance as I was initially (you should have seen it doing 5 minute windows over 1 year *cough*) -- there are only a couple of bits on the UI with large-multi-port devices where it make it 'feel' sucky.
Some things I'm thinking about....
Quick Hax Solution #1 ---------------------
In rrdtool_graph if more than 5 RRD's are referenced in the graph then for all the RRD's greater than the first 5 push a (PRE)'FETCH ..filename... CF start end' command to otsdb-rrdcd, then fire off rrdtool.
So whilst the first 5 queries run sequentially all others are running parallel, and once the first 5 are completed the rest should _probably_ be cached, and hence the overall graph will complete faster.
Quick Hax Solution #2 --------------------- In rrdtool_graph if more than 5 RRD's are referenced in the graph then talk to otsdb-rrdcd and say "run one query for all these metrics for this time period and pack the result sets into single-metric cached objects" .. When that completes then run 'rrdtool graph' (all data is pre-cached)
I sort of like this better than #1, as in theory if (for the 7600 example) you take ~700ms of 'graph fetch, munge, and store in cache time' for the combined dataset (all ports), and the ~700ms of rrdtool time (for pre-cached data) it looks like about 1.4 seconds -- I assume a reasonable hbase deployment might see that drop a little, but if not it beats the pants out of 30 seconds :)
Quick Hax Solution #3 --------------------- If the runtime of rrdtool_graph exceeds 5 seconds just kill it and draw a 'Under Construction' graph, or just don't draw graphs hitting more than 5/10 ports.rrd files
Probably Better Solution #1 --------------------------- Have some AJAX graph foo (#1) pulling the metric(s) and drawing the UI graphs.
There are obviously some challenges here since the graph definitions are rrd-tool specific, but not beyond possible (even if just starting with multi-stacked traffic).
There are some probably advantages as well such as . Only getting the metrics you ask for (FETCH makes you get all the DataSources in the RRD) . Being able to determine the 'downsample' size based on the target size of the graph -- or not down sample at all for say 24h graphs (ie compute the resolution of 1px in 'time' and use that for lower AJAX data transfer) . Having some 'interactive' foo (such as point identification ... ie at what time was that spike and what was its real value.. (#2)) . Possible to perhaps have some other 'interactive' foo (like pan left.. Zoom in, zoom out, etc...)
#1) http://code.shutterstock.com/rickshaw/ #2) http://code.shutterstock.com/rickshaw/examples/lines.html
Anyway just thought I would check in.
Every day I stumble on something new in the UI and I smile -- nice work guys.
Cheers, Peter
participants (3)
-
 Adam Armstrong
 -
 Peter Childs
 -
 Tom Laermans