Error drawing graph (can not parse an empty rpn expression)

I just upgraded from 19.8 to 20.9 CE. In both I've been having the same problem: Everything works as expected, except two devices (of 19) produce a big pink box instead of a chart for the "Ports" widget on the Overview page for the devices. The chart is titled "Error Drawing Graph". Other similar devices (same OS version, etc.) all show a normal-looking chart in the same place. The devices are "SunOS <hostname> 5.11 11.4.25.75.3 sun4v". Most other devices of the same version work, just not two of them.
When I click on the chart, I get the Ports page and a bigger version of the same chart. Selecting "RRD Command" produces this below the pink box:
Description Device total traffic in bits/sec.
Performance & Output RRDTool Output: ERROR: can not parse an empty rpn expression RRDtool Runtime: 0.011s | Total time: 0.012s
RRDTool Command /usr/bin/rrdtool graph /tmp/DZSTkOrAZmZQeckq.png -g -Y --alt-autoscale --rigid --start 1603133061 --end 1603219461 --width 1152 --height 300 -c BACK#EEEEEE00 -c SHADEA#EEEEEE00 -c SHADEB#EEEEEE00 -c FONT#000000 -c CANVAS#FFFFFF00 -c GRID#a5a5a5 -c MGRID#FF9999 -c FRAME#5e5e5e -c ARROW#5e5e5e -R normal --font LEGEND:8:'DroidSansMono,DejaVuSansMono' --font AXIS:7:'DroidSansMono,DejaVuSansMono' --font-render-mode normal -E CDEF:inB= CDEF:outB= CDEF:octets=inB,outB,+ CDEF:doutB=outB,-1,* CDEF:inbits=inB,8,* CDEF:outbits=outB,8,* CDEF:bits=inbits,outbits,+ CDEF:doutbits=doutB,8,* VDEF:95thin=inbits,95,PERCENT VDEF:95thout=outbits,95,PERCENT CDEF:pout_tmp=doutbits,-1,* VDEF:dpout_tmp=pout_tmp,95,PERCENT CDEF:dpout_tmp2=doutbits,doutbits,-,dpout_tmp,-1,*,+ VDEF:d95thout=dpout_tmp2,FIRST VDEF:totin=inB,TOTAL VDEF:avein=inbits,AVERAGE VDEF:totout=outB,TOTAL VDEF:aveout=outbits,AVERAGE VDEF:tot=octets,TOTAL COMMENT:' \l' HRULE:999999999999999#FFFFFF:'Total Rx' GPRINT:inbits:LAST:%6.2lf%s GPRINT:inbits:AVERAGE:%6.2lf%s GPRINT:inbits:MIN:%6.2lf%s GPRINT:inbits:MAX:%6.2lf%s GPRINT:totin:%6.2lf%sB COMMENT:'\l' HRULE:999999999999999#FFFFFF:' Tx' GPRINT:outbits:LAST:%6.2lf%s GPRINT:outbits:AVERAGE:%6.2lf%s GPRINT:outbits:MIN:%6.2lf%s GPRINT:outbits:MAX:%6.2lf%s GPRINT:totout:%6.2lf%sB COMMENT:'\l' HRULE:999999999999999#FFFFFF:' Agg' GPRINT:bits:LAST:%6.2lf%s GPRINT:bits:AVERAGE:%6.2lf%s GPRINT:bits:MIN:%6.2lf%s GPRINT:bits:MAX:%6.2lf%s GPRINT:tot:%6.2lf%sB COMMENT:'\l' HRULE:0#999999
RRDTool Files Used /opt/observium/rrd/<hostname>/port-2.rrd /opt/observium/rrd/<hostname>/port-1.rrd
Would someone please give me a place to start looking for the problem?
Thanks!

This rrd definition doesn't actually use any rrds, which suggests the rrds don't exist.
Adam.
From: observium observium-bounces@observium.org On Behalf Of McGregor, Kevin via observium Sent: 20 October 2020 19:55 To: observium@observium.org Cc: McGregor, Kevin KMcGregor@winnipeg.ca Subject: [Observium] Error drawing graph (can not parse an empty rpn expression)
I just upgraded from 19.8 to 20.9 CE. In both I've been having the same problem: Everything works as expected, except two devices (of 19) produce a big pink box instead of a chart for the "Ports" widget on the Overview page for the devices. The chart is titled "Error Drawing Graph". Other similar devices (same OS version, etc.) all show a normal-looking chart in the same place. The devices are "SunOS <hostname> 5.11 11.4.25.75.3 sun4v". Most other devices of the same version work, just not two of them.
When I click on the chart, I get the Ports page and a bigger version of the same chart. Selecting "RRD Command" produces this below the pink box:
Description
Device total traffic in bits/sec.
Performance & Output
RRDTool Output: ERROR: can not parse an empty rpn expression
RRDtool Runtime: 0.011s | Total time: 0.012s
RRDTool Command
/usr/bin/rrdtool graph /tmp/DZSTkOrAZmZQeckq.png -g -Y --alt-autoscale --rigid --start 1603133061 --end 1603219461 --width 1152 --height 300 -c BACK#EEEEEE00 -c SHADEA#EEEEEE00 -c SHADEB#EEEEEE00 -c FONT#000000 -c CANVAS#FFFFFF00 -c GRID#a5a5a5 -c MGRID#FF9999 -c FRAME#5e5e5e -c ARROW#5e5e5e -R normal --font LEGEND:8:'DroidSansMono,DejaVuSansMono' --font AXIS:7:'DroidSansMono,DejaVuSansMono' --font-render-mode normal -E CDEF:inB= CDEF:outB= CDEF:octets=inB,outB,+ CDEF:doutB=outB,-1,* CDEF:inbits=inB,8,* CDEF:outbits=outB,8,* CDEF:bits=inbits,outbits,+ CDEF:doutbits=doutB,8,* VDEF:95thin=inbits,95,PERCENT VDEF:95thout=outbits,95,PERCENT CDEF:pout_tmp=doutbits,-1,* VDEF:dpout_tmp=pout_tmp,95,PERCENT CDEF:dpout_tmp2=doutbits,doutbits,-,dpout_tmp,-1,*,+ VDEF:d95thout=dpout_tmp2,FIRST VDEF:totin=inB,TOTAL VDEF:avein=inbits,AVERAGE VDEF:totout=outB,TOTAL VDEF:aveout=outbits,AVERAGE VDEF:tot=octets,TOTAL COMMENT:' \l' HRULE:999999999999999#FFFFFF:'Total Rx' GPRINT:inbits:LAST:%6.2lf%s GPRINT:inbits:AVERAGE:%6.2lf%s GPRINT:inbits:MIN:%6.2lf%s GPRINT:inbits:MAX:%6.2lf%s GPRINT:totin:%6.2lf%sB COMMENT:'\l' HRULE:999999999999999#FFFFFF:' Tx' GPRINT:outbits:LAST:%6.2lf%s GPRINT:outbits:AVERAGE:%6.2lf%s GPRINT:outbits:MIN:%6.2lf%s GPRINT:outbits:MAX:%6.2lf%s GPRINT:totout:%6.2lf%sB COMMENT:'\l' HRULE:999999999999999#FFFFFF:' Agg' GPRINT:bits:LAST:%6.2lf%s GPRINT:bits:AVERAGE:%6.2lf%s GPRINT:bits:MIN:%6.2lf%s GPRINT:bits:MAX:%6.2lf%s GPRINT:tot:%6.2lf%sB COMMENT:'\l' HRULE:0#999999
RRDTool Files Used
/opt/observium/rrd/<hostname>/port-2.rrd
/opt/observium/rrd/<hostname>/port-1.rrd
Would someone please give me a place to start looking for the problem?
Thanks!
The .rrd files exist in the same directory as all of the other rrds for that host, and they have the same permissions as all of the others, and they are updated (as evidenced by the rrd file timestamp) every five minutes.
Is there a way to verify the rrd files in some way? Or just blow these two away and recreate them?
Kevin McGregor
From: Adam Armstrong adama@observium.org Sent: October 20, 2020 14:02 To: 'Observium' observium@observium.org Subject: Re: [Observium] Error drawing graph (can not parse an empty rpn expression)
This rrd definition doesn't actually use any rrds, which suggests the rrds don't exist.
Adam.
From: observium <observium-bounces@observium.orgmailto:observium-bounces@observium.org> On Behalf Of McGregor, Kevin via observium Sent: 20 October 2020 19:55 To: observium@observium.orgmailto:observium@observium.org Cc: McGregor, Kevin <KMcGregor@winnipeg.camailto:KMcGregor@winnipeg.ca> Subject: [Observium] Error drawing graph (can not parse an empty rpn expression)
I just upgraded from 19.8 to 20.9 CE. In both I've been having the same problem: Everything works as expected, except two devices (of 19) produce a big pink box instead of a chart for the "Ports" widget on the Overview page for the devices. The chart is titled "Error Drawing Graph". Other similar devices (same OS version, etc.) all show a normal-looking chart in the same place. The devices are "SunOS <hostname> 5.11 11.4.25.75.3 sun4v". Most other devices of the same version work, just not two of them.
When I click on the chart, I get the Ports page and a bigger version of the same chart. Selecting "RRD Command" produces this below the pink box:
Description Device total traffic in bits/sec.
Performance & Output RRDTool Output: ERROR: can not parse an empty rpn expression RRDtool Runtime: 0.011s | Total time: 0.012s
RRDTool Command /usr/bin/rrdtool graph /tmp/DZSTkOrAZmZQeckq.png -g -Y --alt-autoscale --rigid --start 1603133061 --end 1603219461 --width 1152 --height 300 -c BACK#EEEEEE00 -c SHADEA#EEEEEE00 -c SHADEB#EEEEEE00 -c FONT#000000 -c CANVAS#FFFFFF00 -c GRID#a5a5a5 -c MGRID#FF9999 -c FRAME#5e5e5e -c ARROW#5e5e5e -R normal --font LEGEND:8:'DroidSansMono,DejaVuSansMono' --font AXIS:7:'DroidSansMono,DejaVuSansMono' --font-render-mode normal -E CDEF:inB= CDEF:outB= CDEF:octets=inB,outB,+ CDEF:doutB=outB,-1,* CDEF:inbits=inB,8,* CDEF:outbits=outB,8,* CDEF:bits=inbits,outbits,+ CDEF:doutbits=doutB,8,* VDEF:95thin=inbits,95,PERCENT VDEF:95thout=outbits,95,PERCENT CDEF:pout_tmp=doutbits,-1,* VDEF:dpout_tmp=pout_tmp,95,PERCENT CDEF:dpout_tmp2=doutbits,doutbits,-,dpout_tmp,-1,*,+ VDEF:d95thout=dpout_tmp2,FIRST VDEF:totin=inB,TOTAL VDEF:avein=inbits,AVERAGE VDEF:totout=outB,TOTAL VDEF:aveout=outbits,AVERAGE VDEF:tot=octets,TOTAL COMMENT:' \l' HRULE:999999999999999#FFFFFF:'Total Rx' GPRINT:inbits:LAST:%6.2lf%s GPRINT:inbits:AVERAGE:%6.2lf%s GPRINT:inbits:MIN:%6.2lf%s GPRINT:inbits:MAX:%6.2lf%s GPRINT:totin:%6.2lf%sB COMMENT:'\l' HRULE:999999999999999#FFFFFF:' Tx' GPRINT:outbits:LAST:%6.2lf%s GPRINT:outbits:AVERAGE:%6.2lf%s GPRINT:outbits:MIN:%6.2lf%s GPRINT:outbits:MAX:%6.2lf%s GPRINT:totout:%6.2lf%sB COMMENT:'\l' HRULE:999999999999999#FFFFFF:' Agg' GPRINT:bits:LAST:%6.2lf%s GPRINT:bits:AVERAGE:%6.2lf%s GPRINT:bits:MIN:%6.2lf%s GPRINT:bits:MAX:%6.2lf%s GPRINT:tot:%6.2lf%sB COMMENT:'\l' HRULE:0#999999
RRDTool Files Used /opt/observium/rrd/<hostname>/port-2.rrd /opt/observium/rrd/<hostname>/port-1.rrd
Would someone please give me a place to start looking for the problem?
Thanks!
I'll add that I have just deleted one of the problem devices (including the RRDs) and re-added the device, and the graph is still busted.
Kevin McGregor
From: McGregor, Kevin Sent: October 21, 2020 08:02 To: 'Adam Armstrong' adama@observium.org; 'Observium' observium@observium.org Subject: RE: [Observium] Error drawing graph (can not parse an empty rpn expression)
The .rrd files exist in the same directory as all of the other rrds for that host, and they have the same permissions as all of the others, and they are updated (as evidenced by the rrd file timestamp) every five minutes.
Is there a way to verify the rrd files in some way? Or just blow these two away and recreate them?
Kevin McGregor
From: Adam Armstrong <adama@observium.orgmailto:adama@observium.org> Sent: October 20, 2020 14:02 To: 'Observium' <observium@observium.orgmailto:observium@observium.org> Subject: Re: [Observium] Error drawing graph (can not parse an empty rpn expression)
This rrd definition doesn't actually use any rrds, which suggests the rrds don't exist.
Adam.
From: observium <observium-bounces@observium.orgmailto:observium-bounces@observium.org> On Behalf Of McGregor, Kevin via observium Sent: 20 October 2020 19:55 To: observium@observium.orgmailto:observium@observium.org Cc: McGregor, Kevin <KMcGregor@winnipeg.camailto:KMcGregor@winnipeg.ca> Subject: [Observium] Error drawing graph (can not parse an empty rpn expression)
I just upgraded from 19.8 to 20.9 CE. In both I've been having the same problem: Everything works as expected, except two devices (of 19) produce a big pink box instead of a chart for the "Ports" widget on the Overview page for the devices. The chart is titled "Error Drawing Graph". Other similar devices (same OS version, etc.) all show a normal-looking chart in the same place. The devices are "SunOS <hostname> 5.11 11.4.25.75.3 sun4v". Most other devices of the same version work, just not two of them.
When I click on the chart, I get the Ports page and a bigger version of the same chart. Selecting "RRD Command" produces this below the pink box:
Description Device total traffic in bits/sec.
Performance & Output RRDTool Output: ERROR: can not parse an empty rpn expression RRDtool Runtime: 0.011s | Total time: 0.012s
RRDTool Command /usr/bin/rrdtool graph /tmp/DZSTkOrAZmZQeckq.png -g -Y --alt-autoscale --rigid --start 1603133061 --end 1603219461 --width 1152 --height 300 -c BACK#EEEEEE00 -c SHADEA#EEEEEE00 -c SHADEB#EEEEEE00 -c FONT#000000 -c CANVAS#FFFFFF00 -c GRID#a5a5a5 -c MGRID#FF9999 -c FRAME#5e5e5e -c ARROW#5e5e5e -R normal --font LEGEND:8:'DroidSansMono,DejaVuSansMono' --font AXIS:7:'DroidSansMono,DejaVuSansMono' --font-render-mode normal -E CDEF:inB= CDEF:outB= CDEF:octets=inB,outB,+ CDEF:doutB=outB,-1,* CDEF:inbits=inB,8,* CDEF:outbits=outB,8,* CDEF:bits=inbits,outbits,+ CDEF:doutbits=doutB,8,* VDEF:95thin=inbits,95,PERCENT VDEF:95thout=outbits,95,PERCENT CDEF:pout_tmp=doutbits,-1,* VDEF:dpout_tmp=pout_tmp,95,PERCENT CDEF:dpout_tmp2=doutbits,doutbits,-,dpout_tmp,-1,*,+ VDEF:d95thout=dpout_tmp2,FIRST VDEF:totin=inB,TOTAL VDEF:avein=inbits,AVERAGE VDEF:totout=outB,TOTAL VDEF:aveout=outbits,AVERAGE VDEF:tot=octets,TOTAL COMMENT:' \l' HRULE:999999999999999#FFFFFF:'Total Rx' GPRINT:inbits:LAST:%6.2lf%s GPRINT:inbits:AVERAGE:%6.2lf%s GPRINT:inbits:MIN:%6.2lf%s GPRINT:inbits:MAX:%6.2lf%s GPRINT:totin:%6.2lf%sB COMMENT:'\l' HRULE:999999999999999#FFFFFF:' Tx' GPRINT:outbits:LAST:%6.2lf%s GPRINT:outbits:AVERAGE:%6.2lf%s GPRINT:outbits:MIN:%6.2lf%s GPRINT:outbits:MAX:%6.2lf%s GPRINT:totout:%6.2lf%sB COMMENT:'\l' HRULE:999999999999999#FFFFFF:' Agg' GPRINT:bits:LAST:%6.2lf%s GPRINT:bits:AVERAGE:%6.2lf%s GPRINT:bits:MIN:%6.2lf%s GPRINT:bits:MAX:%6.2lf%s GPRINT:tot:%6.2lf%sB COMMENT:'\l' HRULE:0#999999
RRDTool Files Used /opt/observium/rrd/<hostname>/port-2.rrd /opt/observium/rrd/<hostname>/port-1.rrd
Would someone please give me a place to start looking for the problem?
Thanks!
Hmm.
You can open the graph URL in a separate tab and add &debug=1 at the end to perhaps get some more information.
The device_bits format builds a list of ports and then passes it to the type generic_multi_separated which doesn't check if the rrd exists.
The list of rrds used is generated in the device_bits type, so it's difficult to guess what's going on here.
Adam.
From: McGregor, Kevin KMcGregor@winnipeg.ca Sent: 21 October 2020 14:02 To: Adam Armstrong adama@observium.org; 'Observium' observium@observium.org Subject: RE: [Observium] Error drawing graph (can not parse an empty rpn expression)
The .rrd files exist in the same directory as all of the other rrds for that host, and they have the same permissions as all of the others, and they are updated (as evidenced by the rrd file timestamp) every five minutes.
Is there a way to verify the rrd files in some way? Or just blow these two away and recreate them?
Kevin McGregor
From: Adam Armstrong <adama@observium.org mailto:adama@observium.org > Sent: October 20, 2020 14:02 To: 'Observium' <observium@observium.org mailto:observium@observium.org > Subject: Re: [Observium] Error drawing graph (can not parse an empty rpn expression)
This rrd definition doesn't actually use any rrds, which suggests the rrds don't exist.
Adam.
From: observium <observium-bounces@observium.org mailto:observium-bounces@observium.org > On Behalf Of McGregor, Kevin via observium Sent: 20 October 2020 19:55 To: observium@observium.org mailto:observium@observium.org Cc: McGregor, Kevin <KMcGregor@winnipeg.ca mailto:KMcGregor@winnipeg.ca > Subject: [Observium] Error drawing graph (can not parse an empty rpn expression)
I just upgraded from 19.8 to 20.9 CE. In both I've been having the same problem: Everything works as expected, except two devices (of 19) produce a big pink box instead of a chart for the "Ports" widget on the Overview page for the devices. The chart is titled "Error Drawing Graph". Other similar devices (same OS version, etc.) all show a normal-looking chart in the same place. The devices are "SunOS <hostname> 5.11 11.4.25.75.3 sun4v". Most other devices of the same version work, just not two of them.
When I click on the chart, I get the Ports page and a bigger version of the same chart. Selecting "RRD Command" produces this below the pink box:
Description
Device total traffic in bits/sec.
Performance & Output
RRDTool Output: ERROR: can not parse an empty rpn expression
RRDtool Runtime: 0.011s | Total time: 0.012s
RRDTool Command
/usr/bin/rrdtool graph /tmp/DZSTkOrAZmZQeckq.png -g -Y --alt-autoscale --rigid --start 1603133061 --end 1603219461 --width 1152 --height 300 -c BACK#EEEEEE00 -c SHADEA#EEEEEE00 -c SHADEB#EEEEEE00 -c FONT#000000 -c CANVAS#FFFFFF00 -c GRID#a5a5a5 -c MGRID#FF9999 -c FRAME#5e5e5e -c ARROW#5e5e5e -R normal --font LEGEND:8:'DroidSansMono,DejaVuSansMono' --font AXIS:7:'DroidSansMono,DejaVuSansMono' --font-render-mode normal -E CDEF:inB= CDEF:outB= CDEF:octets=inB,outB,+ CDEF:doutB=outB,-1,* CDEF:inbits=inB,8,* CDEF:outbits=outB,8,* CDEF:bits=inbits,outbits,+ CDEF:doutbits=doutB,8,* VDEF:95thin=inbits,95,PERCENT VDEF:95thout=outbits,95,PERCENT CDEF:pout_tmp=doutbits,-1,* VDEF:dpout_tmp=pout_tmp,95,PERCENT CDEF:dpout_tmp2=doutbits,doutbits,-,dpout_tmp,-1,*,+ VDEF:d95thout=dpout_tmp2,FIRST VDEF:totin=inB,TOTAL VDEF:avein=inbits,AVERAGE VDEF:totout=outB,TOTAL VDEF:aveout=outbits,AVERAGE VDEF:tot=octets,TOTAL COMMENT:' \l' HRULE:999999999999999#FFFFFF:'Total Rx' GPRINT:inbits:LAST:%6.2lf%s GPRINT:inbits:AVERAGE:%6.2lf%s GPRINT:inbits:MIN:%6.2lf%s GPRINT:inbits:MAX:%6.2lf%s GPRINT:totin:%6.2lf%sB COMMENT:'\l' HRULE:999999999999999#FFFFFF:' Tx' GPRINT:outbits:LAST:%6.2lf%s GPRINT:outbits:AVERAGE:%6.2lf%s GPRINT:outbits:MIN:%6.2lf%s GPRINT:outbits:MAX:%6.2lf%s GPRINT:totout:%6.2lf%sB COMMENT:'\l' HRULE:999999999999999#FFFFFF:' Agg' GPRINT:bits:LAST:%6.2lf%s GPRINT:bits:AVERAGE:%6.2lf%s GPRINT:bits:MIN:%6.2lf%s GPRINT:bits:MAX:%6.2lf%s GPRINT:tot:%6.2lf%sB COMMENT:'\l' HRULE:0#999999
RRDTool Files Used
/opt/observium/rrd/<hostname>/port-2.rrd
/opt/observium/rrd/<hostname>/port-1.rrd
Would someone please give me a place to start looking for the problem?
Thanks!
There was a long list of the (probably) expected SELECT statements, and this:
$graphtypeincludes/graphs/graph.inc.php:47array(
0=>device_bitstype=>device1=>devicesubtype=>bits2=>bits)
SELECT * FROM `ports` WHERE `device_id` = '21' AND `deleted` != '1' ORDER BY (ifInOctets_rate + ifOutOctets_rate) DESC
[Port (id=62, ifIndex=2) ignored by ifDescr=vlan312] [Port (id=61, ifIndex=1) ignored by ifType=softwareLoopback]
RRD CMD[%ygraph /tmp/3QGGle3IXtZrnQcf.png -g -Y --alt-autoscale --rigid --start 1603222113 --end 1603308513 --width 1152 --height 300 -c BACK#EEEEEE00 -c SHADEA#EEEEEE00 -c SHADEB#EEEEEE00 -c FONT#000000 -c CANVAS#FFFFFF00 -c GRID#a5a5a5 -c MGRID#FF9999 -c FRAME#5e5e5e -c ARROW#5e5e5e -R normal --font LEGEND:8:'DroidSansMono,DejaVuSansMono' --font AXIS:7:'DroidSansMono,DejaVuSansMono' --font-render-mode normal -E CDEF:inB= CDEF:outB= CDEF:octets=inB,outB,+ CDEF:doutB=outB,-1,* CDEF:inbits=inB,8,* CDEF:outbits=outB,8,* CDEF:bits=inbits,outbits,+ CDEF:doutbits=doutB,8,* VDEF:95thin=inbits,95,PERCENT VDEF:95thout=outbits,95,PERCENT CDEF:pout_tmp=doutbits,-1,* VDEF:dpout_tmp=pout_tmp,95,PERCENT CDEF:dpout_tmp2=doutbits,doutbits,-,dpout_tmp,-1,*,+ VDEF:d95thout=dpout_tmp2,FIRST VDEF:totin=inB,TOTAL VDEF:avein=inbits,AVERAGE VDEF:totout=outB,TOTAL VDEF:aveout=outbits,AVERAGE VDEF:tot=octets,TOTAL COMMENT:' \l' HRULE:999999999999999#FFFFFF:'Total Rx' GPRINT:inbits:LAST:%6.2lf%s GPRINT:inbits:AVERAGE:%6.2lf%s GPRINT:inbits:MIN:%6.2lf%s GPRINT:inbits:MAX:%6.2lf%s GPRINT:totin:%6.2lf%sB COMMENT:'\l' HRULE:999999999999999#FFFFFF:' Tx' GPRINT:outbits:LAST:%6.2lf%s GPRINT:outbits:AVERAGE:%6.2lf%s GPRINT:outbits:MIN:%6.2lf%s GPRINT:outbits:MAX:%6.2lf%s GPRINT:totout:%6.2lf%sB COMMENT:'\l' HRULE:999999999999999#FFFFFF:' Agg' GPRINT:bits:LAST:%6.2lf%s GPRINT:bits:AVERAGE:%6.2lf%s GPRINT:bits:MIN:%6.2lf%s GPRINT:bits:MAX:%6.2lf%s GPRINT:tot:%6.2lf%sB COMMENT:'\l' HRULE:0#999999%n]
RRD RUNTIME[0.0112s] RRD STDOUT[ERROR: can not parse an empty rpn expression] RRD_STATUS[FALSE]
Nothing else stood out for me. I can include all of the SELECT statements if that would be helpful.
Kevin McGregor
From: observium observium-bounces@observium.org On Behalf Of Adam Armstrong via observium Sent: October 21, 2020 13:07 To: observium@observium.org Cc: Adam Armstrong adama@observium.org Subject: Re: [Observium] Error drawing graph (can not parse an empty rpn expression)
** EXTERNAL EMAIL: USE CAUTION **
Hmm.
You can open the graph URL in a separate tab and add &debug=1 at the end to perhaps get some more information.
The device_bits format builds a list of ports and then passes it to the type generic_multi_separated which doesn't check if the rrd exists.
The list of rrds used is generated in the device_bits type, so it's difficult to guess what's going on here.
Adam.
From: McGregor, Kevin <KMcGregor@winnipeg.camailto:KMcGregor@winnipeg.ca> Sent: 21 October 2020 14:02 To: Adam Armstrong <adama@observium.orgmailto:adama@observium.org>; 'Observium' <observium@observium.orgmailto:observium@observium.org> Subject: RE: [Observium] Error drawing graph (can not parse an empty rpn expression)
The .rrd files exist in the same directory as all of the other rrds for that host, and they have the same permissions as all of the others, and they are updated (as evidenced by the rrd file timestamp) every five minutes.
Is there a way to verify the rrd files in some way? Or just blow these two away and recreate them?
Kevin McGregor
From: Adam Armstrong <adama@observium.orgmailto:adama@observium.org> Sent: October 20, 2020 14:02 To: 'Observium' <observium@observium.orgmailto:observium@observium.org> Subject: Re: [Observium] Error drawing graph (can not parse an empty rpn expression)
This rrd definition doesn't actually use any rrds, which suggests the rrds don't exist.
Adam.
From: observium <observium-bounces@observium.orgmailto:observium-bounces@observium.org> On Behalf Of McGregor, Kevin via observium Sent: 20 October 2020 19:55 To: observium@observium.orgmailto:observium@observium.org Cc: McGregor, Kevin <KMcGregor@winnipeg.camailto:KMcGregor@winnipeg.ca> Subject: [Observium] Error drawing graph (can not parse an empty rpn expression)
I just upgraded from 19.8 to 20.9 CE. In both I've been having the same problem: Everything works as expected, except two devices (of 19) produce a big pink box instead of a chart for the "Ports" widget on the Overview page for the devices. The chart is titled "Error Drawing Graph". Other similar devices (same OS version, etc.) all show a normal-looking chart in the same place. The devices are "SunOS <hostname> 5.11 11.4.25.75.3 sun4v". Most other devices of the same version work, just not two of them.
When I click on the chart, I get the Ports page and a bigger version of the same chart. Selecting "RRD Command" produces this below the pink box:
Description Device total traffic in bits/sec.
Performance & Output RRDTool Output: ERROR: can not parse an empty rpn expression RRDtool Runtime: 0.011s | Total time: 0.012s
RRDTool Command /usr/bin/rrdtool graph /tmp/DZSTkOrAZmZQeckq.png -g -Y --alt-autoscale --rigid --start 1603133061 --end 1603219461 --width 1152 --height 300 -c BACK#EEEEEE00 -c SHADEA#EEEEEE00 -c SHADEB#EEEEEE00 -c FONT#000000 -c CANVAS#FFFFFF00 -c GRID#a5a5a5 -c MGRID#FF9999 -c FRAME#5e5e5e -c ARROW#5e5e5e -R normal --font LEGEND:8:'DroidSansMono,DejaVuSansMono' --font AXIS:7:'DroidSansMono,DejaVuSansMono' --font-render-mode normal -E CDEF:inB= CDEF:outB= CDEF:octets=inB,outB,+ CDEF:doutB=outB,-1,* CDEF:inbits=inB,8,* CDEF:outbits=outB,8,* CDEF:bits=inbits,outbits,+ CDEF:doutbits=doutB,8,* VDEF:95thin=inbits,95,PERCENT VDEF:95thout=outbits,95,PERCENT CDEF:pout_tmp=doutbits,-1,* VDEF:dpout_tmp=pout_tmp,95,PERCENT CDEF:dpout_tmp2=doutbits,doutbits,-,dpout_tmp,-1,*,+ VDEF:d95thout=dpout_tmp2,FIRST VDEF:totin=inB,TOTAL VDEF:avein=inbits,AVERAGE VDEF:totout=outB,TOTAL VDEF:aveout=outbits,AVERAGE VDEF:tot=octets,TOTAL COMMENT:' \l' HRULE:999999999999999#FFFFFF:'Total Rx' GPRINT:inbits:LAST:%6.2lf%s GPRINT:inbits:AVERAGE:%6.2lf%s GPRINT:inbits:MIN:%6.2lf%s GPRINT:inbits:MAX:%6.2lf%s GPRINT:totin:%6.2lf%sB COMMENT:'\l' HRULE:999999999999999#FFFFFF:' Tx' GPRINT:outbits:LAST:%6.2lf%s GPRINT:outbits:AVERAGE:%6.2lf%s GPRINT:outbits:MIN:%6.2lf%s GPRINT:outbits:MAX:%6.2lf%s GPRINT:totout:%6.2lf%sB COMMENT:'\l' HRULE:999999999999999#FFFFFF:' Agg' GPRINT:bits:LAST:%6.2lf%s GPRINT:bits:AVERAGE:%6.2lf%s GPRINT:bits:MIN:%6.2lf%s GPRINT:bits:MAX:%6.2lf%s GPRINT:tot:%6.2lf%sB COMMENT:'\l' HRULE:0#999999
RRDTool Files Used /opt/observium/rrd/<hostname>/port-2.rrd /opt/observium/rrd/<hostname>/port-1.rrd
Would someone please give me a place to start looking for the problem?
Thanks!

Kevin,
Are vlan312 and lo the only 2 interfaces on the device?
Tom
On 2020-10-21 21:36, McGregor, Kevin via observium wrote:
There was a long list of the (probably) expected SELECT statements, and this:
/> /$graphtypeincludes/graphs/graph.inc.php:47array/(/
0/=>/device_bitstype/=>/device1/=>/devicesubtype/=>/bits2/=>/bits/)/
**
*SELECT** *FROM* `ports`*WHERE* `device_id`= '21'*AND* `deleted`!= '1'*ORDER BY* (ifInOctets_rate+ ifOutOctets_rate) *DESC*
[Port (id=62, ifIndex=2) ignored by ifDescr=vlan312]
[Port (id=61, ifIndex=1) ignored by ifType=softwareLoopback]
RRD CMD[%ygraph /tmp/3QGGle3IXtZrnQcf.png -g -Y --alt-autoscale --rigid --start 1603222113 --end 1603308513 --width 1152 --height 300 -c BACK#EEEEEE00 -c SHADEA#EEEEEE00 -c SHADEB#EEEEEE00 -c FONT#000000 -c CANVAS#FFFFFF00 -c GRID#a5a5a5 -c MGRID#FF9999 -c FRAME#5e5e5e -c ARROW#5e5e5e -R normal --font LEGEND:8:'DroidSansMono,DejaVuSansMono' --font AXIS:7:'DroidSansMono,DejaVuSansMono' --font-render-mode normal -E CDEF:inB= CDEF:outB= CDEF:octets=inB,outB,+ CDEF:doutB=outB,-1,* CDEF:inbits=inB,8,* CDEF:outbits=outB,8,* CDEF:bits=inbits,outbits,+ CDEF:doutbits=doutB,8,* VDEF:95thin=inbits,95,PERCENT VDEF:95thout=outbits,95,PERCENT CDEF:pout_tmp=doutbits,-1,* VDEF:dpout_tmp=pout_tmp,95,PERCENT CDEF:dpout_tmp2=doutbits,doutbits,-,dpout_tmp,-1,*,+ VDEF:d95thout=dpout_tmp2,FIRST VDEF:totin=inB,TOTAL VDEF:avein=inbits,AVERAGE VDEF:totout=outB,TOTAL VDEF:aveout=outbits,AVERAGE VDEF:tot=octets,TOTAL COMMENT:' \l' HRULE:999999999999999#FFFFFF:'Total Rx' GPRINT:inbits:LAST:%6.2lf%s GPRINT:inbits:AVERAGE:%6.2lf%s GPRINT:inbits:MIN:%6.2lf%s GPRINT:inbits:MAX:%6.2lf%s GPRINT:totin:%6.2lf%sB COMMENT:'\l' HRULE:999999999999999#FFFFFF:' Tx' GPRINT:outbits:LAST:%6.2lf%s GPRINT:outbits:AVERAGE:%6.2lf%s GPRINT:outbits:MIN:%6.2lf%s GPRINT:outbits:MAX:%6.2lf%s GPRINT:totout:%6.2lf%sB COMMENT:'\l' HRULE:999999999999999#FFFFFF:' Agg' GPRINT:bits:LAST:%6.2lf%s GPRINT:bits:AVERAGE:%6.2lf%s GPRINT:bits:MIN:%6.2lf%s GPRINT:bits:MAX:%6.2lf%s GPRINT:tot:%6.2lf%sB COMMENT:'\l' HRULE:0#999999%n]
RRD RUNTIME[0.0112s] RRD STDOUT[ERROR: can not parse an empty rpn expression] RRD_STATUS[FALSE]
Nothing else stood out for me. I can include all of the SELECT statements if that would be helpful.
Kevin McGregor
*From:* observium observium-bounces@observium.org *On Behalf Of *Adam Armstrong via observium *Sent:* October 21, 2020 13:07 *To:* observium@observium.org *Cc:* Adam Armstrong adama@observium.org *Subject:* Re: [Observium] Error drawing graph (can not parse an empty rpn expression)
*** EXTERNAL EMAIL: USE CAUTION ***
Hmm.
You can open the graph URL in a separate tab and add &debug=1 at the end to perhaps get some more information.
The device_bits format builds a list of ports and then passes it to the type generic_multi_separated which doesn’t check if the rrd exists.
The list of rrds used is generated in the device_bits type, so it’s difficult to guess what’s going on here.
Adam.
*From:* McGregor, Kevin <KMcGregor@winnipeg.ca mailto:KMcGregor@winnipeg.ca> *Sent:* 21 October 2020 14:02 *To:* Adam Armstrong <adama@observium.org mailto:adama@observium.org>; 'Observium' <observium@observium.org mailto:observium@observium.org> *Subject:* RE: [Observium] Error drawing graph (can not parse an empty rpn expression)
The .rrd files exist in the same directory as all of the other rrds for that host, and they have the same permissions as all of the others, and they are updated (as evidenced by the rrd file timestamp) every five minutes.
Is there a way to verify the rrd files in some way? Or just blow these two away and recreate them?
Kevin McGregor
*From:* Adam Armstrong <adama@observium.org mailto:adama@observium.org> *Sent:* October 20, 2020 14:02 *To:* 'Observium' <observium@observium.org mailto:observium@observium.org> *Subject:* Re: [Observium] Error drawing graph (can not parse an empty rpn expression)
This rrd definition doesn’t actually use any rrds, which suggests the rrds don’t exist.
Adam.
*From:* observium <observium-bounces@observium.org mailto:observium-bounces@observium.org> *On Behalf Of *McGregor, Kevin via observium *Sent:* 20 October 2020 19:55 *To:* observium@observium.org mailto:observium@observium.org *Cc:* McGregor, Kevin <KMcGregor@winnipeg.ca mailto:KMcGregor@winnipeg.ca> *Subject:* [Observium] Error drawing graph (can not parse an empty rpn expression)
I just upgraded from 19.8 to 20.9 CE. In both I’ve been having the same problem: Everything works as expected, except two devices (of 19) produce a big pink box instead of a chart for the “Ports” widget on the Overview page for the devices. The chart is titled “Error Drawing Graph”. Other similar devices (same OS version, etc.) all show a normal-looking chart in the same place. The devices are “SunOS <hostname> 5.11 11.4.25.75.3 sun4v”. Most other devices of the same version work, just not two of them.
When I click on the chart, I get the Ports page and a bigger version of the same chart. Selecting “RRD Command” produces this below the pink box:
Description
Device total traffic in bits/sec.
Performance & Output
RRDTool Output: ERROR: can not parse an empty rpn expression
RRDtool Runtime: 0.011s | Total time: 0.012s
RRDTool Command
/usr/bin/rrdtool graph /tmp/DZSTkOrAZmZQeckq.png -g -Y --alt-autoscale --rigid --start 1603133061 --end 1603219461 --width 1152 --height 300 -c BACK#EEEEEE00 -c SHADEA#EEEEEE00 -c SHADEB#EEEEEE00 -c FONT#000000 -c CANVAS#FFFFFF00 -c GRID#a5a5a5 -c MGRID#FF9999 -c FRAME#5e5e5e -c ARROW#5e5e5e -R normal --font LEGEND:8:'DroidSansMono,DejaVuSansMono' --font AXIS:7:'DroidSansMono,DejaVuSansMono' --font-render-mode normal -E CDEF:inB= CDEF:outB= CDEF:octets=inB,outB,+ CDEF:doutB=outB,-1,* CDEF:inbits=inB,8,* CDEF:outbits=outB,8,* CDEF:bits=inbits,outbits,+ CDEF:doutbits=doutB,8,* VDEF:95thin=inbits,95,PERCENT VDEF:95thout=outbits,95,PERCENT CDEF:pout_tmp=doutbits,-1,* VDEF:dpout_tmp=pout_tmp,95,PERCENT CDEF:dpout_tmp2=doutbits,doutbits,-,dpout_tmp,-1,*,+ VDEF:d95thout=dpout_tmp2,FIRST VDEF:totin=inB,TOTAL VDEF:avein=inbits,AVERAGE VDEF:totout=outB,TOTAL VDEF:aveout=outbits,AVERAGE VDEF:tot=octets,TOTAL COMMENT:' \l' HRULE:999999999999999#FFFFFF:'Total Rx' GPRINT:inbits:LAST:%6.2lf%s GPRINT:inbits:AVERAGE:%6.2lf%s GPRINT:inbits:MIN:%6.2lf%s GPRINT:inbits:MAX:%6.2lf%s GPRINT:totin:%6.2lf%sB COMMENT:'\l' HRULE:999999999999999#FFFFFF:' Tx' GPRINT:outbits:LAST:%6.2lf%s GPRINT:outbits:AVERAGE:%6.2lf%s GPRINT:outbits:MIN:%6.2lf%s GPRINT:outbits:MAX:%6.2lf%s GPRINT:totout:%6.2lf%sB COMMENT:'\l' HRULE:999999999999999#FFFFFF:' Agg' GPRINT:bits:LAST:%6.2lf%s GPRINT:bits:AVERAGE:%6.2lf%s GPRINT:bits:MIN:%6.2lf%s GPRINT:bits:MAX:%6.2lf%s GPRINT:tot:%6.2lf%sB COMMENT:'\l' HRULE:0#999999
RRDTool Files Used
/opt/observium/rrd/<hostname>/port-2.rrd
/opt/observium/rrd/<hostname>/port-1.rrd
Would someone please give me a place to start looking for the problem?
Thanks!
observium mailing list observium@observium.org http://postman.memetic.org/cgi-bin/mailman/listinfo/observium
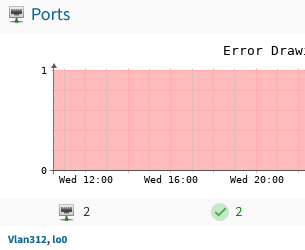
Yes - the only IPv4 interfaces. There is also a IPv6 lo defined. See image below. FYI it's an Oracle VM (guest logical domain) running Solaris 11.4.25.75.3 on an Oracle S7-2 SPARC machine. The other guest VM running the same version has the same problem. The other two devices running the exact same Solaris version are primary/control (not guest) VMs. Other devices running Solaris 11.4.11.4.0 and 11.4.17.3.0 do not exhibit this behavior.
[cid:image001.png@01D6A85E.F7BE89E0]
Kevin McGregor INV - Innovation, Transformation & Technology Dept. City of Winnipeg (204)782-7310
From: observium observium-bounces@observium.org On Behalf Of Tom Laermans via observium Sent: October 22, 2020 10:22 To: observium@observium.org Cc: Tom Laermans tom.laermans@powersource.cx Subject: Re: [Observium] Error drawing graph (can not parse an empty rpn expression)
** EXTERNAL EMAIL: USE CAUTION **
Kevin,
Are vlan312 and lo the only 2 interfaces on the device?
Tom
On 2020-10-21 21:36, McGregor, Kevin via observium wrote: There was a long list of the (probably) expected SELECT statements, and this:
$graphtypeincludes/graphs/graph.inc.php:47array(
0=>device_bitstype=>device1=>devicesubtype=>bits2=>bits)
SELECT * FROM `ports` WHERE `device_id` = '21' AND `deleted` != '1' ORDER BY (ifInOctets_rate + ifOutOctets_rate) DESC
[Port (id=62, ifIndex=2) ignored by ifDescr=vlan312] [Port (id=61, ifIndex=1) ignored by ifType=softwareLoopback]
RRD CMD[%ygraph /tmp/3QGGle3IXtZrnQcf.png -g -Y --alt-autoscale --rigid --start 1603222113 --end 1603308513 --width 1152 --height 300 -c BACK#EEEEEE00 -c SHADEA#EEEEEE00 -c SHADEB#EEEEEE00 -c FONT#000000 -c CANVAS#FFFFFF00 -c GRID#a5a5a5 -c MGRID#FF9999 -c FRAME#5e5e5e -c ARROW#5e5e5e -R normal --font LEGEND:8:'DroidSansMono,DejaVuSansMono' --font AXIS:7:'DroidSansMono,DejaVuSansMono' --font-render-mode normal -E CDEF:inB= CDEF:outB= CDEF:octets=inB,outB,+ CDEF:doutB=outB,-1,* CDEF:inbits=inB,8,* CDEF:outbits=outB,8,* CDEF:bits=inbits,outbits,+ CDEF:doutbits=doutB,8,* VDEF:95thin=inbits,95,PERCENT VDEF:95thout=outbits,95,PERCENT CDEF:pout_tmp=doutbits,-1,* VDEF:dpout_tmp=pout_tmp,95,PERCENT CDEF:dpout_tmp2=doutbits,doutbits,-,dpout_tmp,-1,*,+ VDEF:d95thout=dpout_tmp2,FIRST VDEF:totin=inB,TOTAL VDEF:avein=inbits,AVERAGE VDEF:totout=outB,TOTAL VDEF:aveout=outbits,AVERAGE VDEF:tot=octets,TOTAL COMMENT:' \l' HRULE:999999999999999#FFFFFF:'Total Rx' GPRINT:inbits:LAST:%6.2lf%s GPRINT:inbits:AVERAGE:%6.2lf%s GPRINT:inbits:MIN:%6.2lf%s GPRINT:inbits:MAX:%6.2lf%s GPRINT:totin:%6.2lf%sB COMMENT:'\l' HRULE:999999999999999#FFFFFF:' Tx' GPRINT:outbits:LAST:%6.2lf%s GPRINT:outbits:AVERAGE:%6.2lf%s GPRINT:outbits:MIN:%6.2lf%s GPRINT:outbits:MAX:%6.2lf%s GPRINT:totout:%6.2lf%sB COMMENT:'\l' HRULE:999999999999999#FFFFFF:' Agg' GPRINT:bits:LAST:%6.2lf%s GPRINT:bits:AVERAGE:%6.2lf%s GPRINT:bits:MIN:%6.2lf%s GPRINT:bits:MAX:%6.2lf%s GPRINT:tot:%6.2lf%sB COMMENT:'\l' HRULE:0#999999%n]
RRD RUNTIME[0.0112s] RRD STDOUT[ERROR: can not parse an empty rpn expression] RRD_STATUS[FALSE]
Nothing else stood out for me. I can include all of the SELECT statements if that would be helpful.
Kevin McGregor
From: observium observium-bounces@observium.orgmailto:observium-bounces@observium.org On Behalf Of Adam Armstrong via observium Sent: October 21, 2020 13:07 To: observium@observium.orgmailto:observium@observium.org Cc: Adam Armstrong adama@observium.orgmailto:adama@observium.org Subject: Re: [Observium] Error drawing graph (can not parse an empty rpn expression)
** EXTERNAL EMAIL: USE CAUTION **
Hmm.
You can open the graph URL in a separate tab and add &debug=1 at the end to perhaps get some more information.
The device_bits format builds a list of ports and then passes it to the type generic_multi_separated which doesn't check if the rrd exists.
The list of rrds used is generated in the device_bits type, so it's difficult to guess what's going on here.
Adam.
From: McGregor, Kevin <KMcGregor@winnipeg.camailto:KMcGregor@winnipeg.ca> Sent: 21 October 2020 14:02 To: Adam Armstrong <adama@observium.orgmailto:adama@observium.org>; 'Observium' <observium@observium.orgmailto:observium@observium.org> Subject: RE: [Observium] Error drawing graph (can not parse an empty rpn expression)
The .rrd files exist in the same directory as all of the other rrds for that host, and they have the same permissions as all of the others, and they are updated (as evidenced by the rrd file timestamp) every five minutes.
Is there a way to verify the rrd files in some way? Or just blow these two away and recreate them?
Kevin McGregor
From: Adam Armstrong <adama@observium.orgmailto:adama@observium.org> Sent: October 20, 2020 14:02 To: 'Observium' <observium@observium.orgmailto:observium@observium.org> Subject: Re: [Observium] Error drawing graph (can not parse an empty rpn expression)
This rrd definition doesn't actually use any rrds, which suggests the rrds don't exist.
Adam.
From: observium <observium-bounces@observium.orgmailto:observium-bounces@observium.org> On Behalf Of McGregor, Kevin via observium Sent: 20 October 2020 19:55 To: observium@observium.orgmailto:observium@observium.org Cc: McGregor, Kevin <KMcGregor@winnipeg.camailto:KMcGregor@winnipeg.ca> Subject: [Observium] Error drawing graph (can not parse an empty rpn expression)
I just upgraded from 19.8 to 20.9 CE. In both I've been having the same problem: Everything works as expected, except two devices (of 19) produce a big pink box instead of a chart for the "Ports" widget on the Overview page for the devices. The chart is titled "Error Drawing Graph". Other similar devices (same OS version, etc.) all show a normal-looking chart in the same place. The devices are "SunOS <hostname> 5.11 11.4.25.75.3 sun4v". Most other devices of the same version work, just not two of them.
When I click on the chart, I get the Ports page and a bigger version of the same chart. Selecting "RRD Command" produces this below the pink box:
Description Device total traffic in bits/sec.
Performance & Output RRDTool Output: ERROR: can not parse an empty rpn expression RRDtool Runtime: 0.011s | Total time: 0.012s
RRDTool Command /usr/bin/rrdtool graph /tmp/DZSTkOrAZmZQeckq.png -g -Y --alt-autoscale --rigid --start 1603133061 --end 1603219461 --width 1152 --height 300 -c BACK#EEEEEE00 -c SHADEA#EEEEEE00 -c SHADEB#EEEEEE00 -c FONT#000000 -c CANVAS#FFFFFF00 -c GRID#a5a5a5 -c MGRID#FF9999 -c FRAME#5e5e5e -c ARROW#5e5e5e -R normal --font LEGEND:8:'DroidSansMono,DejaVuSansMono' --font AXIS:7:'DroidSansMono,DejaVuSansMono' --font-render-mode normal -E CDEF:inB= CDEF:outB= CDEF:octets=inB,outB,+ CDEF:doutB=outB,-1,* CDEF:inbits=inB,8,* CDEF:outbits=outB,8,* CDEF:bits=inbits,outbits,+ CDEF:doutbits=doutB,8,* VDEF:95thin=inbits,95,PERCENT VDEF:95thout=outbits,95,PERCENT CDEF:pout_tmp=doutbits,-1,* VDEF:dpout_tmp=pout_tmp,95,PERCENT CDEF:dpout_tmp2=doutbits,doutbits,-,dpout_tmp,-1,*,+ VDEF:d95thout=dpout_tmp2,FIRST VDEF:totin=inB,TOTAL VDEF:avein=inbits,AVERAGE VDEF:totout=outB,TOTAL VDEF:aveout=outbits,AVERAGE VDEF:tot=octets,TOTAL COMMENT:' \l' HRULE:999999999999999#FFFFFF:'Total Rx' GPRINT:inbits:LAST:%6.2lf%s GPRINT:inbits:AVERAGE:%6.2lf%s GPRINT:inbits:MIN:%6.2lf%s GPRINT:inbits:MAX:%6.2lf%s GPRINT:totin:%6.2lf%sB COMMENT:'\l' HRULE:999999999999999#FFFFFF:' Tx' GPRINT:outbits:LAST:%6.2lf%s GPRINT:outbits:AVERAGE:%6.2lf%s GPRINT:outbits:MIN:%6.2lf%s GPRINT:outbits:MAX:%6.2lf%s GPRINT:totout:%6.2lf%sB COMMENT:'\l' HRULE:999999999999999#FFFFFF:' Agg' GPRINT:bits:LAST:%6.2lf%s GPRINT:bits:AVERAGE:%6.2lf%s GPRINT:bits:MIN:%6.2lf%s GPRINT:bits:MAX:%6.2lf%s GPRINT:tot:%6.2lf%sB COMMENT:'\l' HRULE:0#999999
RRDTool Files Used /opt/observium/rrd/<hostname>/port-2.rrd /opt/observium/rrd/<hostname>/port-1.rrd
Would someone please give me a place to start looking for the problem?
Thanks!
_______________________________________________
observium mailing list
observium@observium.orgmailto:observium@observium.org
http://postman.memetic.org/cgi-bin/mailman/listinfo/observium
Oh, that explains it. We ignore virtual interfaces, because it makes that graph near worthless.
You can set :
$config['os'][<OS TYPE>]['ports_unignore_descr'] = TRUE;
In the config to disable ignoring ports by their descriptions for a single OS. The OS type is probably "solaris". You can see the exact string in the device's "data" page on the right hand icon on its navbar.
Thanks,
Adam.
From: observium observium-bounces@observium.org On Behalf Of McGregor, Kevin via observium Sent: 22 October 2020 16:41 To: Observium observium@observium.org Cc: McGregor, Kevin KMcGregor@winnipeg.ca Subject: Re: [Observium] Error drawing graph (can not parse an empty rpn expression)
Yes - the only IPv4 interfaces. There is also a IPv6 lo defined. See image below. FYI it's an Oracle VM (guest logical domain) running Solaris 11.4.25.75.3 on an Oracle S7-2 SPARC machine. The other guest VM running the same version has the same problem. The other two devices running the exact same Solaris version are primary/control (not guest) VMs. Other devices running Solaris 11.4.11.4.0 and 11.4.17.3.0 do not exhibit this behavior.
Kevin McGregor
INV - Innovation, Transformation & Technology Dept.
City of Winnipeg
(204)782-7310
From: observium <observium-bounces@observium.org mailto:observium-bounces@observium.org > On Behalf Of Tom Laermans via observium Sent: October 22, 2020 10:22 To: observium@observium.org mailto:observium@observium.org Cc: Tom Laermans <tom.laermans@powersource.cx mailto:tom.laermans@powersource.cx > Subject: Re: [Observium] Error drawing graph (can not parse an empty rpn expression)
** EXTERNAL EMAIL: USE CAUTION **
Kevin,
Are vlan312 and lo the only 2 interfaces on the device?
Tom
On 2020-10-21 21:36, McGregor, Kevin via observium wrote:
There was a long list of the (probably) expected SELECT statements, and this:
$graphtypeincludes/graphs/graph.inc.php:47array(
0=>device_bitstype=>device1=>devicesubtype=>bits2=>bits)
SELECT * FROM `ports` WHERE `device_id` = '21' AND `deleted` != '1' ORDER BY (ifInOctets_rate + ifOutOctets_rate) DESC
[Port (id=62, ifIndex=2) ignored by ifDescr=vlan312]
[Port (id=61, ifIndex=1) ignored by ifType=softwareLoopback]
RRD CMD[%ygraph /tmp/3QGGle3IXtZrnQcf.png -g -Y --alt-autoscale --rigid --start 1603222113 --end 1603308513 --width 1152 --height 300 -c BACK#EEEEEE00 -c SHADEA#EEEEEE00 -c SHADEB#EEEEEE00 -c FONT#000000 -c CANVAS#FFFFFF00 -c GRID#a5a5a5 -c MGRID#FF9999 -c FRAME#5e5e5e -c ARROW#5e5e5e -R normal --font LEGEND:8:'DroidSansMono,DejaVuSansMono' --font AXIS:7:'DroidSansMono,DejaVuSansMono' --font-render-mode normal -E CDEF:inB= CDEF:outB= CDEF:octets=inB,outB,+ CDEF:doutB=outB,-1,* CDEF:inbits=inB,8,* CDEF:outbits=outB,8,* CDEF:bits=inbits,outbits,+ CDEF:doutbits=doutB,8,* VDEF:95thin=inbits,95,PERCENT VDEF:95thout=outbits,95,PERCENT CDEF:pout_tmp=doutbits,-1,* VDEF:dpout_tmp=pout_tmp,95,PERCENT CDEF:dpout_tmp2=doutbits,doutbits,-,dpout_tmp,-1,*,+ VDEF:d95thout=dpout_tmp2,FIRST VDEF:totin=inB,TOTAL VDEF:avein=inbits,AVERAGE VDEF:totout=outB,TOTAL VDEF:aveout=outbits,AVERAGE VDEF:tot=octets,TOTAL COMMENT:' \l' HRULE:999999999999999#FFFFFF:'Total Rx' GPRINT:inbits:LAST:%6.2lf%s GPRINT:inbits:AVERAGE:%6.2lf%s GPRINT:inbits:MIN:%6.2lf%s GPRINT:inbits:MAX:%6.2lf%s GPRINT:totin:%6.2lf%sB COMMENT:'\l' HRULE:999999999999999#FFFFFF:' Tx' GPRINT:outbits:LAST:%6.2lf%s GPRINT:outbits:AVERAGE:%6.2lf%s GPRINT:outbits:MIN:%6.2lf%s GPRINT:outbits:MAX:%6.2lf%s GPRINT:totout:%6.2lf%sB COMMENT:'\l' HRULE:999999999999999#FFFFFF:' Agg' GPRINT:bits:LAST:%6.2lf%s GPRINT:bits:AVERAGE:%6.2lf%s GPRINT:bits:MIN:%6.2lf%s GPRINT:bits:MAX:%6.2lf%s GPRINT:tot:%6.2lf%sB COMMENT:'\l' HRULE:0#999999%n]
RRD RUNTIME[0.0112s] RRD STDOUT[ERROR: can not parse an empty rpn expression] RRD_STATUS[FALSE]
Nothing else stood out for me. I can include all of the SELECT statements if that would be helpful.
Kevin McGregor
From: observium mailto:observium-bounces@observium.org observium-bounces@observium.org On Behalf Of Adam Armstrong via observium Sent: October 21, 2020 13:07 To: observium@observium.org mailto:observium@observium.org Cc: Adam Armstrong mailto:adama@observium.org adama@observium.org Subject: Re: [Observium] Error drawing graph (can not parse an empty rpn expression)
** EXTERNAL EMAIL: USE CAUTION **
Hmm.
You can open the graph URL in a separate tab and add &debug=1 at the end to perhaps get some more information.
The device_bits format builds a list of ports and then passes it to the type generic_multi_separated which doesn't check if the rrd exists.
The list of rrds used is generated in the device_bits type, so it's difficult to guess what's going on here.
Adam.
From: McGregor, Kevin <KMcGregor@winnipeg.ca mailto:KMcGregor@winnipeg.ca
Sent: 21 October 2020 14:02 To: Adam Armstrong <adama@observium.org mailto:adama@observium.org >; 'Observium' <observium@observium.org mailto:observium@observium.org > Subject: RE: [Observium] Error drawing graph (can not parse an empty rpn expression)
The .rrd files exist in the same directory as all of the other rrds for that host, and they have the same permissions as all of the others, and they are updated (as evidenced by the rrd file timestamp) every five minutes.
Is there a way to verify the rrd files in some way? Or just blow these two away and recreate them?
Kevin McGregor
From: Adam Armstrong <adama@observium.org mailto:adama@observium.org > Sent: October 20, 2020 14:02 To: 'Observium' <observium@observium.org mailto:observium@observium.org > Subject: Re: [Observium] Error drawing graph (can not parse an empty rpn expression)
This rrd definition doesn't actually use any rrds, which suggests the rrds don't exist.
Adam.
From: observium <observium-bounces@observium.org mailto:observium-bounces@observium.org > On Behalf Of McGregor, Kevin via observium Sent: 20 October 2020 19:55 To: observium@observium.org mailto:observium@observium.org Cc: McGregor, Kevin <KMcGregor@winnipeg.ca mailto:KMcGregor@winnipeg.ca > Subject: [Observium] Error drawing graph (can not parse an empty rpn expression)
I just upgraded from 19.8 to 20.9 CE. In both I've been having the same problem: Everything works as expected, except two devices (of 19) produce a big pink box instead of a chart for the "Ports" widget on the Overview page for the devices. The chart is titled "Error Drawing Graph". Other similar devices (same OS version, etc.) all show a normal-looking chart in the same place. The devices are "SunOS <hostname> 5.11 11.4.25.75.3 sun4v". Most other devices of the same version work, just not two of them.
When I click on the chart, I get the Ports page and a bigger version of the same chart. Selecting "RRD Command" produces this below the pink box:
Description
Device total traffic in bits/sec.
Performance & Output
RRDTool Output: ERROR: can not parse an empty rpn expression
RRDtool Runtime: 0.011s | Total time: 0.012s
RRDTool Command
/usr/bin/rrdtool graph /tmp/DZSTkOrAZmZQeckq.png -g -Y --alt-autoscale --rigid --start 1603133061 --end 1603219461 --width 1152 --height 300 -c BACK#EEEEEE00 -c SHADEA#EEEEEE00 -c SHADEB#EEEEEE00 -c FONT#000000 -c CANVAS#FFFFFF00 -c GRID#a5a5a5 -c MGRID#FF9999 -c FRAME#5e5e5e -c ARROW#5e5e5e -R normal --font LEGEND:8:'DroidSansMono,DejaVuSansMono' --font AXIS:7:'DroidSansMono,DejaVuSansMono' --font-render-mode normal -E CDEF:inB= CDEF:outB= CDEF:octets=inB,outB,+ CDEF:doutB=outB,-1,* CDEF:inbits=inB,8,* CDEF:outbits=outB,8,* CDEF:bits=inbits,outbits,+ CDEF:doutbits=doutB,8,* VDEF:95thin=inbits,95,PERCENT VDEF:95thout=outbits,95,PERCENT CDEF:pout_tmp=doutbits,-1,* VDEF:dpout_tmp=pout_tmp,95,PERCENT CDEF:dpout_tmp2=doutbits,doutbits,-,dpout_tmp,-1,*,+ VDEF:d95thout=dpout_tmp2,FIRST VDEF:totin=inB,TOTAL VDEF:avein=inbits,AVERAGE VDEF:totout=outB,TOTAL VDEF:aveout=outbits,AVERAGE VDEF:tot=octets,TOTAL COMMENT:' \l' HRULE:999999999999999#FFFFFF:'Total Rx' GPRINT:inbits:LAST:%6.2lf%s GPRINT:inbits:AVERAGE:%6.2lf%s GPRINT:inbits:MIN:%6.2lf%s GPRINT:inbits:MAX:%6.2lf%s GPRINT:totin:%6.2lf%sB COMMENT:'\l' HRULE:999999999999999#FFFFFF:' Tx' GPRINT:outbits:LAST:%6.2lf%s GPRINT:outbits:AVERAGE:%6.2lf%s GPRINT:outbits:MIN:%6.2lf%s GPRINT:outbits:MAX:%6.2lf%s GPRINT:totout:%6.2lf%sB COMMENT:'\l' HRULE:999999999999999#FFFFFF:' Agg' GPRINT:bits:LAST:%6.2lf%s GPRINT:bits:AVERAGE:%6.2lf%s GPRINT:bits:MIN:%6.2lf%s GPRINT:bits:MAX:%6.2lf%s GPRINT:tot:%6.2lf%sB COMMENT:'\l' HRULE:0#999999
RRDTool Files Used
/opt/observium/rrd/<hostname>/port-2.rrd
/opt/observium/rrd/<hostname>/port-1.rrd
Would someone please give me a place to start looking for the problem?
Thanks!
_______________________________________________ observium mailing list observium@observium.org mailto:observium@observium.org http://postman.memetic.org/cgi-bin/mailman/listinfo/observium
I used $config['os']['opensolaris']['ports_unignore_descr'] = TRUE;
And now the graph works as expected. I now recall that these were the two servers I set up with VLAN support "just in case" we would need it in the future. So for most use cases, the virtual interfaces are useless for graphing? Do they produce empty graphs or something?
Thanks for the workaround.
Kevin McGregor
From: observium observium-bounces@observium.org On Behalf Of Adam Armstrong via observium Sent: October 22, 2020 11:55 To: 'Observium' observium@observium.org Cc: Adam Armstrong adama@observium.org Subject: Re: [Observium] Error drawing graph (can not parse an empty rpn expression)
** EXTERNAL EMAIL: USE CAUTION **
Oh, that explains it. We ignore virtual interfaces, because it makes that graph near worthless.
You can set :
$config['os'][<OS TYPE>]['ports_unignore_descr'] = TRUE;
In the config to disable ignoring ports by their descriptions for a single OS. The OS type is probably "solaris". You can see the exact string in the device's "data" page on the right hand icon on its navbar.
Thanks, Adam.
From: observium <observium-bounces@observium.orgmailto:observium-bounces@observium.org> On Behalf Of McGregor, Kevin via observium Sent: 22 October 2020 16:41 To: Observium <observium@observium.orgmailto:observium@observium.org> Cc: McGregor, Kevin <KMcGregor@winnipeg.camailto:KMcGregor@winnipeg.ca> Subject: Re: [Observium] Error drawing graph (can not parse an empty rpn expression)
Yes - the only IPv4 interfaces. There is also a IPv6 lo defined. See image below. FYI it's an Oracle VM (guest logical domain) running Solaris 11.4.25.75.3 on an Oracle S7-2 SPARC machine. The other guest VM running the same version has the same problem. The other two devices running the exact same Solaris version are primary/control (not guest) VMs. Other devices running Solaris 11.4.11.4.0 and 11.4.17.3.0 do not exhibit this behavior.
[cid:image001.png@01D6A87F.D8AF7A20]
Kevin McGregor INV - Innovation, Transformation & Technology Dept. City of Winnipeg (204)782-7310
From: observium <observium-bounces@observium.orgmailto:observium-bounces@observium.org> On Behalf Of Tom Laermans via observium Sent: October 22, 2020 10:22 To: observium@observium.orgmailto:observium@observium.org Cc: Tom Laermans <tom.laermans@powersource.cxmailto:tom.laermans@powersource.cx> Subject: Re: [Observium] Error drawing graph (can not parse an empty rpn expression)
** EXTERNAL EMAIL: USE CAUTION **
Kevin,
Are vlan312 and lo the only 2 interfaces on the device?
Tom
On 2020-10-21 21:36, McGregor, Kevin via observium wrote: There was a long list of the (probably) expected SELECT statements, and this:
$graphtypeincludes/graphs/graph.inc.php:47array(
0=>device_bitstype=>device1=>devicesubtype=>bits2=>bits)
SELECT * FROM `ports` WHERE `device_id` = '21' AND `deleted` != '1' ORDER BY (ifInOctets_rate + ifOutOctets_rate) DESC
[Port (id=62, ifIndex=2) ignored by ifDescr=vlan312] [Port (id=61, ifIndex=1) ignored by ifType=softwareLoopback]
RRD CMD[%ygraph /tmp/3QGGle3IXtZrnQcf.png -g -Y --alt-autoscale --rigid --start 1603222113 --end 1603308513 --width 1152 --height 300 -c BACK#EEEEEE00 -c SHADEA#EEEEEE00 -c SHADEB#EEEEEE00 -c FONT#000000 -c CANVAS#FFFFFF00 -c GRID#a5a5a5 -c MGRID#FF9999 -c FRAME#5e5e5e -c ARROW#5e5e5e -R normal --font LEGEND:8:'DroidSansMono,DejaVuSansMono' --font AXIS:7:'DroidSansMono,DejaVuSansMono' --font-render-mode normal -E CDEF:inB= CDEF:outB= CDEF:octets=inB,outB,+ CDEF:doutB=outB,-1,* CDEF:inbits=inB,8,* CDEF:outbits=outB,8,* CDEF:bits=inbits,outbits,+ CDEF:doutbits=doutB,8,* VDEF:95thin=inbits,95,PERCENT VDEF:95thout=outbits,95,PERCENT CDEF:pout_tmp=doutbits,-1,* VDEF:dpout_tmp=pout_tmp,95,PERCENT CDEF:dpout_tmp2=doutbits,doutbits,-,dpout_tmp,-1,*,+ VDEF:d95thout=dpout_tmp2,FIRST VDEF:totin=inB,TOTAL VDEF:avein=inbits,AVERAGE VDEF:totout=outB,TOTAL VDEF:aveout=outbits,AVERAGE VDEF:tot=octets,TOTAL COMMENT:' \l' HRULE:999999999999999#FFFFFF:'Total Rx' GPRINT:inbits:LAST:%6.2lf%s GPRINT:inbits:AVERAGE:%6.2lf%s GPRINT:inbits:MIN:%6.2lf%s GPRINT:inbits:MAX:%6.2lf%s GPRINT:totin:%6.2lf%sB COMMENT:'\l' HRULE:999999999999999#FFFFFF:' Tx' GPRINT:outbits:LAST:%6.2lf%s GPRINT:outbits:AVERAGE:%6.2lf%s GPRINT:outbits:MIN:%6.2lf%s GPRINT:outbits:MAX:%6.2lf%s GPRINT:totout:%6.2lf%sB COMMENT:'\l' HRULE:999999999999999#FFFFFF:' Agg' GPRINT:bits:LAST:%6.2lf%s GPRINT:bits:AVERAGE:%6.2lf%s GPRINT:bits:MIN:%6.2lf%s GPRINT:bits:MAX:%6.2lf%s GPRINT:tot:%6.2lf%sB COMMENT:'\l' HRULE:0#999999%n]
RRD RUNTIME[0.0112s] RRD STDOUT[ERROR: can not parse an empty rpn expression] RRD_STATUS[FALSE]
Nothing else stood out for me. I can include all of the SELECT statements if that would be helpful.
Kevin McGregor
From: observium observium-bounces@observium.orgmailto:observium-bounces@observium.org On Behalf Of Adam Armstrong via observium Sent: October 21, 2020 13:07 To: observium@observium.orgmailto:observium@observium.org Cc: Adam Armstrong adama@observium.orgmailto:adama@observium.org Subject: Re: [Observium] Error drawing graph (can not parse an empty rpn expression)
** EXTERNAL EMAIL: USE CAUTION **
Hmm.
You can open the graph URL in a separate tab and add &debug=1 at the end to perhaps get some more information.
The device_bits format builds a list of ports and then passes it to the type generic_multi_separated which doesn't check if the rrd exists.
The list of rrds used is generated in the device_bits type, so it's difficult to guess what's going on here.
Adam.
From: McGregor, Kevin <KMcGregor@winnipeg.camailto:KMcGregor@winnipeg.ca> Sent: 21 October 2020 14:02 To: Adam Armstrong <adama@observium.orgmailto:adama@observium.org>; 'Observium' <observium@observium.orgmailto:observium@observium.org> Subject: RE: [Observium] Error drawing graph (can not parse an empty rpn expression)
The .rrd files exist in the same directory as all of the other rrds for that host, and they have the same permissions as all of the others, and they are updated (as evidenced by the rrd file timestamp) every five minutes.
Is there a way to verify the rrd files in some way? Or just blow these two away and recreate them?
Kevin McGregor
From: Adam Armstrong <adama@observium.orgmailto:adama@observium.org> Sent: October 20, 2020 14:02 To: 'Observium' <observium@observium.orgmailto:observium@observium.org> Subject: Re: [Observium] Error drawing graph (can not parse an empty rpn expression)
This rrd definition doesn't actually use any rrds, which suggests the rrds don't exist.
Adam.
From: observium <observium-bounces@observium.orgmailto:observium-bounces@observium.org> On Behalf Of McGregor, Kevin via observium Sent: 20 October 2020 19:55 To: observium@observium.orgmailto:observium@observium.org Cc: McGregor, Kevin <KMcGregor@winnipeg.camailto:KMcGregor@winnipeg.ca> Subject: [Observium] Error drawing graph (can not parse an empty rpn expression)
I just upgraded from 19.8 to 20.9 CE. In both I've been having the same problem: Everything works as expected, except two devices (of 19) produce a big pink box instead of a chart for the "Ports" widget on the Overview page for the devices. The chart is titled "Error Drawing Graph". Other similar devices (same OS version, etc.) all show a normal-looking chart in the same place. The devices are "SunOS <hostname> 5.11 11.4.25.75.3 sun4v". Most other devices of the same version work, just not two of them.
When I click on the chart, I get the Ports page and a bigger version of the same chart. Selecting "RRD Command" produces this below the pink box:
Description Device total traffic in bits/sec.
Performance & Output RRDTool Output: ERROR: can not parse an empty rpn expression RRDtool Runtime: 0.011s | Total time: 0.012s
RRDTool Command /usr/bin/rrdtool graph /tmp/DZSTkOrAZmZQeckq.png -g -Y --alt-autoscale --rigid --start 1603133061 --end 1603219461 --width 1152 --height 300 -c BACK#EEEEEE00 -c SHADEA#EEEEEE00 -c SHADEB#EEEEEE00 -c FONT#000000 -c CANVAS#FFFFFF00 -c GRID#a5a5a5 -c MGRID#FF9999 -c FRAME#5e5e5e -c ARROW#5e5e5e -R normal --font LEGEND:8:'DroidSansMono,DejaVuSansMono' --font AXIS:7:'DroidSansMono,DejaVuSansMono' --font-render-mode normal -E CDEF:inB= CDEF:outB= CDEF:octets=inB,outB,+ CDEF:doutB=outB,-1,* CDEF:inbits=inB,8,* CDEF:outbits=outB,8,* CDEF:bits=inbits,outbits,+ CDEF:doutbits=doutB,8,* VDEF:95thin=inbits,95,PERCENT VDEF:95thout=outbits,95,PERCENT CDEF:pout_tmp=doutbits,-1,* VDEF:dpout_tmp=pout_tmp,95,PERCENT CDEF:dpout_tmp2=doutbits,doutbits,-,dpout_tmp,-1,*,+ VDEF:d95thout=dpout_tmp2,FIRST VDEF:totin=inB,TOTAL VDEF:avein=inbits,AVERAGE VDEF:totout=outB,TOTAL VDEF:aveout=outbits,AVERAGE VDEF:tot=octets,TOTAL COMMENT:' \l' HRULE:999999999999999#FFFFFF:'Total Rx' GPRINT:inbits:LAST:%6.2lf%s GPRINT:inbits:AVERAGE:%6.2lf%s GPRINT:inbits:MIN:%6.2lf%s GPRINT:inbits:MAX:%6.2lf%s GPRINT:totin:%6.2lf%sB COMMENT:'\l' HRULE:999999999999999#FFFFFF:' Tx' GPRINT:outbits:LAST:%6.2lf%s GPRINT:outbits:AVERAGE:%6.2lf%s GPRINT:outbits:MIN:%6.2lf%s GPRINT:outbits:MAX:%6.2lf%s GPRINT:totout:%6.2lf%sB COMMENT:'\l' HRULE:999999999999999#FFFFFF:' Agg' GPRINT:bits:LAST:%6.2lf%s GPRINT:bits:AVERAGE:%6.2lf%s GPRINT:bits:MIN:%6.2lf%s GPRINT:bits:MAX:%6.2lf%s GPRINT:tot:%6.2lf%sB COMMENT:'\l' HRULE:0#999999
RRDTool Files Used /opt/observium/rrd/<hostname>/port-2.rrd /opt/observium/rrd/<hostname>/port-1.rrd
Would someone please give me a place to start looking for the problem?
Thanks!
_______________________________________________
observium mailing list
observium@observium.orgmailto:observium@observium.org
http://postman.memetic.org/cgi-bin/mailman/listinfo/observium
The device level graph is intended to show traffic entering and exiting the device. Non-physical/virtual interfaces usually just duplicate physical traffic and make the graphs meaningless.
The ifDescr matching is because some devices don't correctly set ifType.
Adam.
Sent from BlueMail
On 22 Oct 2020, 20:30, at 20:30, "McGregor, Kevin" kmcgregor@winnipeg.ca wrote:
I used $config['os']['opensolaris']['ports_unignore_descr'] = TRUE;
And now the graph works as expected. I now recall that these were the two servers I set up with VLAN support "just in case" we would need it in the future. So for most use cases, the virtual interfaces are useless for graphing? Do they produce empty graphs or something?
Thanks for the workaround.
Kevin McGregor
From: observium observium-bounces@observium.org On Behalf Of Adam Armstrong via observium Sent: October 22, 2020 11:55 To: 'Observium' observium@observium.org Cc: Adam Armstrong adama@observium.org Subject: Re: [Observium] Error drawing graph (can not parse an empty rpn expression)
** EXTERNAL EMAIL: USE CAUTION **
Oh, that explains it. We ignore virtual interfaces, because it makes that graph near worthless.
You can set :
$config['os'][<OS TYPE>]['ports_unignore_descr'] = TRUE;
In the config to disable ignoring ports by their descriptions for a single OS. The OS type is probably "solaris". You can see the exact string in the device's "data" page on the right hand icon on its navbar.
Thanks, Adam.
From: observium <observium-bounces@observium.orgmailto:observium-bounces@observium.org> On Behalf Of McGregor, Kevin via observium Sent: 22 October 2020 16:41 To: Observium <observium@observium.orgmailto:observium@observium.org> Cc: McGregor, Kevin <KMcGregor@winnipeg.camailto:KMcGregor@winnipeg.ca> Subject: Re: [Observium] Error drawing graph (can not parse an empty rpn expression)
Yes - the only IPv4 interfaces. There is also a IPv6 lo defined. See image below. FYI it's an Oracle VM (guest logical domain) running Solaris 11.4.25.75.3 on an Oracle S7-2 SPARC machine. The other guest VM running the same version has the same problem. The other two devices running the exact same Solaris version are primary/control (not guest) VMs. Other devices running Solaris 11.4.11.4.0 and 11.4.17.3.0 do not exhibit this behavior.
[cid:image001.png@01D6A87F.D8AF7A20]
Kevin McGregor INV - Innovation, Transformation & Technology Dept. City of Winnipeg (204)782-7310
From: observium <observium-bounces@observium.orgmailto:observium-bounces@observium.org> On Behalf Of Tom Laermans via observium Sent: October 22, 2020 10:22 To: observium@observium.orgmailto:observium@observium.org Cc: Tom Laermans <tom.laermans@powersource.cxmailto:tom.laermans@powersource.cx> Subject: Re: [Observium] Error drawing graph (can not parse an empty rpn expression)
** EXTERNAL EMAIL: USE CAUTION **
Kevin,
Are vlan312 and lo the only 2 interfaces on the device?
Tom
On 2020-10-21 21:36, McGregor, Kevin via observium wrote: There was a long list of the (probably) expected SELECT statements, and this:
$graphtypeincludes/graphs/graph.inc.php:47array(
0=>device_bitstype=>device1=>devicesubtype=>bits2=>bits)
SELECT * FROM `ports` WHERE `device_id` = '21' AND `deleted` != '1' ORDER BY (ifInOctets_rate + ifOutOctets_rate) DESC
[Port (id=62, ifIndex=2) ignored by ifDescr=vlan312] [Port (id=61, ifIndex=1) ignored by ifType=softwareLoopback]
RRD CMD[%ygraph /tmp/3QGGle3IXtZrnQcf.png -g -Y --alt-autoscale --rigid --start 1603222113 --end 1603308513 --width 1152 --height 300 -c BACK#EEEEEE00 -c SHADEA#EEEEEE00 -c SHADEB#EEEEEE00 -c FONT#000000 -c CANVAS#FFFFFF00 -c GRID#a5a5a5 -c MGRID#FF9999 -c FRAME#5e5e5e -c ARROW#5e5e5e -R normal --font LEGEND:8:'DroidSansMono,DejaVuSansMono' --font AXIS:7:'DroidSansMono,DejaVuSansMono' --font-render-mode normal -E CDEF:inB= CDEF:outB= CDEF:octets=inB,outB,+ CDEF:doutB=outB,-1,* CDEF:inbits=inB,8,* CDEF:outbits=outB,8,* CDEF:bits=inbits,outbits,+ CDEF:doutbits=doutB,8,* VDEF:95thin=inbits,95,PERCENT VDEF:95thout=outbits,95,PERCENT CDEF:pout_tmp=doutbits,-1,* VDEF:dpout_tmp=pout_tmp,95,PERCENT CDEF:dpout_tmp2=doutbits,doutbits,-,dpout_tmp,-1,*,+ VDEF:d95thout=dpout_tmp2,FIRST VDEF:totin=inB,TOTAL VDEF:avein=inbits,AVERAGE VDEF:totout=outB,TOTAL VDEF:aveout=outbits,AVERAGE VDEF:tot=octets,TOTAL COMMENT:' \l' HRULE:999999999999999#FFFFFF:'Total Rx' GPRINT:inbits:LAST:%6.2lf%s GPRINT:inbits:AVERAGE:%6.2lf%s GPRINT:inbits:MIN:%6.2lf%s GPRINT:inbits:MAX:%6.2lf%s GPRINT:totin:%6.2lf%sB COMMENT:'\l' HRULE:999999999999999#FFFFFF:' Tx' GPRINT:outbits:LAST:%6.2lf%s GPRINT:outbits:AVERAGE:%6.2lf%s GPRINT:outbits:MIN:%6.2lf%s GPRINT:outbits:MAX:%6.2lf%s GPRINT:totout:%6.2lf%sB COMMENT:'\l' HRULE:999999999999999#FFFFFF:' Agg' GPRINT:bits:LAST:%6.2lf%s GPRINT:bits:AVERAGE:%6.2lf%s GPRINT:bits:MIN:%6.2lf%s GPRINT:bits:MAX:%6.2lf%s GPRINT:tot:%6.2lf%sB COMMENT:'\l' HRULE:0#999999%n]
RRD RUNTIME[0.0112s] RRD STDOUT[ERROR: can not parse an empty rpn expression] RRD_STATUS[FALSE]
Nothing else stood out for me. I can include all of the SELECT statements if that would be helpful.
Kevin McGregor
From: observium observium-bounces@observium.orgmailto:observium-bounces@observium.org On Behalf Of Adam Armstrong via observium Sent: October 21, 2020 13:07 To: observium@observium.orgmailto:observium@observium.org Cc: Adam Armstrong adama@observium.orgmailto:adama@observium.org Subject: Re: [Observium] Error drawing graph (can not parse an empty rpn expression)
** EXTERNAL EMAIL: USE CAUTION **
Hmm.
You can open the graph URL in a separate tab and add &debug=1 at the end to perhaps get some more information.
The device_bits format builds a list of ports and then passes it to the type generic_multi_separated which doesn't check if the rrd exists.
The list of rrds used is generated in the device_bits type, so it's difficult to guess what's going on here.
Adam.
From: McGregor, Kevin <KMcGregor@winnipeg.camailto:KMcGregor@winnipeg.ca> Sent: 21 October 2020 14:02 To: Adam Armstrong <adama@observium.orgmailto:adama@observium.org>; 'Observium' <observium@observium.orgmailto:observium@observium.org> Subject: RE: [Observium] Error drawing graph (can not parse an empty rpn expression)
The .rrd files exist in the same directory as all of the other rrds for that host, and they have the same permissions as all of the others, and they are updated (as evidenced by the rrd file timestamp) every five minutes.
Is there a way to verify the rrd files in some way? Or just blow these two away and recreate them?
Kevin McGregor
From: Adam Armstrong <adama@observium.orgmailto:adama@observium.org> Sent: October 20, 2020 14:02 To: 'Observium' <observium@observium.orgmailto:observium@observium.org> Subject: Re: [Observium] Error drawing graph (can not parse an empty rpn expression)
This rrd definition doesn't actually use any rrds, which suggests the rrds don't exist.
Adam.
From: observium <observium-bounces@observium.orgmailto:observium-bounces@observium.org> On Behalf Of McGregor, Kevin via observium Sent: 20 October 2020 19:55 To: observium@observium.orgmailto:observium@observium.org Cc: McGregor, Kevin <KMcGregor@winnipeg.camailto:KMcGregor@winnipeg.ca> Subject: [Observium] Error drawing graph (can not parse an empty rpn expression)
I just upgraded from 19.8 to 20.9 CE. In both I've been having the same problem: Everything works as expected, except two devices (of 19) produce a big pink box instead of a chart for the "Ports" widget on the Overview page for the devices. The chart is titled "Error Drawing Graph". Other similar devices (same OS version, etc.) all show a normal-looking chart in the same place. The devices are "SunOS <hostname> 5.11 11.4.25.75.3 sun4v". Most other devices of the same version work, just not two of them.
When I click on the chart, I get the Ports page and a bigger version of the same chart. Selecting "RRD Command" produces this below the pink box:
Description Device total traffic in bits/sec.
Performance & Output RRDTool Output: ERROR: can not parse an empty rpn expression RRDtool Runtime: 0.011s | Total time: 0.012s
RRDTool Command /usr/bin/rrdtool graph /tmp/DZSTkOrAZmZQeckq.png -g -Y --alt-autoscale --rigid --start 1603133061 --end 1603219461 --width 1152 --height 300 -c BACK#EEEEEE00 -c SHADEA#EEEEEE00 -c SHADEB#EEEEEE00 -c FONT#000000 -c CANVAS#FFFFFF00 -c GRID#a5a5a5 -c MGRID#FF9999 -c FRAME#5e5e5e -c ARROW#5e5e5e -R normal --font LEGEND:8:'DroidSansMono,DejaVuSansMono' --font AXIS:7:'DroidSansMono,DejaVuSansMono' --font-render-mode normal -E CDEF:inB= CDEF:outB= CDEF:octets=inB,outB,+ CDEF:doutB=outB,-1,* CDEF:inbits=inB,8,* CDEF:outbits=outB,8,* CDEF:bits=inbits,outbits,+ CDEF:doutbits=doutB,8,* VDEF:95thin=inbits,95,PERCENT VDEF:95thout=outbits,95,PERCENT CDEF:pout_tmp=doutbits,-1,* VDEF:dpout_tmp=pout_tmp,95,PERCENT CDEF:dpout_tmp2=doutbits,doutbits,-,dpout_tmp,-1,*,+ VDEF:d95thout=dpout_tmp2,FIRST VDEF:totin=inB,TOTAL VDEF:avein=inbits,AVERAGE VDEF:totout=outB,TOTAL VDEF:aveout=outbits,AVERAGE VDEF:tot=octets,TOTAL COMMENT:' \l' HRULE:999999999999999#FFFFFF:'Total Rx' GPRINT:inbits:LAST:%6.2lf%s GPRINT:inbits:AVERAGE:%6.2lf%s GPRINT:inbits:MIN:%6.2lf%s GPRINT:inbits:MAX:%6.2lf%s GPRINT:totin:%6.2lf%sB COMMENT:'\l' HRULE:999999999999999#FFFFFF:' Tx' GPRINT:outbits:LAST:%6.2lf%s GPRINT:outbits:AVERAGE:%6.2lf%s GPRINT:outbits:MIN:%6.2lf%s GPRINT:outbits:MAX:%6.2lf%s GPRINT:totout:%6.2lf%sB COMMENT:'\l' HRULE:999999999999999#FFFFFF:' Agg' GPRINT:bits:LAST:%6.2lf%s GPRINT:bits:AVERAGE:%6.2lf%s GPRINT:bits:MIN:%6.2lf%s GPRINT:bits:MAX:%6.2lf%s GPRINT:tot:%6.2lf%sB COMMENT:'\l' HRULE:0#999999
RRDTool Files Used /opt/observium/rrd/<hostname>/port-2.rrd /opt/observium/rrd/<hostname>/port-1.rrd
Would someone please give me a place to start looking for the problem?
Thanks!
observium mailing list
observium@observium.orgmailto:observium@observium.org
http://postman.memetic.org/cgi-bin/mailman/listinfo/observium
participants (3)
-
 Adam Armstrong
 -
 McGregor, Kevin
 -
 Tom Laermans