Alerting on high 'used' RAM, not counting 'cached'

Hi,
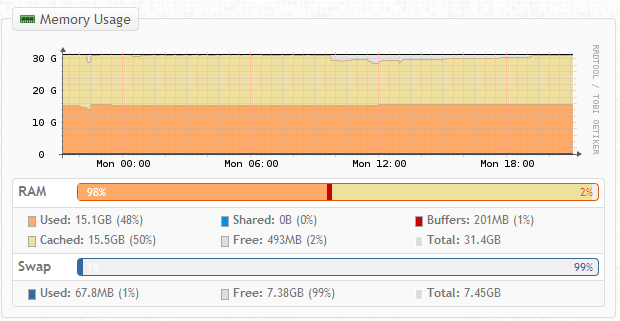
Having my first experiment with the new alerting features - very nice! There is one thing I can’t seem to get quite right which is how to alert for Linux system when the ‘used’ RAM is greater than, say, 90% - which is best explained with an example of a device which looks like this:
[cid:image001.png@01CF5826.67DDE2B0]
Which shows that ‘used’ is 15.1GB (48%). However, for the purposes of alerting, if you use the mempool_perc gt 80 it alarms as being 98%. So I can’t specify ‘used’ as a pool because the only pools are “Swap Space”, “Virtual Memory”, “Physical Memory” etc. There isn’t one which is specifically the ‘used’ RAM element.
So, is there a way around this or something I can tweak to get the desired result? Or what is everyone else doing to get alerting for linux boxes like this working for high RAM?
Cheers guys!
Robert Williams Custodian Data Centre Email: Robert@CustodianDC.com http://www.CustodianDC.com

There isn't really a way to solve this at the moment, but if anyone has any ideas...
adam.
On 2014-04-14 15:19, Robert Williams wrote:
Hi,
Having my first experiment with the new alerting features - very nice! There is one thing I can’t seem to get quite right which is how to alert for Linux system when the ‘used’ RAM is greater than, say, 90% - which is best explained with an example of a device which looks like this:
Which shows that ‘used’ is 15.1GB (48%). However, for the purposes of alerting, if you use the MEMPOOL_PERC GT 80 it alarms as being 98%. So I can’t specify ‘used’ as a pool because the only pools are “Swap Space”, “Virtual Memory”, “Physical Memory” etc. There isn’t one which is specifically the ‘used’ RAM element.
So, is there a way around this or something I can tweak to get the desired result? Or what is everyone else doing to get alerting for linux boxes like this working for high RAM?
Cheers guys!
Robert Williams Custodian Data Centre Email: Robert@CustodianDC.com http://www.CustodianDC.com
observium mailing list observium@observium.org http://postman.memetic.org/cgi-bin/mailman/listinfo/observium

Hi,
not sure that cached memory should be used in alerting, because actually it is potentially free memory (released when needed). http://www.quora.com/What-is-the-difference-between-Buffers-and-Cached-colum...
For buffers similarly.
On Tue, Apr 15, 2014 at 12:19 AM, Robert Williams Robert@custodiandc.comwrote:
Hi,
Having my first experiment with the new alerting features - very nice! There is one thing I can’t seem to get quite right which is how to alert for Linux system when the ‘used’ RAM is greater than, say, 90% - which is best explained with an example of a device which looks like this:
Which shows that ‘used’ is 15.1GB (48%). However, for the purposes of alerting, if you use the *mempool_perc gt 80* it alarms as being 98%. So I can’t specify ‘used’ as a pool because the only pools are “Swap Space”, “Virtual Memory”, “Physical Memory” etc. There isn’t one which is specifically the ‘used’ RAM element.
So, is there a way around this or something I can tweak to get the desired result? Or what is everyone else doing to get alerting for linux boxes like this working for high RAM?
Cheers guys!
Robert Williams Custodian Data Centre Email: Robert@CustodianDC.com http://www.CustodianDC.com
observium mailing list observium@observium.org http://postman.memetic.org/cgi-bin/mailman/listinfo/observium
participants (3)
-
 Adam Armstrong
 -
 Mike Stupalov
 -
 Robert Williams