Get more information on Dashboard for Process consumption

I have been using observium for few months now. I wanted some info from the graphs that observium spins off.
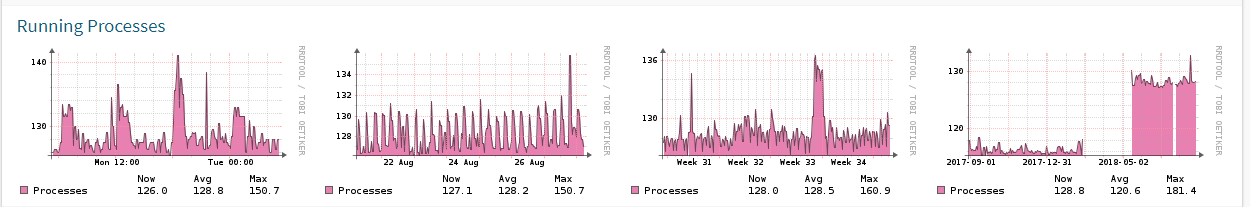
Following is the graphs for running process consumption:
[cid:image001.png@01D43EAC.03C3D610]
Can I get something like top 10 process graphs?
Let me give you an example, I sometimes get requests from folks asking, "Ok my memory utilization on a server ABC was 90% on this particular day. Can we get list of processes consuming high memory on that particular day ? "
So as per this, can I customize the graph to get process level info ?
Kaustubh Parthasarthy Analyst, Production Management Group D +91 20 6646 8625 | M +91 989 284 4625 | T +91 20 6646 8888 4/F, C-Wing, Panchshil Tech Park-1, Yerawada, Pune 411006, India
[:1. Social Media Icons:CLSA_Social Media Icons_linkedin.png]https://hk.linkedin.com/company/clsa[:1. Social Media Icons:CLSA_Social Media Icons_twitter.png]https://twitter.com/clsainsights?lang=en[:1. Social Media Icons:CLSA_Social Media Icons_youtube.png]https://www.youtube.com/channel/UC0qWp_lLnOcRYmBlCNQgZKA[:1. Social Media Icons:CLSA_Social Media Icons_facebook.png]https://www.facebook.com/clsacommunity/
clsa.comhttps://www.clsa.com/ Insights. Liquidity. Capital.
[CLSA_RGB]https://www.clsa.com/member
A CITIC Securities Company
The content of this communication is intended for the recipient and is subject to CLSA Legal and Regulatory Notices. These can be viewed at https://www.clsa.com/disclaimer.html or sent to you upon request. Please consider before printing. CLSA is ISO14001 certified and committed to reducing its impact on the environment.

Hi,
We don't currently collect per-process statistics.
adam. On 2018-08-28 04:34:55, Kaustubh Parthasarthy, CLSA kaustubh.parthasarthy@clsa.com wrote: I have been using observium for few months now. I wanted some info from the graphs that observium spins off. Following is the graphs for running process consumption: Can I get something like top 10 process graphs? Let me give you an example, I sometimes get requests from folks asking, “Ok my memory utilization on a server ABC was 90% on this particular day. Can we get list of processes consuming high memory on that particular day ? “ So as per this, can I customize the graph to get process level info ? Kaustubh Parthasarthy Analyst, Production Management Group D +91 20 6646 8625 | M +91 989 284 4625 | T +91 20 6646 8888 4/F, C-Wing, Panchshil Tech Park-1, Yerawada, Pune 411006, India [:1. Social Media Icons:CLSA_Social Media Icons_linkedin.png] [https://hk.linkedin.com/company/clsa] [:1. Social Media Icons:CLSA_Social Media Icons_twitter.png] [https://twitter.com/clsainsights?lang=en] [:1. Social Media Icons:CLSA_Social Media Icons_youtube.png] [https://www.youtube.com/channel/UC0qWp_lLnOcRYmBlCNQgZKA] [:1. Social Media Icons:CLSA_Social Media Icons_facebook.png] [https://www.facebook.com/clsacommunity/] clsa.com [https://www.clsa.com/] Insights. Liquidity. Capital. [CLSA_RGB] [https://www.clsa.com/member] A CITIC Securities Company The content of this communication is intended for the recipient and is subject to CLSA Legal and Regulatory Notices. These can be viewed at https://www.clsa.com/disclaimer.html [https://www.clsa.com/disclaimer.html] or sent to you upon request. Please consider before printing. CLSA is ISO14001 certified and committed to reducing its impact on the environment.
Ok,
Can you let me know what script observium uses to pull the performance data ? There has to be script which is running on the system correct.
Regards Kaustubh
From: observium [mailto:observium-bounces@observium.org] On Behalf Of Adam Armstrong Sent: Tuesday, August 28, 2018 6:45 PM To: observium@observium.org Subject: Re: [Observium] Get more information on Dashboard for Process consumption
Hi,
We don't currently collect per-process statistics.
adam.
On 2018-08-28 04:34:55, Kaustubh Parthasarthy, CLSA kaustubh.parthasarthy@clsa.com wrote: I have been using observium for few months now. I wanted some info from the graphs that observium spins off.
Following is the graphs for running process consumption:
[cid:image001.png@01D43EAC.03C3D610]
Can I get something like top 10 process graphs?
Let me give you an example, I sometimes get requests from folks asking, “Ok my memory utilization on a server ABC was 90% on this particular day. Can we get list of processes consuming high memory on that particular day ? “
So as per this, can I customize the graph to get process level info ?
Kaustubh Parthasarthy Analyst, Production Management Group D +91 20 6646 8625 | M +91 989 284 4625 | T +91 20 6646 8888 4/F, C-Wing, Panchshil Tech Park-1, Yerawada, Pune 411006, India
[:1. Social Media Icons:CLSA_Social Media Icons_linkedin.png]https://hk.linkedin.com/company/clsa[:1. Social Media Icons:CLSA_Social Media Icons_twitter.png]https://twitter.com/clsainsights?lang=en[:1. Social Media Icons:CLSA_Social Media Icons_youtube.png]https://www.youtube.com/channel/UC0qWp_lLnOcRYmBlCNQgZKA[:1. Social Media Icons:CLSA_Social Media Icons_facebook.png]https://www.facebook.com/clsacommunity/
clsa.comhttps://www.clsa.com/ Insights. Liquidity. Capital.
[CLSA_RGB]https://www.clsa.com/member
A CITIC Securities Company
The content of this communication is intended for the recipient and is subject to CLSA Legal and Regulatory Notices. These can be viewed at https://www.clsa.com/disclaimer.html or sent to you upon request. Please consider before printing. CLSA is ISO14001 certified and committed to reducing its impact on the environment. The content of this communication is intended for the recipient and is subject to CLSA Legal and Regulatory Notices. These can be viewed at https://www.clsa.com/disclaimer.html or sent to you upon request. Please consider before printing. CLSA is ISO14001 certified and committed to reducing its impact on the environment.
There is no script. These are counters pulled from either HOST-RESOURCES-MIB or UCD-MIB via SNMP.
adam. On 2018-08-29 04:09:55, Kaustubh Parthasarthy, CLSA kaustubh.parthasarthy@clsa.com wrote: Ok, Can you let me know what script observium uses to pull the performance data ? There has to be script which is running on the system correct.
Regards Kaustubh From: observium [mailto:observium-bounces@observium.org] On Behalf Of Adam Armstrong Sent: Tuesday, August 28, 2018 6:45 PM To: observium@observium.org Subject: Re: [Observium] Get more information on Dashboard for Process consumption Hi, We don't currently collect per-process statistics. adam. On 2018-08-28 04:34:55, Kaustubh Parthasarthy, CLSA kaustubh.parthasarthy@clsa.com wrote: I have been using observium for few months now. I wanted some info from the graphs that observium spins off. Following is the graphs for running process consumption: Can I get something like top 10 process graphs? Let me give you an example, I sometimes get requests from folks asking, “Ok my memory utilization on a server ABC was 90% on this particular day. Can we get list of processes consuming high memory on that particular day ? “ So as per this, can I customize the graph to get process level info ? Kaustubh Parthasarthy Analyst, Production Management Group D +91 20 6646 8625 | M +91 989 284 4625 | T +91 20 6646 8888 4/F, C-Wing, Panchshil Tech Park-1, Yerawada, Pune 411006, India [:1. Social Media Icons:CLSA_Social Media Icons_linkedin.png] [https://hk.linkedin.com/company/clsa] [:1. Social Media Icons:CLSA_Social Media Icons_twitter.png] [https://twitter.com/clsainsights?lang=en] [:1. Social Media Icons:CLSA_Social Media Icons_youtube.png] [https://www.youtube.com/channel/UC0qWp_lLnOcRYmBlCNQgZKA] [:1. Social Media Icons:CLSA_Social Media Icons_facebook.png] [https://www.facebook.com/clsacommunity/] clsa.com [https://www.clsa.com/] Insights. Liquidity. Capital. [CLSA_RGB] [https://www.clsa.com/member] A CITIC Securities Company The content of this communication is intended for the recipient and is subject to CLSA Legal and Regulatory Notices. These can be viewed at https://www.clsa.com/disclaimer.html [https://www.clsa.com/disclaimer.html] or sent to you upon request. Please consider before printing. CLSA is ISO14001 certified and committed to reducing its impact on the environment. The content of this communication is intended for the recipient and is subject to CLSA Legal and Regulatory Notices. These can be viewed at https://www.clsa.com/disclaimer.html [https://www.clsa.com/disclaimer.html] or sent to you upon request. Please consider before printing. CLSA is ISO14001 certified and committed to reducing its impact on the environment.
I found the poller-wrapper.py script
Was thinking if I can do some customization on this script. Can you experts please suggest something
Regards Kaustubh
From: observium [mailto:observium-bounces@observium.org] On Behalf Of Adam Armstrong Sent: Wednesday, August 29, 2018 9:14 AM To: observium@observium.org Subject: Re: [Observium] Get more information on Dashboard for Process consumption
There is no script. These are counters pulled from either HOST-RESOURCES-MIB or UCD-MIB via SNMP.
adam.
On 2018-08-29 04:09:55, Kaustubh Parthasarthy, CLSA kaustubh.parthasarthy@clsa.com wrote: Ok,
Can you let me know what script observium uses to pull the performance data ? There has to be script which is running on the system correct.
Regards Kaustubh
From: observium [mailto:observium-bounces@observium.org] On Behalf Of Adam Armstrong Sent: Tuesday, August 28, 2018 6:45 PM To: observium@observium.org Subject: Re: [Observium] Get more information on Dashboard for Process consumption
Hi,
We don't currently collect per-process statistics.
adam.
On 2018-08-28 04:34:55, Kaustubh Parthasarthy, CLSA kaustubh.parthasarthy@clsa.com wrote: I have been using observium for few months now. I wanted some info from the graphs that observium spins off.
Following is the graphs for running process consumption:
[cid:image001.png@01D43EAC.03C3D610]
Can I get something like top 10 process graphs?
Let me give you an example, I sometimes get requests from folks asking, “Ok my memory utilization on a server ABC was 90% on this particular day. Can we get list of processes consuming high memory on that particular day ? “
So as per this, can I customize the graph to get process level info ?
Kaustubh Parthasarthy Analyst, Production Management Group D +91 20 6646 8625 | M +91 989 284 4625 | T +91 20 6646 8888 4/F, C-Wing, Panchshil Tech Park-1, Yerawada, Pune 411006, India
[:1. Social Media Icons:CLSA_Social Media Icons_linkedin.png]https://hk.linkedin.com/company/clsa[:1. Social Media Icons:CLSA_Social Media Icons_twitter.png]https://twitter.com/clsainsights?lang=en[:1. Social Media Icons:CLSA_Social Media Icons_youtube.png]https://www.youtube.com/channel/UC0qWp_lLnOcRYmBlCNQgZKA[:1. Social Media Icons:CLSA_Social Media Icons_facebook.png]https://www.facebook.com/clsacommunity/
clsa.comhttps://www.clsa.com/ Insights. Liquidity. Capital.
[CLSA_RGB]https://www.clsa.com/member
A CITIC Securities Company
The content of this communication is intended for the recipient and is subject to CLSA Legal and Regulatory Notices. These can be viewed at https://www.clsa.com/disclaimer.html or sent to you upon request. Please consider before printing. CLSA is ISO14001 certified and committed to reducing its impact on the environment.
The content of this communication is intended for the recipient and is subject to CLSA Legal and Regulatory Notices. These can be viewed at https://www.clsa.com/disclaimer.html or sent to you upon request. Please consider before printing. CLSA is ISO14001 certified and committed to reducing its impact on the environment. The content of this communication is intended for the recipient and is subject to CLSA Legal and Regulatory Notices. These can be viewed at https://www.clsa.com/disclaimer.html or sent to you upon request. Please consider before printing. CLSA is ISO14001 certified and committed to reducing its impact on the environment.
# write into db current process info
p_query = """INSERT INTO `observium_processes` (`process_pid`,`process_ppid`,`process_name`,`process_uid`,`process_command`,`process_start`,`device_id`)
VALUES (%s,%s,%s,%s,%s,%s,'0')"""
try:
cursor.execute(p_query, (pid,ppid,scriptname,uid,command,s_time))
process_id = db.insert_id()
db.commit()
except:
pass
Can I leverage the above for process level info ?
Regards Kaustubh
From: Kaustubh Parthasarthy, CLSA Sent: Wednesday, August 29, 2018 10:32 AM To: observium@observium.org Subject: RE: [Observium] Get more information on Dashboard for Process consumption
I found the poller-wrapper.py script
Was thinking if I can do some customization on this script. Can you experts please suggest something
Regards Kaustubh
From: observium [mailto:observium-bounces@observium.org] On Behalf Of Adam Armstrong Sent: Wednesday, August 29, 2018 9:14 AM To: observium@observium.org Subject: Re: [Observium] Get more information on Dashboard for Process consumption
There is no script. These are counters pulled from either HOST-RESOURCES-MIB or UCD-MIB via SNMP.
adam.
On 2018-08-29 04:09:55, Kaustubh Parthasarthy, CLSA kaustubh.parthasarthy@clsa.com wrote: Ok,
Can you let me know what script observium uses to pull the performance data ? There has to be script which is running on the system correct.
Regards Kaustubh
From: observium [mailto:observium-bounces@observium.org] On Behalf Of Adam Armstrong Sent: Tuesday, August 28, 2018 6:45 PM To: observium@observium.org Subject: Re: [Observium] Get more information on Dashboard for Process consumption
Hi,
We don't currently collect per-process statistics.
adam.
On 2018-08-28 04:34:55, Kaustubh Parthasarthy, CLSA kaustubh.parthasarthy@clsa.com wrote: I have been using observium for few months now. I wanted some info from the graphs that observium spins off.
Following is the graphs for running process consumption:
[cid:image001.png@01D43EAC.03C3D610]
Can I get something like top 10 process graphs?
Let me give you an example, I sometimes get requests from folks asking, “Ok my memory utilization on a server ABC was 90% on this particular day. Can we get list of processes consuming high memory on that particular day ? “
So as per this, can I customize the graph to get process level info ?
Kaustubh Parthasarthy Analyst, Production Management Group D +91 20 6646 8625 | M +91 989 284 4625 | T +91 20 6646 8888 4/F, C-Wing, Panchshil Tech Park-1, Yerawada, Pune 411006, India
[:1. Social Media Icons:CLSA_Social Media Icons_linkedin.png]https://hk.linkedin.com/company/clsa[:1. Social Media Icons:CLSA_Social Media Icons_twitter.png]https://twitter.com/clsainsights?lang=en[:1. Social Media Icons:CLSA_Social Media Icons_youtube.png]https://www.youtube.com/channel/UC0qWp_lLnOcRYmBlCNQgZKA[:1. Social Media Icons:CLSA_Social Media Icons_facebook.png]https://www.facebook.com/clsacommunity/
clsa.comhttps://www.clsa.com/ Insights. Liquidity. Capital.
[CLSA_RGB]https://www.clsa.com/member
A CITIC Securities Company
The content of this communication is intended for the recipient and is subject to CLSA Legal and Regulatory Notices. These can be viewed at https://www.clsa.com/disclaimer.html or sent to you upon request. Please consider before printing. CLSA is ISO14001 certified and committed to reducing its impact on the environment.
The content of this communication is intended for the recipient and is subject to CLSA Legal and Regulatory Notices. These can be viewed at https://www.clsa.com/disclaimer.html or sent to you upon request. Please consider before printing. CLSA is ISO14001 certified and committed to reducing its impact on the environment. The content of this communication is intended for the recipient and is subject to CLSA Legal and Regulatory Notices. These can be viewed at https://www.clsa.com/disclaimer.html or sent to you upon request. Please consider before printing. CLSA is ISO14001 certified and committed to reducing its impact on the environment.

What exactly is it that you are trying to accomplish here?
/Markus
Den ons 29 aug. 2018 kl 07:04 skrev Kaustubh Parthasarthy, CLSA < kaustubh.parthasarthy@clsa.com>:
# write into db current process info
p_query = """INSERT INTO `observium_processes` (`process_pid`,`process_ppid`,`process_name`,`process_uid`,`process_command`,`process_start`,`device_id`)
VALUES (%s,%s,%s,%s,%s,%s,'0')"""try:
cursor.execute(p_query, (pid,ppid,scriptname,uid,command,s_time))
process_id = db.insert_id()
db.commit()
except:
pass
Can I leverage the above for process level info ?
Regards
Kaustubh
*From:* Kaustubh Parthasarthy, CLSA *Sent:* Wednesday, August 29, 2018 10:32 AM *To:* observium@observium.org *Subject:* RE: [Observium] Get more information on Dashboard for Process consumption
I found the poller-wrapper.py script
Was thinking if I can do some customization on this script. Can you experts please suggest something
Regards
Kaustubh
*From:* observium [mailto:observium-bounces@observium.org] *On Behalf Of *Adam Armstrong *Sent:* Wednesday, August 29, 2018 9:14 AM *To:* observium@observium.org *Subject:* Re: [Observium] Get more information on Dashboard for Process consumption
There is no script. These are counters pulled from either HOST-RESOURCES-MIB or UCD-MIB via SNMP.
adam.
On 2018-08-29 04:09:55, Kaustubh Parthasarthy, CLSA < kaustubh.parthasarthy@clsa.com> wrote:
Ok,
Can you let me know what script observium uses to pull the performance data ? There has to be script which is running on the system correct.
Regards
Kaustubh
*From:* observium [mailto:observium-bounces@observium.org] *On Behalf Of *Adam Armstrong *Sent:* Tuesday, August 28, 2018 6:45 PM *To:* observium@observium.org *Subject:* Re: [Observium] Get more information on Dashboard for Process consumption
Hi,
We don't currently collect per-process statistics.
adam.
On 2018-08-28 04:34:55, Kaustubh Parthasarthy, CLSA < kaustubh.parthasarthy@clsa.com> wrote:
I have been using observium for few months now. I wanted some info from the graphs that observium spins off.
Following is the graphs for running process consumption:
Can I get something like top 10 process graphs?
Let me give you an example, I sometimes get requests from folks asking, “*Ok my memory utilization on a server ABC was 90% on this particular day. Can we get list of processes consuming high memory on that particular day ? *“
So as per this, can I customize the graph to get process level info ?
*Kaustubh Parthasarthy*
*Analyst, Production Management Group*
D +91 20 6646 8625 | M +91 989 284 4625 | T +91 20 6646 8888
4/F, C-Wing, Panchshil Tech Park-1, Yerawada, Pune 411006, India
[image: :1. Social Media Icons:CLSA_Social Media Icons_linkedin.png] https://hk.linkedin.com/company/clsa[image: :1. Social Media Icons:CLSA_Social Media Icons_twitter.png] https://twitter.com/clsainsights?lang=en[image: :1. Social Media Icons:CLSA_Social Media Icons_youtube.png] https://www.youtube.com/channel/UC0qWp_lLnOcRYmBlCNQgZKA[image: :1. Social Media Icons:CLSA_Social Media Icons_facebook.png] https://www.facebook.com/clsacommunity/
*clsa.com* https://www.clsa.com/
*Insights. Liquidity. Capital. *
[image: CLSA_RGB] https://www.clsa.com/member
*A CITIC Securities Company*
The content of this communication is intended for the recipient and is subject to CLSA Legal and Regulatory Notices. These can be viewed at https://www.clsa.com/disclaimer.html or sent to you upon request. Please consider before printing. CLSA is ISO14001 certified and committed to reducing its impact on the environment.
The content of this communication is intended for the recipient and is subject to CLSA Legal and Regulatory Notices. These can be viewed at https://www.clsa.com/disclaimer.html or sent to you upon request. Please consider before printing. CLSA is ISO14001 certified and committed to reducing its impact on the environment.
The content of this communication is intended for the recipient and is subject to CLSA Legal and Regulatory Notices. These can be viewed at https://www.clsa.com/disclaimer.html or sent to you upon request. Please consider before printing. CLSA is ISO14001 certified and committed to reducing its impact on the environment. _______________________________________________ observium mailing list observium@observium.org http://postman.memetic.org/cgi-bin/mailman/listinfo/observium
I am trying to get the process level information through observium.
Hence I am trying to leverage the script or if there is anything else you guys can assist me or guide me to.
Regards Kaustubh
From: observium [mailto:observium-bounces@observium.org] On Behalf Of Markus Klock Sent: Wednesday, August 29, 2018 12:29 PM To: Observium Network Observation System Subject: Re: [Observium] Get more information on Dashboard for Process consumption
What exactly is it that you are trying to accomplish here?
/Markus
Den ons 29 aug. 2018 kl 07:04 skrev Kaustubh Parthasarthy, CLSA <kaustubh.parthasarthy@clsa.commailto:kaustubh.parthasarthy@clsa.com>:
# write into db current process info
p_query = """INSERT INTO `observium_processes` (`process_pid`,`process_ppid`,`process_name`,`process_uid`,`process_command`,`process_start`,`device_id`)
VALUES (%s,%s,%s,%s,%s,%s,'0')"""
try:
cursor.execute(p_query, (pid,ppid,scriptname,uid,command,s_time))
process_id = db.insert_id()
db.commit()
except:
pass
Can I leverage the above for process level info ?
Regards Kaustubh
From: Kaustubh Parthasarthy, CLSA Sent: Wednesday, August 29, 2018 10:32 AM To: observium@observium.orgmailto:observium@observium.org Subject: RE: [Observium] Get more information on Dashboard for Process consumption
I found the poller-wrapper.py script
Was thinking if I can do some customization on this script. Can you experts please suggest something
Regards Kaustubh
From: observium [mailto:observium-bounces@observium.orgmailto:observium-bounces@observium.org] On Behalf Of Adam Armstrong Sent: Wednesday, August 29, 2018 9:14 AM To: observium@observium.orgmailto:observium@observium.org Subject: Re: [Observium] Get more information on Dashboard for Process consumption
There is no script. These are counters pulled from either HOST-RESOURCES-MIB or UCD-MIB via SNMP.
adam.
On 2018-08-29 04:09:55, Kaustubh Parthasarthy, CLSA <kaustubh.parthasarthy@clsa.commailto:kaustubh.parthasarthy@clsa.com> wrote: Ok,
Can you let me know what script observium uses to pull the performance data ? There has to be script which is running on the system correct.
Regards Kaustubh
From: observium [mailto:observium-bounces@observium.orgmailto:observium-bounces@observium.org] On Behalf Of Adam Armstrong Sent: Tuesday, August 28, 2018 6:45 PM To: observium@observium.orgmailto:observium@observium.org Subject: Re: [Observium] Get more information on Dashboard for Process consumption
Hi,
We don't currently collect per-process statistics.
adam.
On 2018-08-28 04:34:55, Kaustubh Parthasarthy, CLSA <kaustubh.parthasarthy@clsa.commailto:kaustubh.parthasarthy@clsa.com> wrote: I have been using observium for few months now. I wanted some info from the graphs that observium spins off.
Following is the graphs for running process consumption:
Error! Filename not specified.
Can I get something like top 10 process graphs?
Let me give you an example, I sometimes get requests from folks asking, “Ok my memory utilization on a server ABC was 90% on this particular day. Can we get list of processes consuming high memory on that particular day ? “
So as per this, can I customize the graph to get process level info ?
Kaustubh Parthasarthy Analyst, Production Management Group D +91 20 6646 8625 | M +91 989 284 4625 | T +91 20 6646 8888 4/F, C-Wing, Panchshil Tech Park-1, Yerawada, Pune 411006, India
Error! Filename not specified.https://hk.linkedin.com/company/clsaError! Filename not specified.https://twitter.com/clsainsights?lang=enError! Filename not specified.https://www.youtube.com/channel/UC0qWp_lLnOcRYmBlCNQgZKAError! Filename not specified.https://www.facebook.com/clsacommunity/
clsa.comhttps://www.clsa.com/ Insights. Liquidity. Capital.
Error! Filename not specified.https://www.clsa.com/member
A CITIC Securities Company
The content of this communication is intended for the recipient and is subject to CLSA Legal and Regulatory Notices. These can be viewed at https://www.clsa.com/disclaimer.html or sent to you upon request. Please consider before printing. CLSA is ISO14001 certified and committed to reducing its impact on the environment.
The content of this communication is intended for the recipient and is subject to CLSA Legal and Regulatory Notices. These can be viewed at https://www.clsa.com/disclaimer.html or sent to you upon request. Please consider before printing. CLSA is ISO14001 certified and committed to reducing its impact on the environment.
The content of this communication is intended for the recipient and is subject to CLSA Legal and Regulatory Notices. These can be viewed at https://www.clsa.com/disclaimer.html or sent to you upon request. Please consider before printing. CLSA is ISO14001 certified and committed to reducing its impact on the environment. _______________________________________________ observium mailing list observium@observium.orgmailto:observium@observium.org http://postman.memetic.org/cgi-bin/mailman/listinfo/observium The content of this communication is intended for the recipient and is subject to CLSA Legal and Regulatory Notices. These can be viewed at https://www.clsa.com/disclaimer.html or sent to you upon request. Please consider before printing. CLSA is ISO14001 certified and committed to reducing its impact on the environment.
Process level information from the server that is running Observium? Have you checked out the process-list in the web-gui? Go to Observium and the cog-wheel at the top right, click on "process list"
/Markus
Den ons 29 aug. 2018 kl 09:01 skrev Kaustubh Parthasarthy, CLSA < kaustubh.parthasarthy@clsa.com>:
I am trying to get the process level information through observium.
Hence I am trying to leverage the script or if there is anything else you guys can assist me or guide me to.
Regards
Kaustubh
*From:* observium [mailto:observium-bounces@observium.org] *On Behalf Of *Markus Klock *Sent:* Wednesday, August 29, 2018 12:29 PM *To:* Observium Network Observation System *Subject:* Re: [Observium] Get more information on Dashboard for Process consumption
What exactly is it that you are trying to accomplish here?
/Markus
Den ons 29 aug. 2018 kl 07:04 skrev Kaustubh Parthasarthy, CLSA < kaustubh.parthasarthy@clsa.com>:
# write into db current process info
p_query = """INSERT INTO `observium_processes` (`process_pid`,`process_ppid`,`process_name`,`process_uid`,`process_command`,`process_start`,`device_id`)
VALUES (%s,%s,%s,%s,%s,%s,'0')"""try:
cursor.execute(p_query, (pid,ppid,scriptname,uid,command,s_time))
process_id = db.insert_id()
db.commit()
except:
pass
Can I leverage the above for process level info ?
Regards
Kaustubh
*From:* Kaustubh Parthasarthy, CLSA *Sent:* Wednesday, August 29, 2018 10:32 AM *To:* observium@observium.org *Subject:* RE: [Observium] Get more information on Dashboard for Process consumption
I found the poller-wrapper.py script
Was thinking if I can do some customization on this script. Can you experts please suggest something
Regards
Kaustubh
*From:* observium [mailto:observium-bounces@observium.org] *On Behalf Of *Adam Armstrong *Sent:* Wednesday, August 29, 2018 9:14 AM *To:* observium@observium.org *Subject:* Re: [Observium] Get more information on Dashboard for Process consumption
There is no script. These are counters pulled from either HOST-RESOURCES-MIB or UCD-MIB via SNMP.
adam.
On 2018-08-29 04:09:55, Kaustubh Parthasarthy, CLSA < kaustubh.parthasarthy@clsa.com> wrote:
Ok,
Can you let me know what script observium uses to pull the performance data ? There has to be script which is running on the system correct.
Regards
Kaustubh
*From:* observium [mailto:observium-bounces@observium.org] *On Behalf Of *Adam Armstrong *Sent:* Tuesday, August 28, 2018 6:45 PM *To:* observium@observium.org *Subject:* Re: [Observium] Get more information on Dashboard for Process consumption
Hi,
We don't currently collect per-process statistics.
adam.
On 2018-08-28 04:34:55, Kaustubh Parthasarthy, CLSA < kaustubh.parthasarthy@clsa.com> wrote:
I have been using observium for few months now. I wanted some info from the graphs that observium spins off.
Following is the graphs for running process consumption:
*Error! Filename not specified.*
Can I get something like top 10 process graphs?
Let me give you an example, I sometimes get requests from folks asking, “*Ok my memory utilization on a server ABC was 90% on this particular day. Can we get list of processes consuming high memory on that particular day ? *“
So as per this, can I customize the graph to get process level info ?
*Kaustubh Parthasarthy*
*Analyst, Production Management Group*
D +91 20 6646 8625 | M +91 989 284 4625 | T +91 20 6646 8888
4/F, C-Wing, Panchshil Tech Park-1, Yerawada, Pune 411006, India
*Error! Filename not specified.* https://hk.linkedin.com/company/clsa*Error! Filename not specified.* https://twitter.com/clsainsights?lang=en*Error! Filename not specified.* https://www.youtube.com/channel/UC0qWp_lLnOcRYmBlCNQgZKA*Error! Filename not specified.* https://www.facebook.com/clsacommunity/
*clsa.com* https://www.clsa.com/
*Insights. Liquidity. Capital. *
*Error! Filename not specified.* https://www.clsa.com/member
*A CITIC Securities Company*
The content of this communication is intended for the recipient and is subject to CLSA Legal and Regulatory Notices. These can be viewed at https://www.clsa.com/disclaimer.html or sent to you upon request. Please consider before printing. CLSA is ISO14001 certified and committed to reducing its impact on the environment.
The content of this communication is intended for the recipient and is subject to CLSA Legal and Regulatory Notices. These can be viewed at https://www.clsa.com/disclaimer.html or sent to you upon request. Please consider before printing. CLSA is ISO14001 certified and committed to reducing its impact on the environment.
The content of this communication is intended for the recipient and is subject to CLSA Legal and Regulatory Notices. These can be viewed at https://www.clsa.com/disclaimer.html or sent to you upon request. Please consider before printing. CLSA is ISO14001 certified and committed to reducing its impact on the environment.
observium mailing list observium@observium.org http://postman.memetic.org/cgi-bin/mailman/listinfo/observium
The content of this communication is intended for the recipient and is subject to CLSA Legal and Regulatory Notices. These can be viewed at https://www.clsa.com/disclaimer.html or sent to you upon request. Please consider before printing. CLSA is ISO14001 certified and committed to reducing its impact on the environment. _______________________________________________ observium mailing list observium@observium.org http://postman.memetic.org/cgi-bin/mailman/listinfo/observium
Hi Marcus,
Actually not this: Process level information from the server that is running Observium?
I will give my use case again.
Following is the graphs for running process consumption: [cid:image001.png@01D43EAC.03C3D610]
But this graph does not show me what processes are consuming the load like lets say “java” process or something on the graph. Let me give you an example, I sometimes get requests from folks asking, “Ok my memory utilization on a server ABC was 90% on this particular day. Can we get list of processes consuming high memory on that particular day ? “
So as per this, can I customize the graph to get process level info ?
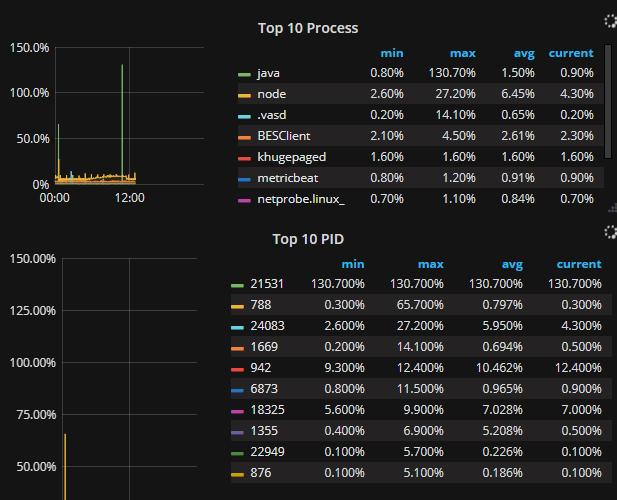
Example below is an graph which is giving top 10 processes consuming the cpu/memory utilization or the top 10 Process ID: [cid:image002.png@01D43F98.507BB350]
Hence wanted to know can I customize observium graphs to display something like the above screenshot (Obviously look and feel will change) but to get the top process consumption data.
Regards Kaustubh
From: observium [mailto:observium-bounces@observium.org] On Behalf Of Markus Klock Sent: Wednesday, August 29, 2018 12:51 PM To: Observium Network Observation System Subject: Re: [Observium] Get more information on Dashboard for Process consumption
Process level information from the server that is running Observium? Have you checked out the process-list in the web-gui? Go to Observium and the cog-wheel at the top right, click on "process list"
/Markus
Den ons 29 aug. 2018 kl 09:01 skrev Kaustubh Parthasarthy, CLSA <kaustubh.parthasarthy@clsa.commailto:kaustubh.parthasarthy@clsa.com>: I am trying to get the process level information through observium.
Hence I am trying to leverage the script or if there is anything else you guys can assist me or guide me to.
Regards Kaustubh
From: observium [mailto:observium-bounces@observium.orgmailto:observium-bounces@observium.org] On Behalf Of Markus Klock Sent: Wednesday, August 29, 2018 12:29 PM To: Observium Network Observation System Subject: Re: [Observium] Get more information on Dashboard for Process consumption
What exactly is it that you are trying to accomplish here?
/Markus
Den ons 29 aug. 2018 kl 07:04 skrev Kaustubh Parthasarthy, CLSA <kaustubh.parthasarthy@clsa.commailto:kaustubh.parthasarthy@clsa.com>:
# write into db current process info
p_query = """INSERT INTO `observium_processes` (`process_pid`,`process_ppid`,`process_name`,`process_uid`,`process_command`,`process_start`,`device_id`)
VALUES (%s,%s,%s,%s,%s,%s,'0')"""
try:
cursor.execute(p_query, (pid,ppid,scriptname,uid,command,s_time))
process_id = db.insert_id()
db.commit()
except:
pass
Can I leverage the above for process level info ?
Regards Kaustubh
From: Kaustubh Parthasarthy, CLSA Sent: Wednesday, August 29, 2018 10:32 AM To: observium@observium.orgmailto:observium@observium.org Subject: RE: [Observium] Get more information on Dashboard for Process consumption
I found the poller-wrapper.py script
Was thinking if I can do some customization on this script. Can you experts please suggest something
Regards Kaustubh
From: observium [mailto:observium-bounces@observium.orgmailto:observium-bounces@observium.org] On Behalf Of Adam Armstrong Sent: Wednesday, August 29, 2018 9:14 AM To: observium@observium.orgmailto:observium@observium.org Subject: Re: [Observium] Get more information on Dashboard for Process consumption
There is no script. These are counters pulled from either HOST-RESOURCES-MIB or UCD-MIB via SNMP.
adam.
On 2018-08-29 04:09:55, Kaustubh Parthasarthy, CLSA <kaustubh.parthasarthy@clsa.commailto:kaustubh.parthasarthy@clsa.com> wrote: Ok,
Can you let me know what script observium uses to pull the performance data ? There has to be script which is running on the system correct.
Regards Kaustubh
From: observium [mailto:observium-bounces@observium.orgmailto:observium-bounces@observium.org] On Behalf Of Adam Armstrong Sent: Tuesday, August 28, 2018 6:45 PM To: observium@observium.orgmailto:observium@observium.org Subject: Re: [Observium] Get more information on Dashboard for Process consumption
Hi,
We don't currently collect per-process statistics.
adam.
On 2018-08-28 04:34:55, Kaustubh Parthasarthy, CLSA <kaustubh.parthasarthy@clsa.commailto:kaustubh.parthasarthy@clsa.com> wrote: I have been using observium for few months now. I wanted some info from the graphs that observium spins off.
Following is the graphs for running process consumption:
Error! Filename not specified.
Can I get something like top 10 process graphs?
Let me give you an example, I sometimes get requests from folks asking, “Ok my memory utilization on a server ABC was 90% on this particular day. Can we get list of processes consuming high memory on that particular day ? “
So as per this, can I customize the graph to get process level info ?
Kaustubh Parthasarthy Analyst, Production Management Group D +91 20 6646 8625 | M +91 989 284 4625 | T +91 20 6646 8888 4/F, C-Wing, Panchshil Tech Park-1, Yerawada, Pune 411006, India
Error! Filename not specified.https://hk.linkedin.com/company/clsaError! Filename not specified.https://twitter.com/clsainsights?lang=enError! Filename not specified.https://www.youtube.com/channel/UC0qWp_lLnOcRYmBlCNQgZKAError! Filename not specified.https://www.facebook.com/clsacommunity/
clsa.comhttps://www.clsa.com/ Insights. Liquidity. Capital.
Error! Filename not specified.https://www.clsa.com/member
A CITIC Securities Company
The content of this communication is intended for the recipient and is subject to CLSA Legal and Regulatory Notices. These can be viewed at https://www.clsa.com/disclaimer.html or sent to you upon request. Please consider before printing. CLSA is ISO14001 certified and committed to reducing its impact on the environment.
The content of this communication is intended for the recipient and is subject to CLSA Legal and Regulatory Notices. These can be viewed at https://www.clsa.com/disclaimer.html or sent to you upon request. Please consider before printing. CLSA is ISO14001 certified and committed to reducing its impact on the environment.
The content of this communication is intended for the recipient and is subject to CLSA Legal and Regulatory Notices. These can be viewed at https://www.clsa.com/disclaimer.html or sent to you upon request. Please consider before printing. CLSA is ISO14001 certified and committed to reducing its impact on the environment. _______________________________________________ observium mailing list observium@observium.orgmailto:observium@observium.org http://postman.memetic.org/cgi-bin/mailman/listinfo/observium
The content of this communication is intended for the recipient and is subject to CLSA Legal and Regulatory Notices. These can be viewed at https://www.clsa.com/disclaimer.html or sent to you upon request. Please consider before printing. CLSA is ISO14001 certified and committed to reducing its impact on the environment. _______________________________________________ observium mailing list observium@observium.orgmailto:observium@observium.org http://postman.memetic.org/cgi-bin/mailman/listinfo/observium The content of this communication is intended for the recipient and is subject to CLSA Legal and Regulatory Notices. These can be viewed at https://www.clsa.com/disclaimer.html or sent to you upon request. Please consider before printing. CLSA is ISO14001 certified and committed to reducing its impact on the environment.

What you mean as "process level".. CPU load?
This is impossible (and it makes no sense), because here is checked if poller process already launched. And records information about the process just created (when there is still no load in it).
Kaustubh Parthasarthy, CLSA mailto:kaustubh.parthasarthy@clsa.com 29 August 2018 at 10:01
I am trying to get the process level information through observium.
Hence I am trying to leverage the script or if there is anything else you guys can assist me or guide me to.
Regards
Kaustubh
*From:*observium [mailto:observium-bounces@observium.org] *On Behalf Of *Markus Klock *Sent:* Wednesday, August 29, 2018 12:29 PM *To:* Observium Network Observation System *Subject:* Re: [Observium] Get more information on Dashboard for Process consumption
What exactly is it that you are trying to accomplish here?
/Markus
Den ons 29 aug. 2018 kl 07:04 skrev Kaustubh Parthasarthy, CLSA <kaustubh.parthasarthy@clsa.com mailto:kaustubh.parthasarthy@clsa.com>:
The content of this communication is intended for the recipient and is subject to CLSA Legal and Regulatory Notices. These can be viewed at https://www.clsa.com/disclaimer.htmlor sent to you upon request. Please consider before printing. CLSA is ISO14001 certified and committed to reducing its impact on the environment.
observium mailing list observium@observium.org http://postman.memetic.org/cgi-bin/mailman/listinfo/observium Markus Klock mailto:markus@best-practice.se 29 August 2018 at 09:59 What exactly is it that you are trying to accomplish here?
/Markus
observium mailing list observium@observium.org http://postman.memetic.org/cgi-bin/mailman/listinfo/observium Kaustubh Parthasarthy, CLSA mailto:kaustubh.parthasarthy@clsa.com 29 August 2018 at 08:04
# write into db current process info
p_query = """INSERT INTO `observium_processes` (`process_pid`,`process_ppid`,`process_name`,`process_uid`,`process_command`,`process_start`,`device_id`)
VALUES (%s,%s,%s,%s,%s,%s,'0')"""try:
cursor.execute(p_query, (pid,ppid,scriptname,uid,command,s_time))
process_id = db.insert_id()
db.commit()
except:
pass
Can I leverage the above for process level info ?
Regards
Kaustubh
*From:*Kaustubh Parthasarthy, CLSA *Sent:* Wednesday, August 29, 2018 10:32 AM *To:* observium@observium.org *Subject:* RE: [Observium] Get more information on Dashboard for Process consumption
I found the poller-wrapper.py script
Was thinking if I can do some customization on this script. Can you experts please suggest something
Regards
Kaustubh
*From:*observium [mailto:observium-bounces@observium.org] *On Behalf Of *Adam Armstrong *Sent:* Wednesday, August 29, 2018 9:14 AM *To:* observium@observium.org *Subject:* Re: [Observium] Get more information on Dashboard for Process consumption
There is no script. These are counters pulled from either HOST-RESOURCES-MIB or UCD-MIB via SNMP.
adam.
The content of this communication is intended for the recipient and is subject to CLSA Legal and Regulatory Notices. These can be viewed at https://www.clsa.com/disclaimer.htmlor sent to you upon request. Please consider before printing. CLSA is ISO14001 certified and committed to reducing its impact on the environment.
observium mailing list observium@observium.org http://postman.memetic.org/cgi-bin/mailman/listinfo/observium Adam Armstrong mailto:adama@memetic.org 29 August 2018 at 06:43 There is no script. These are counters pulled from either HOST-RESOURCES-MIB or UCD-MIB via SNMP.
adam. _______________________________________________ observium mailing list observium@observium.org http://postman.memetic.org/cgi-bin/mailman/listinfo/observium Kaustubh Parthasarthy, CLSA mailto:kaustubh.parthasarthy@clsa.com 29 August 2018 at 06:09
Ok,
Can you let me know what script observium uses to pull the performance data ? There has to be script which is running on the system correct.
Regards
Kaustubh
*From:*observium [mailto:observium-bounces@observium.org] *On Behalf Of *Adam Armstrong *Sent:* Tuesday, August 28, 2018 6:45 PM *To:* observium@observium.org *Subject:* Re: [Observium] Get more information on Dashboard for Process consumption
Hi,
We don't currently collect per-process statistics.
adam.
The content of this communication is intended for the recipient and is subject to CLSA Legal and Regulatory Notices. These can be viewed at https://www.clsa.com/disclaimer.htmlor sent to you upon request. Please consider before printing. CLSA is ISO14001 certified and committed to reducing its impact on the environment.
observium mailing list observium@observium.org http://postman.memetic.org/cgi-bin/mailman/listinfo/observium
Why does this not make sense? I already gave my use case when I first asked this querry:
Comments as below:
I have been using observium for few months now. I wanted some info from the graphs that observium spins off.
Following is the graphs for running process consumption:
[cid:image001.png@01D43EAC.03C3D610]
Can I get something like top 10 process graphs?
Let me give you an example, I sometimes get requests from folks asking, “Ok my memory utilization on a server ABC was 90% on this particular day. Can we get list of processes consuming high memory on that particular day ? “
So as per this, can I customize the graph to get process level info ?
Regards Kaustubh
From: Mike Stupalov [mailto:mike@stupalov.ru] On Behalf Of Mike Stupalov Sent: Wednesday, August 29, 2018 12:53 PM To: Observium; Kaustubh Parthasarthy, CLSA Subject: Re: [Observium] Get more information on Dashboard for Process consumption
What you mean as "process level".. CPU load?
This is impossible (and it makes no sense), because here is checked if poller process already launched. And records information about the process just created (when there is still no load in it). Kaustubh Parthasarthy, CLSAmailto:kaustubh.parthasarthy@clsa.com 29 August 2018 at 10:01 I am trying to get the process level information through observium.
Hence I am trying to leverage the script or if there is anything else you guys can assist me or guide me to.
Regards Kaustubh
From: observium [mailto:observium-bounces@observium.org] On Behalf Of Markus Klock Sent: Wednesday, August 29, 2018 12:29 PM To: Observium Network Observation System Subject: Re: [Observium] Get more information on Dashboard for Process consumption
What exactly is it that you are trying to accomplish here?
/Markus
Den ons 29 aug. 2018 kl 07:04 skrev Kaustubh Parthasarthy, CLSA <kaustubh.parthasarthy@clsa.commailto:kaustubh.parthasarthy@clsa.com>:
The content of this communication is intended for the recipient and is subject to CLSA Legal and Regulatory Notices. These can be viewed at https://www.clsa.com/disclaimer.html or sent to you upon request. Please consider before printing. CLSA is ISO14001 certified and committed to reducing its impact on the environment.
_______________________________________________ observium mailing list observium@observium.orgmailto:observium@observium.org http://postman.memetic.org/cgi-bin/mailman/listinfo/observium Markus Klockmailto:markus@best-practice.se 29 August 2018 at 09:59 What exactly is it that you are trying to accomplish here?
/Markus
_______________________________________________ observium mailing list observium@observium.orgmailto:observium@observium.org http://postman.memetic.org/cgi-bin/mailman/listinfo/observium Kaustubh Parthasarthy, CLSAmailto:kaustubh.parthasarthy@clsa.com 29 August 2018 at 08:04
# write into db current process info
p_query = """INSERT INTO `observium_processes` (`process_pid`,`process_ppid`,`process_name`,`process_uid`,`process_command`,`process_start`,`device_id`)
VALUES (%s,%s,%s,%s,%s,%s,'0')"""
try:
cursor.execute(p_query, (pid,ppid,scriptname,uid,command,s_time))
process_id = db.insert_id()
db.commit()
except:
pass
Can I leverage the above for process level info ?
Regards Kaustubh
From: Kaustubh Parthasarthy, CLSA Sent: Wednesday, August 29, 2018 10:32 AM To: observium@observium.orgmailto:observium@observium.org Subject: RE: [Observium] Get more information on Dashboard for Process consumption
I found the poller-wrapper.py script
Was thinking if I can do some customization on this script. Can you experts please suggest something
Regards Kaustubh
From: observium [mailto:observium-bounces@observium.org] On Behalf Of Adam Armstrong Sent: Wednesday, August 29, 2018 9:14 AM To: observium@observium.orgmailto:observium@observium.org Subject: Re: [Observium] Get more information on Dashboard for Process consumption
There is no script. These are counters pulled from either HOST-RESOURCES-MIB or UCD-MIB via SNMP.
adam.
The content of this communication is intended for the recipient and is subject to CLSA Legal and Regulatory Notices. These can be viewed at https://www.clsa.com/disclaimer.html or sent to you upon request. Please consider before printing. CLSA is ISO14001 certified and committed to reducing its impact on the environment.
_______________________________________________ observium mailing list observium@observium.orgmailto:observium@observium.org http://postman.memetic.org/cgi-bin/mailman/listinfo/observium Adam Armstrongmailto:adama@memetic.org 29 August 2018 at 06:43 There is no script. These are counters pulled from either HOST-RESOURCES-MIB or UCD-MIB via SNMP.
adam. _______________________________________________ observium mailing list observium@observium.orgmailto:observium@observium.org http://postman.memetic.org/cgi-bin/mailman/listinfo/observium Kaustubh Parthasarthy, CLSAmailto:kaustubh.parthasarthy@clsa.com 29 August 2018 at 06:09 Ok,
Can you let me know what script observium uses to pull the performance data ? There has to be script which is running on the system correct.
Regards Kaustubh
From: observium [mailto:observium-bounces@observium.org] On Behalf Of Adam Armstrong Sent: Tuesday, August 28, 2018 6:45 PM To: observium@observium.orgmailto:observium@observium.org Subject: Re: [Observium] Get more information on Dashboard for Process consumption
Hi,
We don't currently collect per-process statistics.
adam.
The content of this communication is intended for the recipient and is subject to CLSA Legal and Regulatory Notices. These can be viewed at https://www.clsa.com/disclaimer.html or sent to you upon request. Please consider before printing. CLSA is ISO14001 certified and committed to reducing its impact on the environment.
_______________________________________________ observium mailing list observium@observium.orgmailto:observium@observium.org http://postman.memetic.org/cgi-bin/mailman/listinfo/observium
-- Mike Stupalov Observium Limited, http://observium.org The content of this communication is intended for the recipient and is subject to CLSA Legal and Regulatory Notices. These can be viewed at https://www.clsa.com/disclaimer.html or sent to you upon request. Please consider before printing. CLSA is ISO14001 certified and committed to reducing its impact on the environment.
I will give my use case again.
Following is the graphs for running process consumption: [cid:image001.png@01D43EAC.03C3D610]
But this graph does not show me what processes are consuming the load like lets say “java” process or something on the graph. Let me give you an example, I sometimes get requests from folks asking, “Ok my memory utilization on a server ABC was 90% on this particular day. Can we get list of processes consuming high memory on that particular day ? “
So as per this, can I customize the graph to get process level info ?
Example below is an graph which is giving top 10 processes consuming the cpu/memory utilization or the top 10 Process ID: [cid:image002.png@01D43F98.507BB350]
Hence wanted to know can I customize observium graphs to display something like the above screenshot (Obviously look and feel will change) but to get the top process consumption data.
Regards Kaustubh
From: Kaustubh Parthasarthy, CLSA Sent: Wednesday, August 29, 2018 12:55 PM To: 'Mike Stupalov'; Observium Subject: RE: [Observium] Get more information on Dashboard for Process consumption
Why does this not make sense? I already gave my use case when I first asked this querry:
Comments as below:
I have been using observium for few months now. I wanted some info from the graphs that observium spins off.
Following is the graphs for running process consumption:
[cid:image001.png@01D43EAC.03C3D610]
Can I get something like top 10 process graphs?
Let me give you an example, I sometimes get requests from folks asking, “Ok my memory utilization on a server ABC was 90% on this particular day. Can we get list of processes consuming high memory on that particular day ? “
So as per this, can I customize the graph to get process level info ?
Regards Kaustubh
From: Mike Stupalov [mailto:mike@stupalov.ru] On Behalf Of Mike Stupalov Sent: Wednesday, August 29, 2018 12:53 PM To: Observium; Kaustubh Parthasarthy, CLSA Subject: Re: [Observium] Get more information on Dashboard for Process consumption
What you mean as "process level".. CPU load?
This is impossible (and it makes no sense), because here is checked if poller process already launched. And records information about the process just created (when there is still no load in it). Kaustubh Parthasarthy, CLSAmailto:kaustubh.parthasarthy@clsa.com 29 August 2018 at 10:01 I am trying to get the process level information through observium.
Hence I am trying to leverage the script or if there is anything else you guys can assist me or guide me to.
Regards Kaustubh
From: observium [mailto:observium-bounces@observium.org] On Behalf Of Markus Klock Sent: Wednesday, August 29, 2018 12:29 PM To: Observium Network Observation System Subject: Re: [Observium] Get more information on Dashboard for Process consumption
What exactly is it that you are trying to accomplish here?
/Markus
Den ons 29 aug. 2018 kl 07:04 skrev Kaustubh Parthasarthy, CLSA <kaustubh.parthasarthy@clsa.commailto:kaustubh.parthasarthy@clsa.com>:
The content of this communication is intended for the recipient and is subject to CLSA Legal and Regulatory Notices. These can be viewed at https://www.clsa.com/disclaimer.html or sent to you upon request. Please consider before printing. CLSA is ISO14001 certified and committed to reducing its impact on the environment.
_______________________________________________ observium mailing list observium@observium.orgmailto:observium@observium.org http://postman.memetic.org/cgi-bin/mailman/listinfo/observium Markus Klockmailto:markus@best-practice.se 29 August 2018 at 09:59 What exactly is it that you are trying to accomplish here?
/Markus
_______________________________________________ observium mailing list observium@observium.orgmailto:observium@observium.org http://postman.memetic.org/cgi-bin/mailman/listinfo/observium Kaustubh Parthasarthy, CLSAmailto:kaustubh.parthasarthy@clsa.com 29 August 2018 at 08:04
# write into db current process info
p_query = """INSERT INTO `observium_processes` (`process_pid`,`process_ppid`,`process_name`,`process_uid`,`process_command`,`process_start`,`device_id`)
VALUES (%s,%s,%s,%s,%s,%s,'0')"""
try:
cursor.execute(p_query, (pid,ppid,scriptname,uid,command,s_time))
process_id = db.insert_id()
db.commit()
except:
pass
Can I leverage the above for process level info ?
Regards Kaustubh
From: Kaustubh Parthasarthy, CLSA Sent: Wednesday, August 29, 2018 10:32 AM To: observium@observium.orgmailto:observium@observium.org Subject: RE: [Observium] Get more information on Dashboard for Process consumption
I found the poller-wrapper.py script
Was thinking if I can do some customization on this script. Can you experts please suggest something
Regards Kaustubh
From: observium [mailto:observium-bounces@observium.org] On Behalf Of Adam Armstrong Sent: Wednesday, August 29, 2018 9:14 AM To: observium@observium.orgmailto:observium@observium.org Subject: Re: [Observium] Get more information on Dashboard for Process consumption
There is no script. These are counters pulled from either HOST-RESOURCES-MIB or UCD-MIB via SNMP.
adam.
The content of this communication is intended for the recipient and is subject to CLSA Legal and Regulatory Notices. These can be viewed at https://www.clsa.com/disclaimer.html or sent to you upon request. Please consider before printing. CLSA is ISO14001 certified and committed to reducing its impact on the environment.
_______________________________________________ observium mailing list observium@observium.orgmailto:observium@observium.org http://postman.memetic.org/cgi-bin/mailman/listinfo/observium Adam Armstrongmailto:adama@memetic.org 29 August 2018 at 06:43 There is no script. These are counters pulled from either HOST-RESOURCES-MIB or UCD-MIB via SNMP.
adam. _______________________________________________ observium mailing list observium@observium.orgmailto:observium@observium.org http://postman.memetic.org/cgi-bin/mailman/listinfo/observium Kaustubh Parthasarthy, CLSAmailto:kaustubh.parthasarthy@clsa.com 29 August 2018 at 06:09 Ok,
Can you let me know what script observium uses to pull the performance data ? There has to be script which is running on the system correct.
Regards Kaustubh
From: observium [mailto:observium-bounces@observium.org] On Behalf Of Adam Armstrong Sent: Tuesday, August 28, 2018 6:45 PM To: observium@observium.orgmailto:observium@observium.org Subject: Re: [Observium] Get more information on Dashboard for Process consumption
Hi,
We don't currently collect per-process statistics.
adam.
The content of this communication is intended for the recipient and is subject to CLSA Legal and Regulatory Notices. These can be viewed at https://www.clsa.com/disclaimer.html or sent to you upon request. Please consider before printing. CLSA is ISO14001 certified and committed to reducing its impact on the environment.
_______________________________________________ observium mailing list observium@observium.orgmailto:observium@observium.org http://postman.memetic.org/cgi-bin/mailman/listinfo/observium
-- Mike Stupalov Observium Limited, http://observium.org The content of this communication is intended for the recipient and is subject to CLSA Legal and Regulatory Notices. These can be viewed at https://www.clsa.com/disclaimer.html or sent to you upon request. Please consider before printing. CLSA is ISO14001 certified and committed to reducing its impact on the environment.

I'm not sure that what you are asking for is achievable sensibly in almost any platform... Even if you could expose the top 10 (via the agent would be the only way). I don't believe it's something that SNMP will expose.
For every 5 minute polling cycle, you want to store the top 10 processes based on CPU % consumption. If you display a graph covering a 24hr period, that is 288 intervals, which gives the potential for 2880 possible processes running (assuming a different top 10 in every polling cycle).
How do you plot 2880 lines on a graph?
Do you take the top 10 of that 2880? What if none of those top-top-10 processes were running during the time of day that you had issues? Then you would have a blank hole in the graph, which would no doubt be even more confusing and the inevitable jumped to conclusion of "why didn't it plot my xyz, it must be broken".
So then you need to catch the *entire* process list at *every* polling cycle. Then do the caclulations after the fact to restore what was active/busy at exactly 7:03am this morning.
I don't see this ending well.
M
On 29 Aug 2018, at 5:31 pm, Kaustubh Parthasarthy, CLSA kaustubh.parthasarthy@clsa.com wrote:
I will give my use case again.
Following is the graphs for running process consumption: <image001.png>
But this graph does not show me what processes are consuming the load like lets say “java” process or something on the graph. Let me give you an example, I sometimes get requests from folks asking, “Ok my memory utilization on a server ABC was 90% on this particular day. Can we get list of processes consuming high memory on that particular day ? “
So as per this, can I customize the graph to get process level info ?
Example below is an graph which is giving top 10 processes consuming the cpu/memory utilization or the top 10 Process ID: <image002.png>
Hence wanted to know can I customize observium graphs to display something like the above screenshot (Obviously look and feel will change) but to get the top process consumption data.
Regards Kaustubh
From: Kaustubh Parthasarthy, CLSA Sent: Wednesday, August 29, 2018 12:55 PM To: 'Mike Stupalov'; Observium Subject: RE: [Observium] Get more information on Dashboard for Process consumption
Why does this not make sense? I already gave my use case when I first asked this querry:
Comments as below:
I have been using observium for few months now. I wanted some info from the graphs that observium spins off.
Following is the graphs for running process consumption:
<image001.png>
Can I get something like top 10 process graphs?
Let me give you an example, I sometimes get requests from folks asking, “Ok my memory utilization on a server ABC was 90% on this particular day. Can we get list of processes consuming high memory on that particular day ? “
So as per this, can I customize the graph to get process level info ?
Regards Kaustubh
From: Mike Stupalov [mailto:mike@stupalov.ru] On Behalf Of Mike Stupalov Sent: Wednesday, August 29, 2018 12:53 PM To: Observium; Kaustubh Parthasarthy, CLSA Subject: Re: [Observium] Get more information on Dashboard for Process consumption
What you mean as "process level".. CPU load?
This is impossible (and it makes no sense), because here is checked if poller process already launched. And records information about the process just created (when there is still no load in it). Kaustubh Parthasarthy, CLSA 29 August 2018 at 10:01 I am trying to get the process level information through observium.
Hence I am trying to leverage the script or if there is anything else you guys can assist me or guide me to.
Regards Kaustubh
From: observium [mailto:observium-bounces@observium.org] On Behalf Of Markus Klock Sent: Wednesday, August 29, 2018 12:29 PM To: Observium Network Observation System Subject: Re: [Observium] Get more information on Dashboard for Process consumption
What exactly is it that you are trying to accomplish here?
/Markus
Den ons 29 aug. 2018 kl 07:04 skrev Kaustubh Parthasarthy, CLSA kaustubh.parthasarthy@clsa.com: The content of this communication is intended for the recipient and is subject to CLSA Legal and Regulatory Notices. These can be viewed at https://www.clsa.com/disclaimer.html or sent to you upon request. Please consider before printing. CLSA is ISO14001 certified and committed to reducing its impact on the environment.
observium mailing list observium@observium.org http://postman.memetic.org/cgi-bin/mailman/listinfo/observium Markus Klock 29 August 2018 at 09:59 What exactly is it that you are trying to accomplish here?
/Markus
observium mailing list observium@observium.org http://postman.memetic.org/cgi-bin/mailman/listinfo/observium Kaustubh Parthasarthy, CLSA 29 August 2018 at 08:04 # write into db current process info p_query = """INSERT INTO `observium_processes` (`process_pid`,`process_ppid`,`process_name`,`process_uid`,`process_command`,`process_start`,`device_id`) VALUES (%s,%s,%s,%s,%s,%s,'0')""" try: cursor.execute(p_query, (pid,ppid,scriptname,uid,command,s_time)) process_id = db.insert_id() db.commit() except: pass
Can I leverage the above for process level info ?
Regards Kaustubh
From: Kaustubh Parthasarthy, CLSA Sent: Wednesday, August 29, 2018 10:32 AM To: observium@observium.org Subject: RE: [Observium] Get more information on Dashboard for Process consumption
I found the poller-wrapper.py script
Was thinking if I can do some customization on this script. Can you experts please suggest something
Regards Kaustubh
From: observium [mailto:observium-bounces@observium.org] On Behalf Of Adam Armstrong Sent: Wednesday, August 29, 2018 9:14 AM To: observium@observium.org Subject: Re: [Observium] Get more information on Dashboard for Process consumption
There is no script. These are counters pulled from either HOST-RESOURCES-MIB or UCD-MIB via SNMP.
adam. The content of this communication is intended for the recipient and is subject to CLSA Legal and Regulatory Notices. These can be viewed at https://www.clsa.com/disclaimer.html or sent to you upon request. Please consider before printing. CLSA is ISO14001 certified and committed to reducing its impact on the environment.
observium mailing list observium@observium.org http://postman.memetic.org/cgi-bin/mailman/listinfo/observium Adam Armstrong 29 August 2018 at 06:43 There is no script. These are counters pulled from either HOST-RESOURCES-MIB or UCD-MIB via SNMP.
adam. _______________________________________________ observium mailing list observium@observium.org http://postman.memetic.org/cgi-bin/mailman/listinfo/observium Kaustubh Parthasarthy, CLSA 29 August 2018 at 06:09 Ok,
Can you let me know what script observium uses to pull the performance data ? There has to be script which is running on the system correct.
Regards Kaustubh
From: observium [mailto:observium-bounces@observium.org] On Behalf Of Adam Armstrong Sent: Tuesday, August 28, 2018 6:45 PM To: observium@observium.org Subject: Re: [Observium] Get more information on Dashboard for Process consumption
Hi,
We don't currently collect per-process statistics.
adam. The content of this communication is intended for the recipient and is subject to CLSA Legal and Regulatory Notices. These can be viewed at https://www.clsa.com/disclaimer.html or sent to you upon request. Please consider before printing. CLSA is ISO14001 certified and committed to reducing its impact on the environment.
observium mailing list observium@observium.org http://postman.memetic.org/cgi-bin/mailman/listinfo/observium
-- Mike Stupalov Observium Limited, http://observium.org
The content of this communication is intended for the recipient and is subject to CLSA Legal and Regulatory Notices. These can be viewed at https://www.clsa.com/disclaimer.html or sent to you upon request. Please consider before printing. CLSA is ISO14001 certified and committed to reducing its impact on the environment.
observium mailing list observium@observium.org http://postman.memetic.org/cgi-bin/mailman/listinfo/observium
Hi Mate,
Thanks for your response.
Yes I understand through SNMP it will be difficult to find the info.
I will check the UNIX agent route
Regards Kaustubh
-----Original Message----- From: observium [mailto:observium-bounces@observium.org] On Behalf Of Michael Sent: Wednesday, August 29, 2018 1:19 PM To: Observium Subject: Re: [Observium] Get more information on Dashboard for Process consumption
I'm not sure that what you are asking for is achievable sensibly in almost any platform... Even if you could expose the top 10 (via the agent would be the only way). I don't believe it's something that SNMP will expose.
For every 5 minute polling cycle, you want to store the top 10 processes based on CPU % consumption. If you display a graph covering a 24hr period, that is 288 intervals, which gives the potential for 2880 possible processes running (assuming a different top 10 in every polling cycle).
How do you plot 2880 lines on a graph?
Do you take the top 10 of that 2880? What if none of those top-top-10 processes were running during the time of day that you had issues? Then you would have a blank hole in the graph, which would no doubt be even more confusing and the inevitable jumped to conclusion of "why didn't it plot my xyz, it must be broken".
So then you need to catch the *entire* process list at *every* polling cycle. Then do the caclulations after the fact to restore what was active/busy at exactly 7:03am this morning.
I don't see this ending well.
M
On 29 Aug 2018, at 5:31 pm, Kaustubh Parthasarthy, CLSA kaustubh.parthasarthy@clsa.com wrote:
I will give my use case again.
Following is the graphs for running process consumption: <image001.png>
But this graph does not show me what processes are consuming the load like lets say “java” process or something on the graph. Let me give you an example, I sometimes get requests from folks asking, “Ok my memory utilization on a server ABC was 90% on this particular day. Can we get list of processes consuming high memory on that particular day ? “
So as per this, can I customize the graph to get process level info ?
Example below is an graph which is giving top 10 processes consuming the cpu/memory utilization or the top 10 Process ID: <image002.png>
Hence wanted to know can I customize observium graphs to display something like the above screenshot (Obviously look and feel will change) but to get the top process consumption data.
Regards Kaustubh
From: Kaustubh Parthasarthy, CLSA Sent: Wednesday, August 29, 2018 12:55 PM To: 'Mike Stupalov'; Observium Subject: RE: [Observium] Get more information on Dashboard for Process consumption
Why does this not make sense? I already gave my use case when I first asked this querry:
Comments as below:
I have been using observium for few months now. I wanted some info from the graphs that observium spins off.
Following is the graphs for running process consumption:
<image001.png>
Can I get something like top 10 process graphs?
Let me give you an example, I sometimes get requests from folks asking, “Ok my memory utilization on a server ABC was 90% on this particular day. Can we get list of processes consuming high memory on that particular day ? “
So as per this, can I customize the graph to get process level info ?
Regards Kaustubh
From: Mike Stupalov [mailto:mike@stupalov.ru] On Behalf Of Mike Stupalov Sent: Wednesday, August 29, 2018 12:53 PM To: Observium; Kaustubh Parthasarthy, CLSA Subject: Re: [Observium] Get more information on Dashboard for Process consumption
What you mean as "process level".. CPU load?
This is impossible (and it makes no sense), because here is checked if poller process already launched. And records information about the process just created (when there is still no load in it). Kaustubh Parthasarthy, CLSA 29 August 2018 at 10:01 I am trying to get the process level information through observium.
Hence I am trying to leverage the script or if there is anything else you guys can assist me or guide me to.
Regards Kaustubh
From: observium [mailto:observium-bounces@observium.org] On Behalf Of Markus Klock Sent: Wednesday, August 29, 2018 12:29 PM To: Observium Network Observation System Subject: Re: [Observium] Get more information on Dashboard for Process consumption
What exactly is it that you are trying to accomplish here?
/Markus
Den ons 29 aug. 2018 kl 07:04 skrev Kaustubh Parthasarthy, CLSA kaustubh.parthasarthy@clsa.com: The content of this communication is intended for the recipient and is subject to CLSA Legal and Regulatory Notices. These can be viewed at https://www.clsa.com/disclaimer.html or sent to you upon request. Please consider before printing. CLSA is ISO14001 certified and committed to reducing its impact on the environment.
observium mailing list observium@observium.org http://postman.memetic.org/cgi-bin/mailman/listinfo/observium Markus Klock 29 August 2018 at 09:59 What exactly is it that you are trying to accomplish here?
/Markus
observium mailing list observium@observium.org http://postman.memetic.org/cgi-bin/mailman/listinfo/observium Kaustubh Parthasarthy, CLSA 29 August 2018 at 08:04 # write into db current process info p_query = """INSERT INTO `observium_processes` (`process_pid`,`process_ppid`,`process_name`,`process_uid`,`process_command`,`process_start`,`device_id`) VALUES (%s,%s,%s,%s,%s,%s,'0')""" try: cursor.execute(p_query, (pid,ppid,scriptname,uid,command,s_time)) process_id = db.insert_id() db.commit() except: pass
Can I leverage the above for process level info ?
Regards Kaustubh
From: Kaustubh Parthasarthy, CLSA Sent: Wednesday, August 29, 2018 10:32 AM To: observium@observium.org Subject: RE: [Observium] Get more information on Dashboard for Process consumption
I found the poller-wrapper.py script
Was thinking if I can do some customization on this script. Can you experts please suggest something
Regards Kaustubh
From: observium [mailto:observium-bounces@observium.org] On Behalf Of Adam Armstrong Sent: Wednesday, August 29, 2018 9:14 AM To: observium@observium.org Subject: Re: [Observium] Get more information on Dashboard for Process consumption
There is no script. These are counters pulled from either HOST-RESOURCES-MIB or UCD-MIB via SNMP.
adam. The content of this communication is intended for the recipient and is subject to CLSA Legal and Regulatory Notices. These can be viewed at https://www.clsa.com/disclaimer.html or sent to you upon request. Please consider before printing. CLSA is ISO14001 certified and committed to reducing its impact on the environment.
observium mailing list observium@observium.org http://postman.memetic.org/cgi-bin/mailman/listinfo/observium Adam Armstrong 29 August 2018 at 06:43 There is no script. These are counters pulled from either HOST-RESOURCES-MIB or UCD-MIB via SNMP.
adam. _______________________________________________ observium mailing list observium@observium.org http://postman.memetic.org/cgi-bin/mailman/listinfo/observium Kaustubh Parthasarthy, CLSA 29 August 2018 at 06:09 Ok,
Can you let me know what script observium uses to pull the performance data ? There has to be script which is running on the system correct.
Regards Kaustubh
From: observium [mailto:observium-bounces@observium.org] On Behalf Of Adam Armstrong Sent: Tuesday, August 28, 2018 6:45 PM To: observium@observium.org Subject: Re: [Observium] Get more information on Dashboard for Process consumption
Hi,
We don't currently collect per-process statistics.
adam. The content of this communication is intended for the recipient and is subject to CLSA Legal and Regulatory Notices. These can be viewed at https://www.clsa.com/disclaimer.html or sent to you upon request. Please consider before printing. CLSA is ISO14001 certified and committed to reducing its impact on the environment.
observium mailing list observium@observium.org http://postman.memetic.org/cgi-bin/mailman/listinfo/observium
-- Mike Stupalov Observium Limited, http://observium.org
The content of this communication is intended for the recipient and is subject to CLSA Legal and Regulatory Notices. These can be viewed at https://www.clsa.com/disclaimer.html or sent to you upon request. Please consider before printing. CLSA is ISO14001 certified and committed to reducing its impact on the environment.
observium mailing list observium@observium.org http://postman.memetic.org/cgi-bin/mailman/listinfo/observium
_______________________________________________ observium mailing list observium@observium.org http://postman.memetic.org/cgi-bin/mailman/listinfo/observium The content of this communication is intended for the recipient and is subject to CLSA Legal and Regulatory Notices. These can be viewed at https://www.clsa.com/disclaimer.html or sent to you upon request. Please consider before printing. CLSA is ISO14001 certified and committed to reducing its impact on the environment.

Hello,
Usually for tasks like returning a single value I make use of "Custom OIDs" defining some custom scripts. The problem here is that this is useless if you need a list of values. It would be usefull if a kind of "Custom OID" would return more than one value, a table, and plot them in the same graph as plotting storage with multiple disks do.
Regards, Silvio
Silvio del Val Systems Engineer - Panda Security
-----Mensaje original----- De: observium [mailto:observium-bounces@observium.org] En nombre de Kaustubh Parthasarthy, CLSA Enviado el: miércoles, 29 de agosto de 2018 10:29 Para: Observium observium@observium.org Asunto: Re: [Observium] Get more information on Dashboard for Process consumption
Hi Mate,
Thanks for your response.
Yes I understand through SNMP it will be difficult to find the info.
I will check the UNIX agent route
Regards Kaustubh
-----Original Message----- From: observium [mailto:observium-bounces@observium.org] On Behalf Of Michael Sent: Wednesday, August 29, 2018 1:19 PM To: Observium Subject: Re: [Observium] Get more information on Dashboard for Process consumption
I'm not sure that what you are asking for is achievable sensibly in almost any platform... Even if you could expose the top 10 (via the agent would be the only way). I don't believe it's something that SNMP will expose.
For every 5 minute polling cycle, you want to store the top 10 processes based on CPU % consumption. If you display a graph covering a 24hr period, that is 288 intervals, which gives the potential for 2880 possible processes running (assuming a different top 10 in every polling cycle).
How do you plot 2880 lines on a graph?
Do you take the top 10 of that 2880? What if none of those top-top-10 processes were running during the time of day that you had issues? Then you would have a blank hole in the graph, which would no doubt be even more confusing and the inevitable jumped to conclusion of "why didn't it plot my xyz, it must be broken".
So then you need to catch the *entire* process list at *every* polling cycle. Then do the caclulations after the fact to restore what was active/busy at exactly 7:03am this morning.
I don't see this ending well.
M
On 29 Aug 2018, at 5:31 pm, Kaustubh Parthasarthy, CLSA kaustubh.parthasarthy@clsa.com wrote:
I will give my use case again.
Following is the graphs for running process consumption: <image001.png>
But this graph does not show me what processes are consuming the load like lets say “java” process or something on the graph. Let me give you an example, I sometimes get requests from folks asking, “Ok my memory utilization on a server ABC was 90% on this particular day. Can we get list of processes consuming high memory on that particular day ? “
So as per this, can I customize the graph to get process level info ?
Example below is an graph which is giving top 10 processes consuming the cpu/memory utilization or the top 10 Process ID: <image002.png>
Hence wanted to know can I customize observium graphs to display something like the above screenshot (Obviously look and feel will change) but to get the top process consumption data.
Regards Kaustubh
From: Kaustubh Parthasarthy, CLSA Sent: Wednesday, August 29, 2018 12:55 PM To: 'Mike Stupalov'; Observium Subject: RE: [Observium] Get more information on Dashboard for Process consumption
Why does this not make sense? I already gave my use case when I first asked this querry:
Comments as below:
I have been using observium for few months now. I wanted some info from the graphs that observium spins off.
Following is the graphs for running process consumption:
<image001.png>
Can I get something like top 10 process graphs?
Let me give you an example, I sometimes get requests from folks asking, “Ok my memory utilization on a server ABC was 90% on this particular day. Can we get list of processes consuming high memory on that particular day ? “
So as per this, can I customize the graph to get process level info ?
Regards Kaustubh
From: Mike Stupalov [mailto:mike@stupalov.ru] On Behalf Of Mike Stupalov Sent: Wednesday, August 29, 2018 12:53 PM To: Observium; Kaustubh Parthasarthy, CLSA Subject: Re: [Observium] Get more information on Dashboard for Process consumption
What you mean as "process level".. CPU load?
This is impossible (and it makes no sense), because here is checked if poller process already launched. And records information about the process just created (when there is still no load in it). Kaustubh Parthasarthy, CLSA 29 August 2018 at 10:01 I am trying to get the process level information through observium.
Hence I am trying to leverage the script or if there is anything else you guys can assist me or guide me to.
Regards Kaustubh
From: observium [mailto:observium-bounces@observium.org] On Behalf Of Markus Klock Sent: Wednesday, August 29, 2018 12:29 PM To: Observium Network Observation System Subject: Re: [Observium] Get more information on Dashboard for Process consumption
What exactly is it that you are trying to accomplish here?
/Markus
Den ons 29 aug. 2018 kl 07:04 skrev Kaustubh Parthasarthy, CLSA kaustubh.parthasarthy@clsa.com: The content of this communication is intended for the recipient and is subject to CLSA Legal and Regulatory Notices. These can be viewed at https://www.clsa.com/disclaimer.html or sent to you upon request. Please consider before printing. CLSA is ISO14001 certified and committed to reducing its impact on the environment.
observium mailing list observium@observium.org http://postman.memetic.org/cgi-bin/mailman/listinfo/observium Markus Klock 29 August 2018 at 09:59 What exactly is it that you are trying to accomplish here?
/Markus
observium mailing list observium@observium.org http://postman.memetic.org/cgi-bin/mailman/listinfo/observium Kaustubh Parthasarthy, CLSA 29 August 2018 at 08:04 # write into db current process info p_query = """INSERT INTO `observium_processes` (`process_pid`,`process_ppid`,`process_name`,`process_uid`,`process_command`,`process_start`,`device_id`) VALUES (%s,%s,%s,%s,%s,%s,'0')""" try: cursor.execute(p_query, (pid,ppid,scriptname,uid,command,s_time)) process_id = db.insert_id() db.commit() except: pass
Can I leverage the above for process level info ?
Regards Kaustubh
From: Kaustubh Parthasarthy, CLSA Sent: Wednesday, August 29, 2018 10:32 AM To: observium@observium.org Subject: RE: [Observium] Get more information on Dashboard for Process consumption
I found the poller-wrapper.py script
Was thinking if I can do some customization on this script. Can you experts please suggest something
Regards Kaustubh
From: observium [mailto:observium-bounces@observium.org] On Behalf Of Adam Armstrong Sent: Wednesday, August 29, 2018 9:14 AM To: observium@observium.org Subject: Re: [Observium] Get more information on Dashboard for Process consumption
There is no script. These are counters pulled from either HOST-RESOURCES-MIB or UCD-MIB via SNMP.
adam. The content of this communication is intended for the recipient and is subject to CLSA Legal and Regulatory Notices. These can be viewed at https://www.clsa.com/disclaimer.html or sent to you upon request. Please consider before printing. CLSA is ISO14001 certified and committed to reducing its impact on the environment.
observium mailing list observium@observium.org http://postman.memetic.org/cgi-bin/mailman/listinfo/observium Adam Armstrong 29 August 2018 at 06:43 There is no script. These are counters pulled from either HOST-RESOURCES-MIB or UCD-MIB via SNMP.
adam. _______________________________________________ observium mailing list observium@observium.org http://postman.memetic.org/cgi-bin/mailman/listinfo/observium Kaustubh Parthasarthy, CLSA 29 August 2018 at 06:09 Ok,
Can you let me know what script observium uses to pull the performance data ? There has to be script which is running on the system correct.
Regards Kaustubh
From: observium [mailto:observium-bounces@observium.org] On Behalf Of Adam Armstrong Sent: Tuesday, August 28, 2018 6:45 PM To: observium@observium.org Subject: Re: [Observium] Get more information on Dashboard for Process consumption
Hi,
We don't currently collect per-process statistics.
adam. The content of this communication is intended for the recipient and is subject to CLSA Legal and Regulatory Notices. These can be viewed at https://www.clsa.com/disclaimer.html or sent to you upon request. Please consider before printing. CLSA is ISO14001 certified and committed to reducing its impact on the environment.
observium mailing list observium@observium.org http://postman.memetic.org/cgi-bin/mailman/listinfo/observium
-- Mike Stupalov Observium Limited, http://observium.org
The content of this communication is intended for the recipient and is subject to CLSA Legal and Regulatory Notices. These can be viewed at https://www.clsa.com/disclaimer.html or sent to you upon request. Please consider before printing. CLSA is ISO14001 certified and committed to reducing its impact on the environment.
observium mailing list observium@observium.org http://postman.memetic.org/cgi-bin/mailman/listinfo/observium
_______________________________________________ observium mailing list observium@observium.org http://postman.memetic.org/cgi-bin/mailman/listinfo/observium The content of this communication is intended for the recipient and is subject to CLSA Legal and Regulatory Notices. These can be viewed at https://www.clsa.com/disclaimer.html or sent to you upon request. Please consider before printing. CLSA is ISO14001 certified and committed to reducing its impact on the environment. _______________________________________________ observium mailing list observium@observium.org http://postman.memetic.org/cgi-bin/mailman/listinfo/observium
Hi Kaustubh, the short answer is no. You can not modify Observium to get you a list of processes. The reason is that Observium monitor other servers via the SNMP-protocol. Observium can only gather information that the servers chose to expose via SNMP. The amount of running processes is gathered by the server and exposed via SNMP so that Observium can draw the above graph. Which processes are running and are using the most resources are simply not show over SNMP and would be close to impossible to add.
I would instead recommend that you take a look at the Observium UNIX-agent(if the servers you want to monitor runs linux/BSD) It could probably gather this info for you and send the information to Observium but I do not think this function exists yet. But if you would like to add it then the UNIX-agent is the place to do it
/Markus
Den ons 29 aug. 2018 kl 09:31 skrev Kaustubh Parthasarthy, CLSA < kaustubh.parthasarthy@clsa.com>:
I will give my use case again.
Following is the graphs for running process consumption:
[image: cid:image001.png@01D43EAC.03C3D610]
But this graph does not show me what processes are consuming the load like lets say “java” process or something on the graph.
Let me give you an example, I sometimes get requests from folks asking, “*Ok my memory utilization on a server ABC was 90% on this particular day. Can we get list of processes consuming high memory on that particular day ? * “
So as per this, can I customize the graph to get process level info ?
Example below is an graph which is giving top 10 processes consuming the cpu/memory utilization or the top 10 Process ID:
[image: cid:image002.png@01D43F98.507BB350]
Hence wanted to know can I customize observium graphs to display something like the above screenshot (Obviously look and feel will change) but to get the top process consumption data.
Regards
Kaustubh
*From:* Kaustubh Parthasarthy, CLSA *Sent:* Wednesday, August 29, 2018 12:55 PM *To:* 'Mike Stupalov'; Observium *Subject:* RE: [Observium] Get more information on Dashboard for Process consumption
Why does this not make sense? I already gave my use case when I first asked this querry:
Comments as below:
I have been using observium for few months now. I wanted some info from the graphs that observium spins off.
Following is the graphs for running process consumption:
[image: cid:image001.png@01D43EAC.03C3D610]
Can I get something like top 10 process graphs?
Let me give you an example, I sometimes get requests from folks asking, “*Ok my memory utilization on a server ABC was 90% on this particular day. Can we get list of processes consuming high memory on that particular day ? * “
So as per this, can I customize the graph to get process level info ?
Regards
Kaustubh
*From:* Mike Stupalov [mailto:mike@stupalov.ru] *On Behalf Of *Mike Stupalov *Sent:* Wednesday, August 29, 2018 12:53 PM *To:* Observium; Kaustubh Parthasarthy, CLSA *Subject:* Re: [Observium] Get more information on Dashboard for Process consumption
What you mean as "process level".. CPU load?
This is impossible (and it makes no sense), because here is checked if poller process already launched. And records information about the process just created (when there is still no load in it).
Kaustubh Parthasarthy, CLSA kaustubh.parthasarthy@clsa.com
29 August 2018 at 10:01
I am trying to get the process level information through observium.
Hence I am trying to leverage the script or if there is anything else you guys can assist me or guide me to.
Regards
Kaustubh
*From:* observium [mailto:observium-bounces@observium.org observium-bounces@observium.org] *On Behalf Of *Markus Klock *Sent:* Wednesday, August 29, 2018 12:29 PM *To:* Observium Network Observation System *Subject:* Re: [Observium] Get more information on Dashboard for Process consumption
What exactly is it that you are trying to accomplish here?
/Markus
Den ons 29 aug. 2018 kl 07:04 skrev Kaustubh Parthasarthy, CLSA < kaustubh.parthasarthy@clsa.com>:
The content of this communication is intended for the recipient and is subject to CLSA Legal and Regulatory Notices. These can be viewed at https://www.clsa.com/disclaimer.html or sent to you upon request. Please consider before printing. CLSA is ISO14001 certified and committed to reducing its impact on the environment.
observium mailing list observium@observium.org http://postman.memetic.org/cgi-bin/mailman/listinfo/observium
Markus Klock markus@best-practice.se
29 August 2018 at 09:59
What exactly is it that you are trying to accomplish here?
/Markus
observium mailing list observium@observium.org http://postman.memetic.org/cgi-bin/mailman/listinfo/observium
Kaustubh Parthasarthy, CLSA kaustubh.parthasarthy@clsa.com
29 August 2018 at 08:04
# write into db current process info
p_query = """INSERT INTO `observium_processes` (`process_pid`,`process_ppid`,`process_name`,`process_uid`,`process_command`,`process_start`,`device_id`)
VALUES (%s,%s,%s,%s,%s,%s,'0')"""try:
cursor.execute(p_query, (pid,ppid,scriptname,uid,command,s_time))
process_id = db.insert_id()
db.commit()
except:
pass
Can I leverage the above for process level info ?
Regards
Kaustubh
*From:* Kaustubh Parthasarthy, CLSA *Sent:* Wednesday, August 29, 2018 10:32 AM *To:* observium@observium.org *Subject:* RE: [Observium] Get more information on Dashboard for Process consumption
I found the poller-wrapper.py script
Was thinking if I can do some customization on this script. Can you experts please suggest something
Regards
Kaustubh
*From:* observium [mailto:observium-bounces@observium.org observium-bounces@observium.org] *On Behalf Of *Adam Armstrong *Sent:* Wednesday, August 29, 2018 9:14 AM *To:* observium@observium.org *Subject:* Re: [Observium] Get more information on Dashboard for Process consumption
There is no script. These are counters pulled from either HOST-RESOURCES-MIB or UCD-MIB via SNMP.
adam.
The content of this communication is intended for the recipient and is subject to CLSA Legal and Regulatory Notices. These can be viewed at https://www.clsa.com/disclaimer.html or sent to you upon request. Please consider before printing. CLSA is ISO14001 certified and committed to reducing its impact on the environment.
observium mailing list observium@observium.org http://postman.memetic.org/cgi-bin/mailman/listinfo/observium
Adam Armstrong adama@memetic.org
29 August 2018 at 06:43
There is no script. These are counters pulled from either HOST-RESOURCES-MIB or UCD-MIB via SNMP.
adam.
observium mailing list observium@observium.org http://postman.memetic.org/cgi-bin/mailman/listinfo/observium
Kaustubh Parthasarthy, CLSA kaustubh.parthasarthy@clsa.com
29 August 2018 at 06:09
Ok,
Can you let me know what script observium uses to pull the performance data ? There has to be script which is running on the system correct.
Regards
Kaustubh
*From:* observium [mailto:observium-bounces@observium.org observium-bounces@observium.org] *On Behalf Of *Adam Armstrong *Sent:* Tuesday, August 28, 2018 6:45 PM *To:* observium@observium.org *Subject:* Re: [Observium] Get more information on Dashboard for Process consumption
Hi,
We don't currently collect per-process statistics.
adam.
The content of this communication is intended for the recipient and is subject to CLSA Legal and Regulatory Notices. These can be viewed at https://www.clsa.com/disclaimer.html or sent to you upon request. Please consider before printing. CLSA is ISO14001 certified and committed to reducing its impact on the environment.
observium mailing list observium@observium.org http://postman.memetic.org/cgi-bin/mailman/listinfo/observium
-- Mike Stupalov Observium Limited, http://observium.org
The content of this communication is intended for the recipient and is subject to CLSA Legal and Regulatory Notices. These can be viewed at https://www.clsa.com/disclaimer.html or sent to you upon request. Please consider before printing. CLSA is ISO14001 certified and committed to reducing its impact on the environment. _______________________________________________ observium mailing list observium@observium.org http://postman.memetic.org/cgi-bin/mailman/listinfo/observium
Thank you Markus.
Regards Kaustubh
From: observium [mailto:observium-bounces@observium.org] On Behalf Of Markus Klock Sent: Wednesday, August 29, 2018 1:19 PM To: Observium Network Observation System Subject: Re: [Observium] Get more information on Dashboard for Process consumption
Hi Kaustubh, the short answer is no. You can not modify Observium to get you a list of processes. The reason is that Observium monitor other servers via the SNMP-protocol. Observium can only gather information that the servers chose to expose via SNMP. The amount of running processes is gathered by the server and exposed via SNMP so that Observium can draw the above graph. Which processes are running and are using the most resources are simply not show over SNMP and would be close to impossible to add.
I would instead recommend that you take a look at the Observium UNIX-agent(if the servers you want to monitor runs linux/BSD) It could probably gather this info for you and send the information to Observium but I do not think this function exists yet. But if you would like to add it then the UNIX-agent is the place to do it
/Markus
Den ons 29 aug. 2018 kl 09:31 skrev Kaustubh Parthasarthy, CLSA <kaustubh.parthasarthy@clsa.commailto:kaustubh.parthasarthy@clsa.com>: I will give my use case again.
Following is the graphs for running process consumption: [cid:image001.png@01D43EAC.03C3D610]
But this graph does not show me what processes are consuming the load like lets say “java” process or something on the graph. Let me give you an example, I sometimes get requests from folks asking, “Ok my memory utilization on a server ABC was 90% on this particular day. Can we get list of processes consuming high memory on that particular day ? “
So as per this, can I customize the graph to get process level info ?
Example below is an graph which is giving top 10 processes consuming the cpu/memory utilization or the top 10 Process ID: [cid:image002.png@01D43F98.507BB350]
Hence wanted to know can I customize observium graphs to display something like the above screenshot (Obviously look and feel will change) but to get the top process consumption data.
Regards Kaustubh
From: Kaustubh Parthasarthy, CLSA Sent: Wednesday, August 29, 2018 12:55 PM To: 'Mike Stupalov'; Observium Subject: RE: [Observium] Get more information on Dashboard for Process consumption
Why does this not make sense? I already gave my use case when I first asked this querry:
Comments as below:
I have been using observium for few months now. I wanted some info from the graphs that observium spins off.
Following is the graphs for running process consumption:
[cid:image001.png@01D43EAC.03C3D610]
Can I get something like top 10 process graphs?
Let me give you an example, I sometimes get requests from folks asking, “Ok my memory utilization on a server ABC was 90% on this particular day. Can we get list of processes consuming high memory on that particular day ? “
So as per this, can I customize the graph to get process level info ?
Regards Kaustubh
From: Mike Stupalov [mailto:mike@stupalov.rumailto:mike@stupalov.ru] On Behalf Of Mike Stupalov Sent: Wednesday, August 29, 2018 12:53 PM To: Observium; Kaustubh Parthasarthy, CLSA Subject: Re: [Observium] Get more information on Dashboard for Process consumption
What you mean as "process level".. CPU load?
This is impossible (and it makes no sense), because here is checked if poller process already launched. And records information about the process just created (when there is still no load in it). Kaustubh Parthasarthy, CLSAmailto:kaustubh.parthasarthy@clsa.com 29 August 2018 at 10:01 I am trying to get the process level information through observium.
Hence I am trying to leverage the script or if there is anything else you guys can assist me or guide me to.
Regards Kaustubh
From: observium [mailto:observium-bounces@observium.org] On Behalf Of Markus Klock Sent: Wednesday, August 29, 2018 12:29 PM To: Observium Network Observation System Subject: Re: [Observium] Get more information on Dashboard for Process consumption
What exactly is it that you are trying to accomplish here?
/Markus
Den ons 29 aug. 2018 kl 07:04 skrev Kaustubh Parthasarthy, CLSA <kaustubh.parthasarthy@clsa.commailto:kaustubh.parthasarthy@clsa.com>:
The content of this communication is intended for the recipient and is subject to CLSA Legal and Regulatory Notices. These can be viewed at https://www.clsa.com/disclaimer.html or sent to you upon request. Please consider before printing. CLSA is ISO14001 certified and committed to reducing its impact on the environment.
_______________________________________________ observium mailing list observium@observium.orgmailto:observium@observium.org http://postman.memetic.org/cgi-bin/mailman/listinfo/observium Markus Klockmailto:markus@best-practice.se 29 August 2018 at 09:59 What exactly is it that you are trying to accomplish here?
/Markus
_______________________________________________ observium mailing list observium@observium.orgmailto:observium@observium.org http://postman.memetic.org/cgi-bin/mailman/listinfo/observium Kaustubh Parthasarthy, CLSAmailto:kaustubh.parthasarthy@clsa.com 29 August 2018 at 08:04
# write into db current process info
p_query = """INSERT INTO `observium_processes` (`process_pid`,`process_ppid`,`process_name`,`process_uid`,`process_command`,`process_start`,`device_id`)
VALUES (%s,%s,%s,%s,%s,%s,'0')"""
try:
cursor.execute(p_query, (pid,ppid,scriptname,uid,command,s_time))
process_id = db.insert_id()
db.commit()
except:
pass
Can I leverage the above for process level info ?
Regards Kaustubh
From: Kaustubh Parthasarthy, CLSA Sent: Wednesday, August 29, 2018 10:32 AM To: observium@observium.orgmailto:observium@observium.org Subject: RE: [Observium] Get more information on Dashboard for Process consumption
I found the poller-wrapper.py script
Was thinking if I can do some customization on this script. Can you experts please suggest something
Regards Kaustubh
From: observium [mailto:observium-bounces@observium.org] On Behalf Of Adam Armstrong Sent: Wednesday, August 29, 2018 9:14 AM To: observium@observium.orgmailto:observium@observium.org Subject: Re: [Observium] Get more information on Dashboard for Process consumption
There is no script. These are counters pulled from either HOST-RESOURCES-MIB or UCD-MIB via SNMP.
adam.
The content of this communication is intended for the recipient and is subject to CLSA Legal and Regulatory Notices. These can be viewed at https://www.clsa.com/disclaimer.html or sent to you upon request. Please consider before printing. CLSA is ISO14001 certified and committed to reducing its impact on the environment.
_______________________________________________ observium mailing list observium@observium.orgmailto:observium@observium.org http://postman.memetic.org/cgi-bin/mailman/listinfo/observium Adam Armstrongmailto:adama@memetic.org 29 August 2018 at 06:43 There is no script. These are counters pulled from either HOST-RESOURCES-MIB or UCD-MIB via SNMP.
adam. _______________________________________________ observium mailing list observium@observium.orgmailto:observium@observium.org http://postman.memetic.org/cgi-bin/mailman/listinfo/observium Kaustubh Parthasarthy, CLSAmailto:kaustubh.parthasarthy@clsa.com 29 August 2018 at 06:09 Ok,
Can you let me know what script observium uses to pull the performance data ? There has to be script which is running on the system correct.
Regards Kaustubh
From: observium [mailto:observium-bounces@observium.org] On Behalf Of Adam Armstrong Sent: Tuesday, August 28, 2018 6:45 PM To: observium@observium.orgmailto:observium@observium.org Subject: Re: [Observium] Get more information on Dashboard for Process consumption
Hi,
We don't currently collect per-process statistics.
adam.
The content of this communication is intended for the recipient and is subject to CLSA Legal and Regulatory Notices. These can be viewed at https://www.clsa.com/disclaimer.html or sent to you upon request. Please consider before printing. CLSA is ISO14001 certified and committed to reducing its impact on the environment.
_______________________________________________ observium mailing list observium@observium.orgmailto:observium@observium.org http://postman.memetic.org/cgi-bin/mailman/listinfo/observium
-- Mike Stupalov Observium Limited, http://observium.org
The content of this communication is intended for the recipient and is subject to CLSA Legal and Regulatory Notices. These can be viewed at https://www.clsa.com/disclaimer.html or sent to you upon request. Please consider before printing. CLSA is ISO14001 certified and committed to reducing its impact on the environment. _______________________________________________ observium mailing list observium@observium.orgmailto:observium@observium.org http://postman.memetic.org/cgi-bin/mailman/listinfo/observium The content of this communication is intended for the recipient and is subject to CLSA Legal and Regulatory Notices. These can be viewed at https://www.clsa.com/disclaimer.html or sent to you upon request. Please consider before printing. CLSA is ISO14001 certified and committed to reducing its impact on the environment.
participants (6)
-
 Adam Armstrong
 -
 Kaustubh Parthasarthy, CLSA
 -
 Markus Klock
 -
 Michael
 -
 Mike Stupalov
 -
 Silvio del Val Hinojal