
Hi,
the graphs for the CPU load of a linux server are not accurate. The CPU shows in vSphere client a load of 40-50% but in observium all 4 cores are permanently at 90%. Does anybody know why this happens? Thx
Chris

What is your CPU wait time on the vm?
Sent from my iPhone
On 11/10/2013, at 20:01, Christian Hügel christian.huegel@stonebyte.de wrote:
Hi,
the graphs for the CPU load of a linux server are not accurate. The CPU shows in vSphere client a load of 40-50% but in observium all 4 cores are permanently at 90%. Does anybody know why this happens? Thx
Chris _______________________________________________ observium mailing list observium@observium.org http://postman.memetic.org/cgi-bin/mailman/listinfo/observium
wait time is between 0.5 and 5%
Cpu(s): 43.9%us, 13.6%sy, 0.0%ni, 39.9%id, 1.7%wa, 0.0%hi, 0.8%si, 0.0%st
Am 11-10-2013 09:14, schrieb Pieter De Wit:
What is your CPU wait time on the vm?
Sent from my iPhone
On 11/10/2013, at 20:01, Christian Hügel christian.huegel@stonebyte.de wrote:
Hi,
the graphs for the CPU load of a linux server are not accurate. The CPU shows in vSphere client a load of 40-50% but in observium all 4 cores are permanently at 90%. Does anybody know why this happens? Thx
Chris _______________________________________________ observium mailing list observium@observium.org http://postman.memetic.org/cgi-bin/mailman/listinfo/observium
observium mailing list observium@observium.org http://postman.memetic.org/cgi-bin/mailman/listinfo/observium
Not that one, under VMware :)
On 11/10/2013 21:09, Christian Hügel wrote:
wait time is between 0.5 and 5%
Cpu(s): 43.9%us, 13.6%sy, 0.0%ni, 39.9%id, 1.7%wa, 0.0%hi, 0.8%si, 0.0%st
Am 11-10-2013 09:14, schrieb Pieter De Wit:
What is your CPU wait time on the vm?
Sent from my iPhone
On 11/10/2013, at 20:01, Christian Hügel christian.huegel@stonebyte.de wrote:
Hi,
the graphs for the CPU load of a linux server are not accurate. The CPU shows in vSphere client a load of 40-50% but in observium all 4 cores are permanently at 90%. Does anybody know why this happens? Thx
Chris _______________________________________________ observium mailing list observium@observium.org http://postman.memetic.org/cgi-bin/mailman/listinfo/observium
observium mailing list observium@observium.org http://postman.memetic.org/cgi-bin/mailman/listinfo/observium
observium mailing list observium@observium.org http://postman.memetic.org/cgi-bin/mailman/listinfo/observium
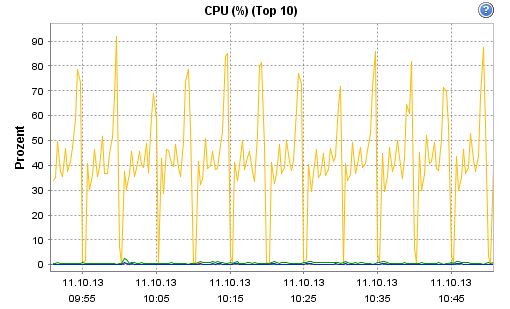
Ok, I´ve set the graph to "Realtime" (see attachement) and now I see what happens. The 5 Min CPU Load of observium are kind of useless :(
Am 11-10-2013 10:12, schrieb Pieter De Wit:
Not that one, under VMware :)
On 11/10/2013 21:09, Christian Hügel wrote:
wait time is between 0.5 and 5%
Cpu(s): 43.9%us, 13.6%sy, 0.0%ni, 39.9%id, 1.7%wa, 0.0%hi, 0.8%si, 0.0%st
Am 11-10-2013 09:14, schrieb Pieter De Wit:
What is your CPU wait time on the vm?
Sent from my iPhone
On 11/10/2013, at 20:01, Christian Hügel christian.huegel@stonebyte.de wrote:
Hi,
the graphs for the CPU load of a linux server are not accurate. The CPU shows in vSphere client a load of 40-50% but in observium all 4 cores are permanently at 90%. Does anybody know why this happens? Thx
Chris _______________________________________________ observium mailing list observium@observium.org http://postman.memetic.org/cgi-bin/mailman/listinfo/observium
observium mailing list observium@observium.org http://postman.memetic.org/cgi-bin/mailman/listinfo/observium
observium mailing list observium@observium.org http://postman.memetic.org/cgi-bin/mailman/listinfo/observium
observium mailing list observium@observium.org http://postman.memetic.org/cgi-bin/mailman/listinfo/observium
Is it possible to set the polling for the CPU load to 1 minute?
Am 11-10-2013 10:52, schrieb Christian Hügel:
Ok, I´ve set the graph to "Realtime" (see attachement) and now I see what happens. The 5 Min CPU Load of observium are kind of useless :(
Am 11-10-2013 10:12, schrieb Pieter De Wit:
Not that one, under VMware :)
On 11/10/2013 21:09, Christian Hügel wrote:
wait time is between 0.5 and 5%
Cpu(s): 43.9%us, 13.6%sy, 0.0%ni, 39.9%id, 1.7%wa, 0.0%hi, 0.8%si, 0.0%st
Am 11-10-2013 09:14, schrieb Pieter De Wit:
What is your CPU wait time on the vm?
Sent from my iPhone
On 11/10/2013, at 20:01, Christian Hügel christian.huegel@stonebyte.de wrote:
Hi,
the graphs for the CPU load of a linux server are not accurate. The CPU shows in vSphere client a load of 40-50% but in observium all 4 cores are permanently at 90%. Does anybody know why this happens? Thx
Chris _______________________________________________ observium mailing list observium@observium.org http://postman.memetic.org/cgi-bin/mailman/listinfo/observium
observium mailing list observium@observium.org http://postman.memetic.org/cgi-bin/mailman/listinfo/observium
observium mailing list observium@observium.org http://postman.memetic.org/cgi-bin/mailman/listinfo/observium
observium mailing list observium@observium.org http://postman.memetic.org/cgi-bin/mailman/listinfo/observium
observium mailing list observium@observium.org http://postman.memetic.org/cgi-bin/mailman/listinfo/observium

On 10/11/2013 12:20 PM, Christian Hügel wrote:
Is it possible to set the polling for the CPU load to 1 minute?
No.
Am 11-10-2013 10:52, schrieb Christian Hügel:
Ok, I´ve set the graph to "Realtime" (see attachement) and now I see what happens. The 5 Min CPU Load of observium are kind of useless :(
Tom
Am 11-10-2013 12:32, schrieb Tom Laermans:
On 10/11/2013 12:20 PM, Christian Hügel wrote:
Is it possible to set the polling for the CPU load to 1 minute?
No.
Is there a good reason why it´s default to 5 min.? Obviously, graphs like cpu load etc. do not display accurate information within 5 min polling span and thus do not reflect the actual load of the cpu. Implementing a (future) alerting system is useless with this kind of data.
Chris
On 10/11/2013 01:36 PM, Christian Hügel wrote:
Is there a good reason why it´s default to 5 min.? Obviously, graphs like cpu load etc. do not display accurate information within 5 min polling span and thus do not reflect the actual load of the cpu. Implementing a (future) alerting system is useless with this kind of data.
By that same reasoning, 1 min polling span is equally useless with this kind of data. :-)
Tom

On 2013-10-11 12:36, Christian Hügel wrote:
Am 11-10-2013 12:32, schrieb Tom Laermans: On 10/11/2013 12:20 PM, Christian Hügel wrote: Is it possible to set the polling for the CPU load to 1 minute? No.
Is there a good reason why it´s default to 5 min.? Obviously, graphs like cpu load etc. do not display accurate information within 5 min polling span and thus do not reflect the actual load of the cpu. Implementing a (future) alerting system is useless with this kind of data.
You're quite fundamentally wrong here.
Especially with something like CPU load, you're only really interested in the load averaged over time. Every single thing the CPU ever does will push the CPU load to 100% for some period of time.
I would expect most people not to even care about a single 5-minute spike in load, but rather to delay alerting on CPU load for a greater number of polling cycles.
5 minutes is a somewhat industry standard polling cycle which gives a good-for-most-people trade off between resource requirements and resolution of data.
adam.
participants (4)
-
 Adam Armstrong
 -
 Christian Hügel
 -
 Pieter De Wit
 -
 Tom Laermans