Still get alerts on deleted interfaces / vinterfaces

Dear Observium members,
Monitored interfaces went down on our brocade devices, then we deleted the interfaces (because we didn't use them anymore). We are now facing a bug where alerts are still up and still send Email notifications, even if Observium sees the interfaces as deleted.
I have seen there is a "ignore until OK" button in the interface monitoring options but I want it out of alerts.
Question: is this a bug? If yes, has it been fixed? (long not upgraded the files).
Thanks!
Best regards,
Pirmin Sidler

Hi All,
I've started to setup alarms in Observium, works really great. However a few alarms is bugging me:
[cid:d478e148-e58e-4de9-892b-0743df566236]
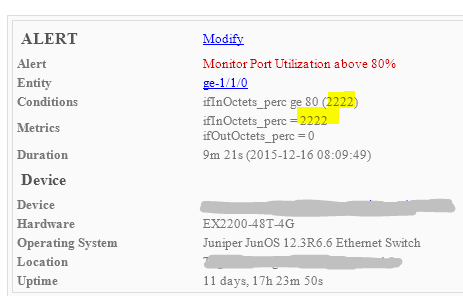
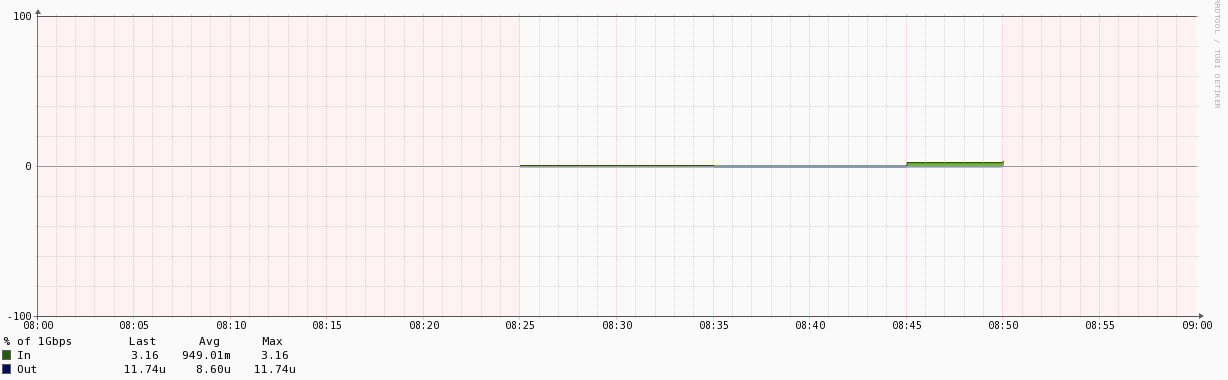
This device seems to have a utilitzation rate at about 2222% ? I've seen a few of these and not sure why. I can view the percentage usage on the port in observium (durin the time windows the alarm firerd)
[cid:6ea0f54b-1784-422f-83cb-38a05000f632]
Is this an error occuring at the Juniper side, or somewhere else in the chain?
//Anders

Almost 100% it's the Juniper.
You could add another check for that alert where both conditions must be true and add ifInOctetc_perc le 100
*Spencer Ryan* | Senior Systems Administrator | sryan@arbor.net *Arbor Networks* +1.734.794.5033 (d) | +1.734.846.2053 (m) www.arbornetworks.com
On Wed, Dec 16, 2015 at 3:06 AM, Anders Johansson < Anders.Johansson@direktorn.com> wrote:
Hi All,
I've started to setup alarms in Observium, works really great. However a few alarms is bugging me:
This device seems to have a utilitzation rate at about 2222% ? I've seen a few of these and not sure why. I can view the percentage usage on the port in observium (durin the time windows the alarm firerd)
Is this an error occuring at the Juniper side, or somewhere else in the chain?
//Anders
observium mailing list observium@observium.org http://postman.memetic.org/cgi-bin/mailman/listinfo/observium

It's odd, since we've added code to prevent this kind of thing happening, but devices still manage to send us data which make it happen. Ho hum!
adam. On 16/12/2015 14:21:00, Spencer Ryan sryan@arbor.net wrote: Almost 100% it's the Juniper.
You could add another check for that alert where both conditions must be true and add ifInOctetc_perc le 100
Spencer Ryan | Senior Systems Administrator | sryan@arbor.net [mailto:sryan@arbor.net] Arbor Networks +1.734.794.5033 (d) | +1.734.846.2053 (m) www.arbornetworks.com [http://www.arbornetworks.com/]
On Wed, Dec 16, 2015 at 3:06 AM, Anders Johansson <Anders.Johansson@direktorn.com [mailto:Anders.Johansson@direktorn.com]> wrote:
Hi All,
I've started to setup alarms in Observium, works really great. However a few alarms is bugging me:
This device seems to have a utilitzation rate at about 2222% ? I've seen a few of these and not sure why. I can view the percentage usage on the port in observium (durin the time windows the alarm firerd)
Is this an error occuring at the Juniper side, or somewhere else in the chain?
//Anders
_______________________________________________ observium mailing list observium@observium.org [mailto:observium@observium.org] http://postman.memetic.org/cgi-bin/mailman/listinfo/observium [http://postman.memetic.org/cgi-bin/mailman/listinfo/observium]
_______________________________________________ observium mailing list observium@observium.org http://postman.memetic.org/cgi-bin/mailman/listinfo/observium
Just updated to last build and I’m still seeing this.
Is there anything I can do? We are currently relying on Junos Space and I have not seen this happening there but I can investigate further (Junos space has an opennms backend)
//Anders
From: observium [mailto:observium-bounces@observium.org] On Behalf Of Adam Armstrong Sent: onsdag, december 16, 2015 15:23 To: observium@observium.org Subject: Re: [Observium] Percentage Alarms
It's odd, since we've added code to prevent this kind of thing happening, but devices still manage to send us data which make it happen. Ho hum!
adam.
On 16/12/2015 14:21:00, Spencer Ryan <sryan@arbor.netmailto:sryan@arbor.net> wrote: Almost 100% it's the Juniper. You could add another check for that alert where both conditions must be true and add ifInOctetc_perc le 100
Spencer Ryan | Senior Systems Administrator | sryan@arbor.netmailto:sryan@arbor.net Arbor Networks +1.734.794.5033 (d) | +1.734.846.2053 (m) www.arbornetworks.comhttp://www.arbornetworks.com/
On Wed, Dec 16, 2015 at 3:06 AM, Anders Johansson <Anders.Johansson@direktorn.commailto:Anders.Johansson@direktorn.com> wrote:
Hi All,
I've started to setup alarms in Observium, works really great. However a few alarms is bugging me:
[cid:d478e148-e58e-4de9-892b-0743df566236]
This device seems to have a utilitzation rate at about 2222% ? I've seen a few of these and not sure why. I can view the percentage usage on the port in observium (durin the time windows the alarm firerd)
[cid:6ea0f54b-1784-422f-83cb-38a05000f632]
Is this an error occuring at the Juniper side, or somewhere else in the chain?
//Anders
_______________________________________________ observium mailing list observium@observium.orgmailto:observium@observium.org http://postman.memetic.org/cgi-bin/mailman/listinfo/observium
_______________________________________________ observium mailing list observium@observium.orgmailto:observium@observium.org http://postman.memetic.org/cgi-bin/mailman/listinfo/observium
Bump,
Should I assume that the utilization part is broken? Any earlier version where its fixed?
Also I'm seeing a lot of missing polls, creating false/positive alarms and broken graphs.
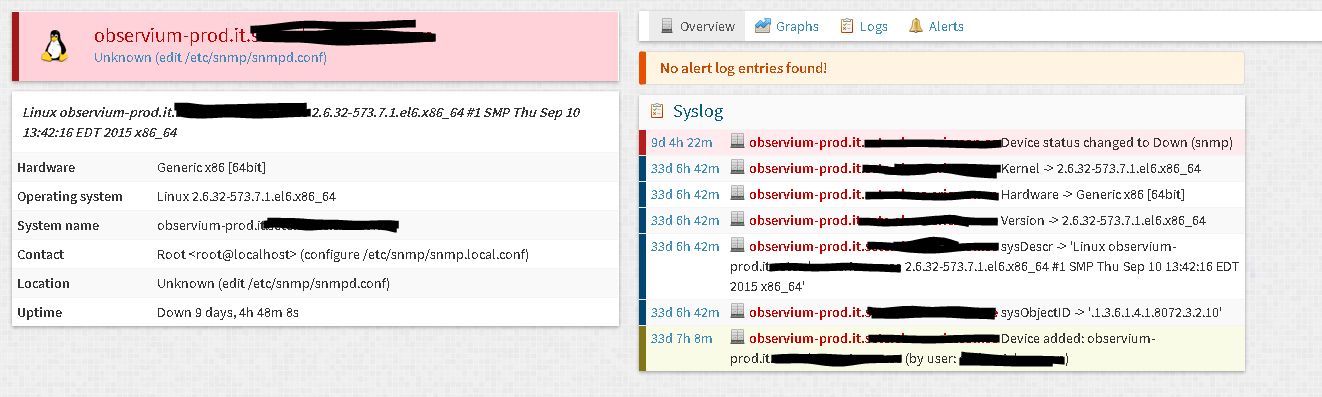
(This below is a good example, Observium thinks Observium is down....)
[cid:516d01a8-dc8b-4caa-b168-ec473f6f40ca] ________________________________ Från: observium observium-bounces@observium.org för Anders Johansson Anders.Johansson@direktorn.com Skickat: den 11 januari 2016 20:42 Till: Observium Network Observation System Ämne: Re: [Observium] Percentage Alarms
Just updated to last build and I'm still seeing this.
Is there anything I can do? We are currently relying on Junos Space and I have not seen this happening there but I can investigate further (Junos space has an opennms backend)
//Anders
From: observium [mailto:observium-bounces@observium.org] On Behalf Of Adam Armstrong Sent: onsdag, december 16, 2015 15:23 To: observium@observium.org Subject: Re: [Observium] Percentage Alarms
It's odd, since we've added code to prevent this kind of thing happening, but devices still manage to send us data which make it happen. Ho hum!
adam.
On 16/12/2015 14:21:00, Spencer Ryan <sryan@arbor.netmailto:sryan@arbor.net> wrote:
Almost 100% it's the Juniper.
You could add another check for that alert where both conditions must be true and add ifInOctetc_perc le 100
Spencer Ryan | Senior Systems Administrator | sryan@arbor.netmailto:sryan@arbor.net
Arbor Networks
+1.734.794.5033 (d) | +1.734.846.2053 (m)
www.arbornetworks.comhttp://www.arbornetworks.com/
On Wed, Dec 16, 2015 at 3:06 AM, Anders Johansson <Anders.Johansson@direktorn.commailto:Anders.Johansson@direktorn.com> wrote:
Hi All,
I've started to setup alarms in Observium, works really great. However a few alarms is bugging me:
[cid:d478e148-e58e-4de9-892b-0743df566236]
This device seems to have a utilitzation rate at about 2222% ? I've seen a few of these and not sure why. I can view the percentage usage on the port in observium (durin the time windows the alarm firerd)
[cid:6ea0f54b-1784-422f-83cb-38a05000f632]
Is this an error occuring at the Juniper side, or somewhere else in the chain?
//Anders
_______________________________________________ observium mailing list observium@observium.orgmailto:observium@observium.org http://postman.memetic.org/cgi-bin/mailman/listinfo/observium
_______________________________________________ observium mailing list observium@observium.orgmailto:observium@observium.org http://postman.memetic.org/cgi-bin/mailman/listinfo/observium
This issues are related to your broken polls, which will be caused by network packetloss, high server load or some other reason for the snmpbulkwalks to break part way through.
This is rare, but I find that people who have that issue, have it a lot.
I suspect its related to polling /through/ a less than capable firewall, breaking the UDP in a way that angers SNMP.
Adam.
Sent from BlueMail
On 17 Jan 2016, 14:16, at 14:16, Anders Johansson Anders.Johansson@direktorn.com wrote:
Bump,
Should I assume that the utilization part is broken? Any earlier version where its fixed?
Also I'm seeing a lot of missing polls, creating false/positive alarms and broken graphs.
(This below is a good example, Observium thinks Observium is down....)
[cid:516d01a8-dc8b-4caa-b168-ec473f6f40ca] ________________________________ Från: observium observium-bounces@observium.org för Anders Johansson Anders.Johansson@direktorn.com Skickat: den 11 januari 2016 20:42 Till: Observium Network Observation System Ämne: Re: [Observium] Percentage Alarms
Just updated to last build and I'm still seeing this.
Is there anything I can do? We are currently relying on Junos Space and I have not seen this happening there but I can investigate further (Junos space has an opennms backend)
//Anders
From: observium [mailto:observium-bounces@observium.org] On Behalf Of Adam Armstrong Sent: onsdag, december 16, 2015 15:23 To: observium@observium.org Subject: Re: [Observium] Percentage Alarms
It's odd, since we've added code to prevent this kind of thing happening, but devices still manage to send us data which make it happen. Ho hum!
adam.
On 16/12/2015 14:21:00, Spencer Ryan <sryan@arbor.netmailto:sryan@arbor.net> wrote:
Almost 100% it's the Juniper.
You could add another check for that alert where both conditions must be true and add ifInOctetc_perc le 100
Spencer Ryan | Senior Systems Administrator | sryan@arbor.netmailto:sryan@arbor.net
Arbor Networks
+1.734.794.5033 (d) | +1.734.846.2053 (m)
www.arbornetworks.comhttp://www.arbornetworks.com/
On Wed, Dec 16, 2015 at 3:06 AM, Anders Johansson <Anders.Johansson@direktorn.commailto:Anders.Johansson@direktorn.com> wrote:
Hi All,
I've started to setup alarms in Observium, works really great. However a few alarms is bugging me:
[cid:d478e148-e58e-4de9-892b-0743df566236]
This device seems to have a utilitzation rate at about 2222% ? I've seen a few of these and not sure why. I can view the percentage usage on the port in observium (durin the time windows the alarm firerd)
[cid:6ea0f54b-1784-422f-83cb-38a05000f632]
Is this an error occuring at the Juniper side, or somewhere else in the chain?
//Anders
observium mailing list observium@observium.orgmailto:observium@observium.org http://postman.memetic.org/cgi-bin/mailman/listinfo/observium
_______________________________________________ observium mailing list observium@observium.orgmailto:observium@observium.org http://postman.memetic.org/cgi-bin/mailman/listinfo/observium
observium mailing list observium@observium.org http://postman.memetic.org/cgi-bin/mailman/listinfo/observium
participants (4)
-
 Adam Armstrong
 -
 Anders Johansson
 -
 Pirmin Sidler - Computerline
 -
 Spencer Ryan