multi device graph for sensors?

Is there a way to get a summary (and sum) of a particular sensor? I’d like to have a one graph for all my PDUs with the apower attribute summed up for a total, see what the absolute # is.
-Darrell

Sure you can, just make a group of all the sensors you want :) /Markus
2017-12-28 22:55 GMT+01:00 Darrell Budic budic@onholyground.com:
Is there a way to get a summary (and sum) of a particular sensor? I’d like to have a one graph for all my PDUs with the apower attribute summed up for a total, see what the absolute # is.
-Darrell _______________________________________________ observium mailing list observium@observium.org http://postman.memetic.org/cgi-bin/mailman/listinfo/observium
I made a group of the devices, but wasn’t able to figure out how to get a graph out of them as a group. Any pointers or examples?
From: Markus Klock markus@best-practice.se Subject: Re: [Observium] multi device graph for sensors? Date: December 28, 2017 at 4:08:04 PM CST To: Observium
Sure you can, just make a group of all the sensors you want :) /Markus
2017-12-28 22:55 GMT+01:00 Darrell Budic <budic@onholyground.com mailto:budic@onholyground.com>: Is there a way to get a summary (and sum) of a particular sensor? I’d like to have a one graph for all my PDUs with the apower attribute summed up for a total, see what the absolute # is.
-Darrell _______________________________________________ observium mailing list observium@observium.org mailto:observium@observium.org http://postman.memetic.org/cgi-bin/mailman/listinfo/observium http://postman.memetic.org/cgi-bin/mailman/listinfo/observium
observium mailing list observium@observium.org http://postman.memetic.org/cgi-bin/mailman/listinfo/observium

Ah, that part was easy, but not quite what I’m after ;) I want a single graph that is the sum of all the group device's for that sensor value. Sort of like setting up a “Transit” port type and getting a total transit value for all ports labeled Transit, for for Apparent Power on a bunch of APC PDUs.
From: Youssef BENGELLOUN - ZAHR ybzahr@prodware.fr Subject: Re: [Observium] multi device graph for sensors? Date: December 28, 2017 at 6:18:45 PM CST To: Observium
When you select your group and access it’s details, you’ll find a ‘graph’ tab.
Select your favorite flavor and you are good to go :-)
Best regards.
Le 29 déc. 2017 à 01:14, Darrell Budic <budic@onholyground.com mailto:budic@onholyground.com> a écrit :
I made a group of the devices, but wasn’t able to figure out how to get a graph out of them as a group. Any pointers or examples?
From: Markus Klock <markus@best-practice.se mailto:markus@best-practice.se> Subject: Re: [Observium] multi device graph for sensors? Date: December 28, 2017 at 4:08:04 PM CST To: Observium
Sure you can, just make a group of all the sensors you want :) /Markus
Youssef BENGELLOUN - ZAHR - Consultant Expert Prodware France T : +33 979 999 000 - F : +33 988 814 001 - ybzahr@prodware.fr mailto:ybzahr@prodware.fr <image31535a.PNG> Web : prodware.fr http://www.prodware.fr/
<imagee4b25c.JPG> http://twitter.com/Prodware/ <imagecef791.JPG> http://www.facebook.com/Prodware/ <image01a3e9.JPG> https://www.linkedin.com/company/prodwarefrance <imageafadb0.JPG> https://www.youtube.com/c/ProdwareFrance <imagecf9fe4.JPG> http://www.viadeo.com/fr/company/prodware <image5a6ac4.JPG> http://www.prodware.fr/social-network/
2017-12-28 22:55 GMT+01:00 Darrell Budic <budic@onholyground.com mailto:budic@onholyground.com>: Is there a way to get a summary (and sum) of a particular sensor? I’d like to have a one graph for all my PDUs with the apower attribute summed up for a total, see what the absolute # is.
-Darrell _______________________________________________ observium mailing list observium@observium.org mailto:observium@observium.org http://postman.memetic.org/cgi-bin/mailman/listinfo/observium http://postman.memetic.org/cgi-bin/mailman/listinfo/observium
observium mailing list observium@observium.org mailto:observium@observium.org http://postman.memetic.org/cgi-bin/mailman/listinfo/observium http://postman.memetic.org/cgi-bin/mailman/listinfo/observium
observium mailing list observium@observium.org mailto:observium@observium.org http://postman.memetic.org/cgi-bin/mailman/listinfo/observium http://postman.memetic.org/cgi-bin/mailman/listinfo/observium
observium mailing list observium@observium.org mailto:observium@observium.org http://postman.memetic.org/cgi-bin/mailman/listinfo/observium http://postman.memetic.org/cgi-bin/mailman/listinfo/observium
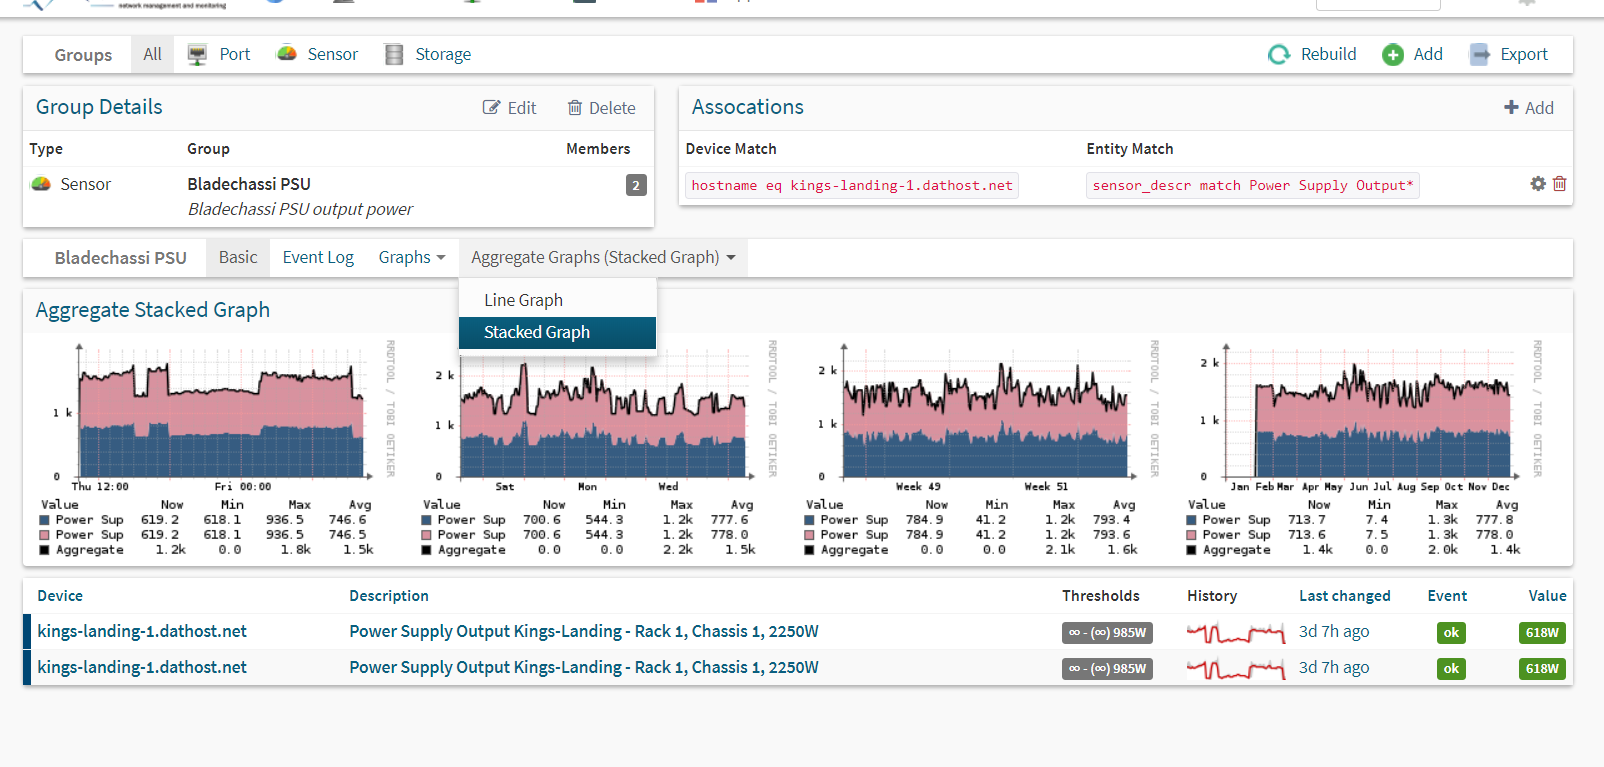
Look for "aggregated graph" and choose a stacked graph. That should be what you are looking for /Markus
Den 29 dec. 2017 07:24 skrev "Youssef BENGELLOUN - ZAHR" <ybzahr@prodware.fr
:
Hi,
That’s exactly what I use and it’s working perfectly fine. In your group definition, you need to match the correct attribute for your Entity Match.
Best regards.
*Youssef BENGELLOUN - ZAHR* - Consultant Expert Prodware France T : +33 979 999 000 - F : +33 988 814 001 - ybzahr@prodware.fr
Web : prodware.fr http://www.prodware.fr
http://twitter.com/Prodware/ http://www.facebook.com/Prodware/ https://www.linkedin.com/company/prodwarefrance https://www.youtube.com/c/ProdwareFrance http://www.viadeo.com/fr/company/prodware http://www.prodware.fr/social-network/
*De : *Darrell Budic budic@onholyground.com *Date : *vendredi 29 décembre 2017 à 03:29 *À : *Youssef BENGELLOUN - ZAHR ybzahr@prodware.fr, Observium < observium@observium.org> *Objet : *Re: [Observium] multi device graph for sensors?
Ah, that part was easy, but not quite what I’m after ;) I want a single graph that is the sum of all the group device's for that sensor value. Sort of like setting up a “Transit” port type and getting a total transit value for all ports labeled Transit, for for Apparent Power on a bunch of APC PDUs.
*From:* Youssef BENGELLOUN - ZAHR ybzahr@prodware.fr *Subject:* Re: [Observium] multi device graph for sensors? *Date:* December 28, 2017 at 6:18:45 PM CST *To:* Observium
When you select your group and access it’s details, you’ll find a ‘graph’ tab.
Select your favorite flavor and you are good to go :-)
Best regards.
Le 29 déc. 2017 à 01:14, Darrell Budic budic@onholyground.com a écrit :
I made a group of the devices, but wasn’t able to figure out how to get a graph out of them as a group. Any pointers or examples?
*From:* Markus Klock markus@best-practice.se *Subject:* Re: [Observium] multi device graph for sensors? *Date:* December 28, 2017 at 4:08:04 PM CST *To:* Observium
Sure you can, just make a group of all the sensors you want :)
/Markus
*Youssef BENGELLOUN - ZAHR* - Consultant Expert Prodware France T : +33 979 999 000 - F : +33 988 814 001 - ybzahr@prodware.fr
<image31535a.PNG>
Web : prodware.fr http://www.prodware.fr/
<imagee4b25c.JPG> http://twitter.com/Prodware/ <imagecef791.JPG> http://www.facebook.com/Prodware/ <image01a3e9.JPG> https://www.linkedin.com/company/prodwarefrance <imageafadb0.JPG> https://www.youtube.com/c/ProdwareFrance <imagecf9fe4.JPG> http://www.viadeo.com/fr/company/prodware <image5a6ac4.JPG> http://www.prodware.fr/social-network/
2017-12-28 22:55 GMT+01:00 Darrell Budic budic@onholyground.com:
Is there a way to get a summary (and sum) of a particular sensor? I’d like to have a one graph for all my PDUs with the apower attribute summed up for a total, see what the absolute # is.
-Darrell _______________________________________________ observium mailing list observium@observium.org http://postman.memetic.org/cgi-bin/mailman/listinfo/observium
observium mailing list observium@observium.org http://postman.memetic.org/cgi-bin/mailman/listinfo/observium
observium mailing list observium@observium.org http://postman.memetic.org/cgi-bin/mailman/listinfo/observium
observium mailing list observium@observium.org http://postman.memetic.org/cgi-bin/mailman/listinfo/observium
observium mailing list observium@observium.org http://postman.memetic.org/cgi-bin/mailman/listinfo/observium

Hi,
sorry darrel, i don’t want to hijack your thread but I have exactly the same problem and maybe the solution is the same for us both.
Am 29.12.2017 um 09:36 schrieb Markus Klock <markus@best-practice.semailto:markus@best-practice.se>:
Look for "aggregated graph" and choose a stacked graph. That should be what you are looking for /Markus
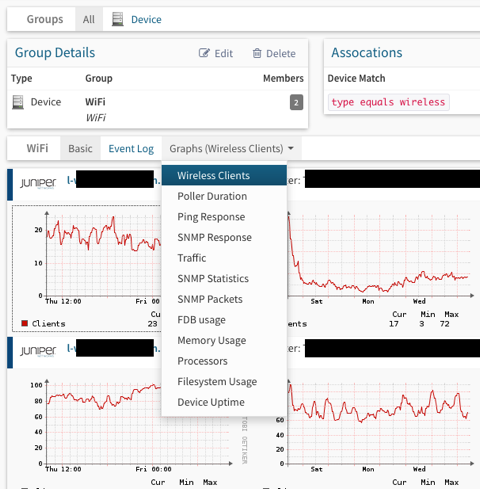
I can’t find anything like „aggregated graph“. Maybe this is only possible with specific entities?
cheers Helge
[cid:8A9BCCBC-B421-4A78-A27E-112FD9C7C129]
Hi guys, this is how it should look: [image: Infogad bild 1]
/Markus
2017-12-29 10:00 GMT+01:00 Wiethoff, Helge Helge.Wiethoff@thga.de:
Hi,
sorry darrel, i don’t want to hijack your thread but I have exactly the same problem and maybe the solution is the same for us both.
Am 29.12.2017 um 09:36 schrieb Markus Klock markus@best-practice.se:
Look for "aggregated graph" and choose a stacked graph. That should be what you are looking for /Markus
I can’t find anything like „aggregated graph“. Maybe this is only possible with specific entities?
cheers Helge
observium mailing list observium@observium.org http://postman.memetic.org/cgi-bin/mailman/listinfo/observium
Hi Markus,
Am 29.12.2017 um 10:19 schrieb Markus Klock markus@best-practice.se:
Hi guys, this is how it should look: <image.png>
thanks for the screenshot. So it's clear that I'm not totally blind :-). I guess the entity definition in includes/definitions/entities.inc.php is missing the agg_graphs part. As it is wireless in my case i dont think it will be fixed.
cheers Helge
Yes, thanks for the screenshot, that helps. I’ll play with the setup and entity description and see if I can’t get it to do the aggregate graph. Are there any lists of the entity types and variables out there besides the include files?
-Darrell
From: Wiethoff, Helge Helge.Wiethoff@thga.de Subject: Re: [Observium] multi device graph for sensors? Date: December 29, 2017 at 9:21:00 AM CST To: Observium
Hi Markus,
Am 29.12.2017 um 10:19 schrieb Markus Klock markus@best-practice.se:
Hi guys, this is how it should look: <image.png>
thanks for the screenshot. So it's clear that I'm not totally blind :-). I guess the entity definition in includes/definitions/entities.inc.php is missing the agg_graphs part. As it is wireless in my case i dont think it will be fixed.
cheers Helge
observium mailing list observium@observium.org http://postman.memetic.org/cgi-bin/mailman/listinfo/observium
Figured it out, I had my group setup for Devices and not Sensors, recreating that and getting a proper definition of the entity types I wanted got it going properly. I notice it doesn’t always add up the Now and Min on my Power graphs, and sometimes only seems to add up a partial value. Anyone else notice this?
FYI, the entity types are pretty well documented, they’re linked from the “Creating Alert Checkers” section of the Alerting documentation.
From: Darrell Budic budic@onholyground.com Subject: Re: [Observium] multi device graph for sensors? Date: December 29, 2017 at 10:36:53 AM CST To: Observium
Yes, thanks for the screenshot, that helps. I’ll play with the setup and entity description and see if I can’t get it to do the aggregate graph. Are there any lists of the entity types and variables out there besides the include files?
-Darrell
From: Wiethoff, Helge <Helge.Wiethoff@thga.de mailto:Helge.Wiethoff@thga.de> Subject: Re: [Observium] multi device graph for sensors? Date: December 29, 2017 at 9:21:00 AM CST To: Observium
Hi Markus,
Am 29.12.2017 um 10:19 schrieb Markus Klock <markus@best-practice.se mailto:markus@best-practice.se>:
Hi guys, this is how it should look: <image.png>
thanks for the screenshot. So it's clear that I'm not totally blind :-). I guess the entity definition in includes/definitions/entities.inc.php is missing the agg_graphs part. As it is wireless in my case i dont think it will be fixed.
cheers Helge
observium mailing list observium@observium.org mailto:observium@observium.org http://postman.memetic.org/cgi-bin/mailman/listinfo/observium
observium mailing list observium@observium.org http://postman.memetic.org/cgi-bin/mailman/listinfo/observium
participants (4)
-
 Darrell Budic
 -
 Markus Klock
 -
 Wiethoff, Helge
 -
 Youssef BENGELLOUN - ZAHR