
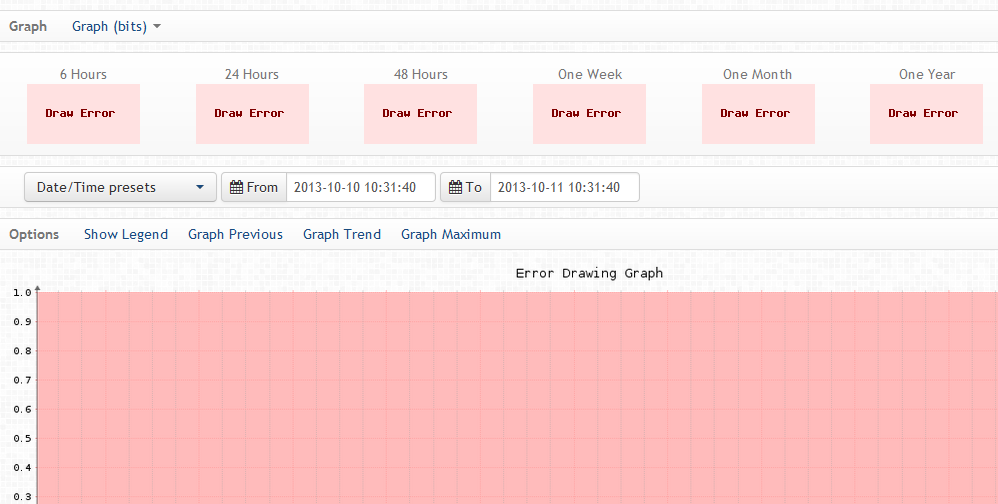
I have a number of power meters from tripplite and obviously they don't have network statistics for traffic. So, I get the attached errors for the ports graphs on the overview page and when I click on the ports, where it takes you to the graphs of all the traffic.
I want to be able to disable the display of this, since everything else is correct. Is there an element in code somewhere that I can just comment that out or something?
Regards, Ryan Milton MVS Network Manager o: 201-447-1505 x124 c: 862-249-5230 www.mvsusa.comhttp://www.mvsusa.com/ [MVS final logo GOOD very small]

Hi,
Why is it obvious they don't have network statistics? Are you polling them through the cloud?
From your bizarrely small screenshot it looks like 2 interfaces are detected though.
Tom
On 10/11/2013 03:20 PM, Ryan Milton wrote:
I have a number of power meters from tripplite and obviously they don't have network statistics for traffic. So, I get the attached errors for the ports graphs on the overview page and when I click on the ports, where it takes you to the graphs of all the traffic.
I want to be able to disable the display of this, since everything else is correct. Is there an element in code somewhere that I can just comment that out or something?
Regards,
Ryan Milton
MVS Network Manager
o: 201-447-1505 x124
c: 862-249-5230
www.mvsusa.com http://www.mvsusa.com/
MVS final logo GOOD very small
observium mailing list observium@observium.org http://postman.memetic.org/cgi-bin/mailman/listinfo/observium
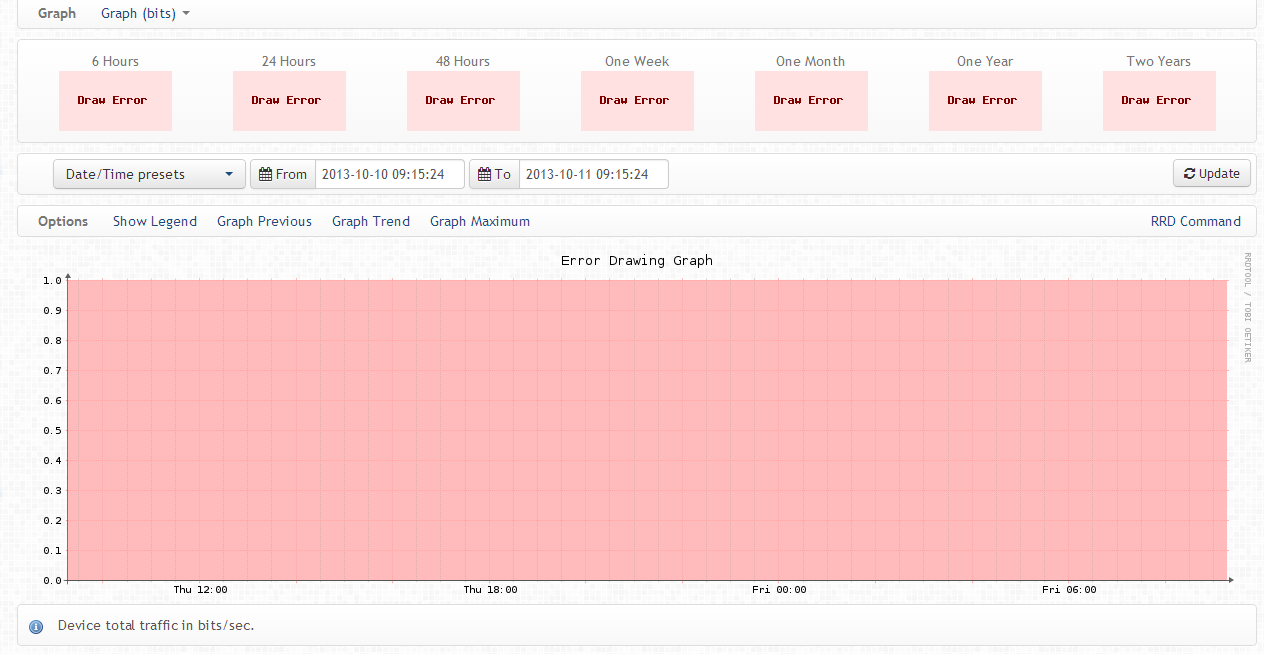
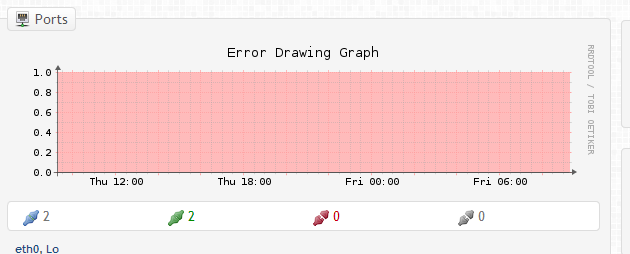
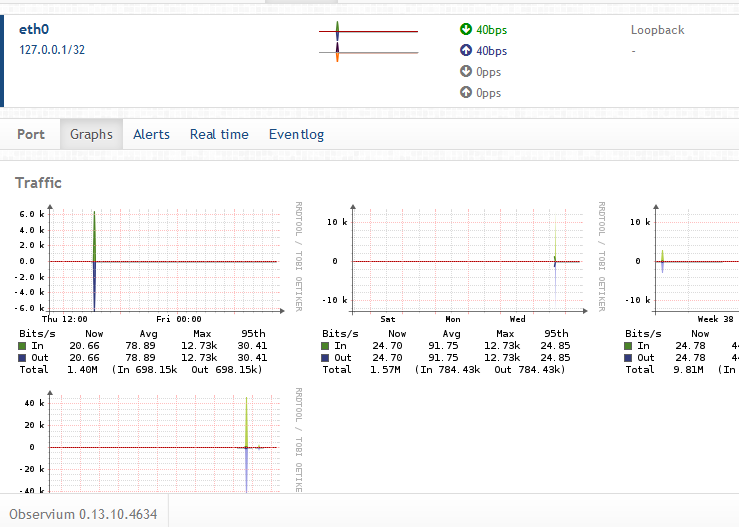
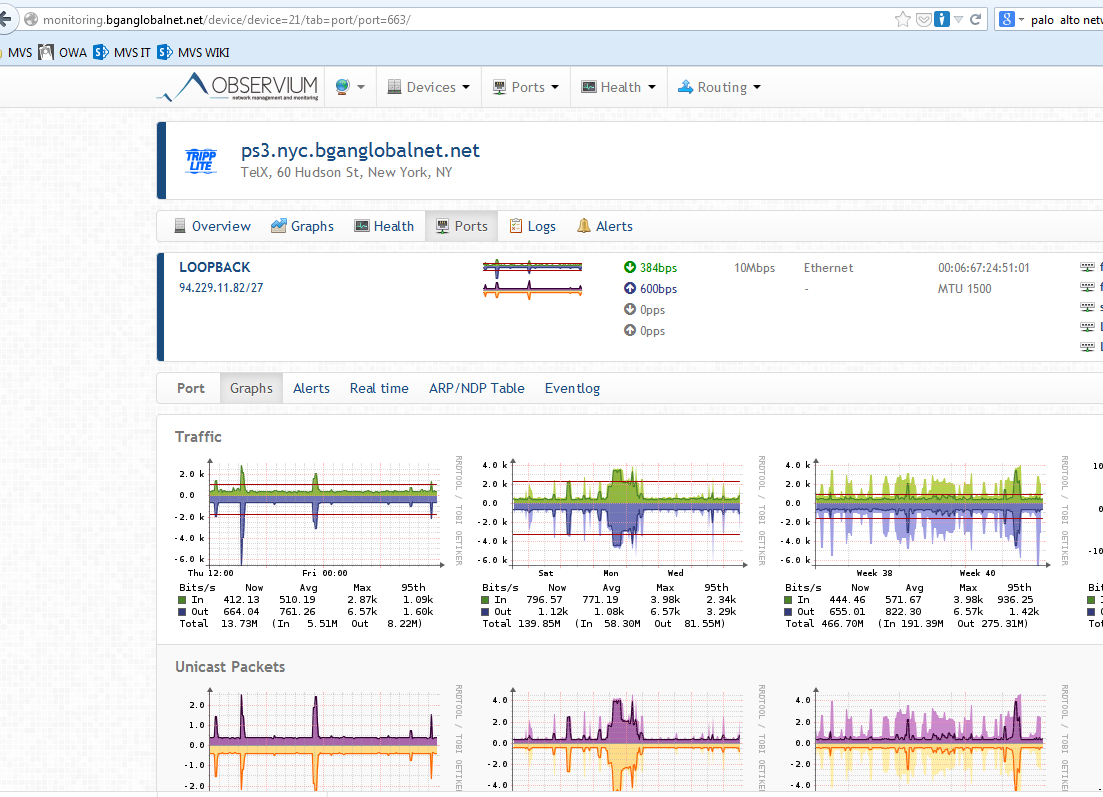
Again, this image is from the Overview Page: [cid:image001.png@01CEC66D.53A832F0] This is one of the two interfaces that you refer: [cid:image002.png@01CEC66D.53A832F0] When I click on the graph from the main overview page, I get this: [cid:image003.png@01CEC66D.53A832F0]
The server that is polling them is in the same rack as the power meters. I hope these images are large enough.
Regards, Ryan Milton MVS Network Manager o: 201-447-1505 x124 c: 862-249-5230 www.mvsusa.comhttp://www.mvsusa.com/ [MVS final logo GOOD very small]
From: observium [mailto:observium-bounces@observium.org] On Behalf Of Tom Laermans Sent: Friday, October 11, 2013 9:31 AM To: Observium Network Observation System Subject: Re: [Observium] Power meter error graphs
Hi,
Why is it obvious they don't have network statistics? Are you polling them through the cloud?
From your bizarrely small screenshot it looks like 2 interfaces are detected though.
Tom
On 10/11/2013 03:20 PM, Ryan Milton wrote: [cid:image005.gif@01CEC66D.53A832F0] I have a number of power meters from tripplite and obviously they don't have network statistics for traffic. So, I get the attached errors for the ports graphs on the overview page and when I click on the ports, where it takes you to the graphs of all the traffic.
I want to be able to disable the display of this, since everything else is correct. Is there an element in code somewhere that I can just comment that out or something?
Regards, Ryan Milton MVS Network Manager o: 201-447-1505 x124 c: 862-249-5230 www.mvsusa.comhttp://www.mvsusa.com/ [MVS final logo GOOD very small]
_______________________________________________
observium mailing list
observium@observium.orgmailto:observium@observium.org
http://postman.memetic.org/cgi-bin/mailman/listinfo/observium

That's a strange IP and ifType for an interface called eth0...
What is the other one?
And why the annoyingly limited screenshots?
adam.
On 2013-10-11 15:33, Ryan Milton wrote:
Again, this image is from the Overview Page:
This is one of the two interfaces that you refer:
When I click on the graph from the main overview page, I get this:
The server that is polling them is in the same rack as the power meters. I hope these images are large enough.
Regards,
Ryan Milton
MVS Network Manager
o: 201-447-1505 x124
c: 862-249-5230
www.mvsusa.com [2]
FROM: observium [mailto:observium-bounces@observium.org] ON BEHALF OF Tom Laermans SENT: Friday, October 11, 2013 9:31 AM TO: Observium Network Observation System SUBJECT: Re: [Observium] Power meter error graphs
Hi,
Why is it obvious they don't have network statistics? Are you polling them through the cloud?
From your bizarrely small screenshot it looks like 2 interfaces are detected though.
Tom
On 10/11/2013 03:20 PM, Ryan Milton wrote:
I have a number of power meters from tripplite and obviously they don't have network statistics for traffic. So, I get the attached errors for the ports graphs on the overview page and when I click on the ports, where it takes you to the graphs of all the traffic.
I want to be able to disable the display of this, since everything else is correct. Is there an element in code somewhere that I can just comment that out or something?
Regards,
Ryan Milton
MVS Network Manager
o: 201-447-1505 x124
c: 862-249-5230
www.mvsusa.com [2]
observium mailing list
observium@observium.org
http://postman.memetic.org/cgi-bin/mailman/listinfo/observium [1]
Links:
[1] http://postman.memetic.org/cgi-bin/mailman/listinfo/observium [2] http://www.mvsusa.com/
observium mailing list observium@observium.org http://postman.memetic.org/cgi-bin/mailman/listinfo/observium
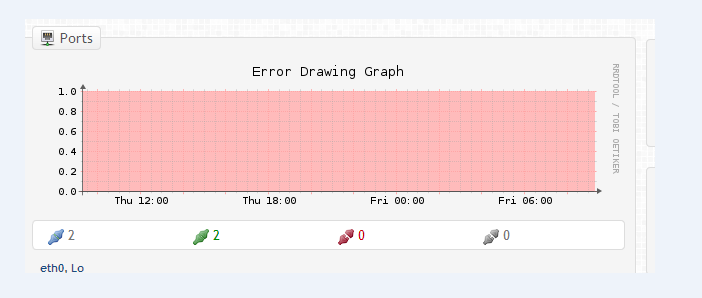
I attached the other. What is odd is that the Loopback is the actual interface! And it is showing eth0 as the loopback! I attached a bigger image.
Regards, Ryan Milton MVS Network Manager o: 201-447-1505 x124 c: 862-249-5230 www.mvsusa.com
-----Original Message----- From: observium [mailto:observium-bounces@observium.org] On Behalf Of Adam Armstrong Sent: Friday, October 11, 2013 10:37 AM To: Observium Network Observation System Subject: Re: [Observium] Power meter error graphs
That's a strange IP and ifType for an interface called eth0...
What is the other one?
And why the annoyingly limited screenshots?
adam.
On 2013-10-11 15:33, Ryan Milton wrote:
Again, this image is from the Overview Page:
This is one of the two interfaces that you refer:
When I click on the graph from the main overview page, I get this:
The server that is polling them is in the same rack as the power meters. I hope these images are large enough.
Regards,
Ryan Milton
MVS Network Manager
o: 201-447-1505 x124
c: 862-249-5230
www.mvsusa.com [2]
FROM: observium [mailto:observium-bounces@observium.org] ON BEHALF
OF
Tom Laermans SENT: Friday, October 11, 2013 9:31 AM TO: Observium Network Observation System SUBJECT: Re: [Observium] Power meter error graphs
Hi,
Why is it obvious they don't have network statistics? Are you polling them through the cloud?
From your bizarrely small screenshot it looks like 2 interfaces are detected though.
Tom
On 10/11/2013 03:20 PM, Ryan Milton wrote:
I have a number of power meters from tripplite and obviously they don't have network statistics for traffic. So, I get the attached errors for the ports graphs on the overview page and when I click on the ports, where it takes you to the graphs of all the traffic.
I want to be able to disable the display of this, since everything else is correct. Is there an element in code somewhere that I can just comment that out or something?
Regards,
Ryan Milton
MVS Network Manager
o: 201-447-1505 x124
c: 862-249-5230
www.mvsusa.com [2]
observium mailing list
observium@observium.org
http://postman.memetic.org/cgi-bin/mailman/listinfo/observium [1]
Links:
[1] http://postman.memetic.org/cgi-bin/mailman/listinfo/observium [2] http://www.mvsusa.com/
observium mailing list observium@observium.org http://postman.memetic.org/cgi-bin/mailman/listinfo/observium
observium mailing list observium@observium.org http://postman.memetic.org/cgi-bin/mailman/listinfo/observium
On 2013-10-11 16:59, Ryan Milton wrote:
I attached the other. What is odd is that the Loopback is the actual interface! And it is showing eth0 as the loopback! I attached a bigger image.
Yeah, this is a bug with the sensor's software.
We exclude loopback, virtual and sub interfaces from the aggregate graph to try to maintain some amount of relevance. Because both of your interfaces are being reported as loopback, it's ignoring them both, thus it errors about trying to draw a graph with no interfaces.
adam.
Yeah, I don't mind the bug. Is there a way to exclude that view for these devices?
Regards, Ryan Milton MVS Network Manager o: 201-447-1505 x124 c: 862-249-5230 www.mvsusa.com
-----Original Message----- From: observium [mailto:observium-bounces@observium.org] On Behalf Of Adam Armstrong Sent: Friday, October 11, 2013 12:04 PM To: Observium Network Observation System Subject: Re: [Observium] Power meter error graphs
On 2013-10-11 16:59, Ryan Milton wrote:
I attached the other. What is odd is that the Loopback is the actual interface! And it is showing eth0 as the loopback! I attached a bigger image.
Yeah, this is a bug with the sensor's software.
We exclude loopback, virtual and sub interfaces from the aggregate graph to try to maintain some amount of relevance. Because both of your interfaces are being reported as loopback, it's ignoring them both, thus it errors about trying to draw a graph with no interfaces.
adam. _______________________________________________ observium mailing list observium@observium.org http://postman.memetic.org/cgi-bin/mailman/listinfo/observium
On 2013-10-11 18:52, Ryan Milton wrote:
Yeah, I don't mind the bug. Is there a way to exclude that view for these devices?
Not at the moment, there's no customization at all for the Overview page.
The modules on there are dynamically include or excluded based on the entities existing.
You could, I suppose, remove the ports from the database and disable the ports poller/discovery modules so that they're never rediscovered :)
adam.
On 11/10/2013 20:00, Adam Armstrong wrote:
On 2013-10-11 18:52, Ryan Milton wrote:
Yeah, I don't mind the bug. Is there a way to exclude that view for these devices?
Not at the moment, there's no customization at all for the Overview page.
The modules on there are dynamically include or excluded based on the entities existing.
You could, I suppose, remove the ports from the database and disable the ports poller/discovery modules so that they're never rediscovered :)
Do we skip the device overview traffic graph if there are no interfaces? I'm not sure about that.
Tom
On 2013-10-12 07:28, Tom Laermans wrote:
On 11/10/2013 20:00, Adam Armstrong wrote: On 2013-10-11 18:52, Ryan Milton wrote: Yeah, I don't mind the bug. Is there a way to exclude that view for these devices?
Not at the moment, there's no customization at all for the Overview page.
The modules on there are dynamically include or excluded based on the entities existing.
You could, I suppose, remove the ports from the database and disable the ports poller/discovery modules so that they're never rediscovered :) Do we skip the device overview traffic graph if there are no interfaces? I'm not sure about that.
We do, in the ports.inc.php itself.
participants (3)
-
 Adam Armstrong
 -
 Ryan Milton
 -
 Tom Laermans