
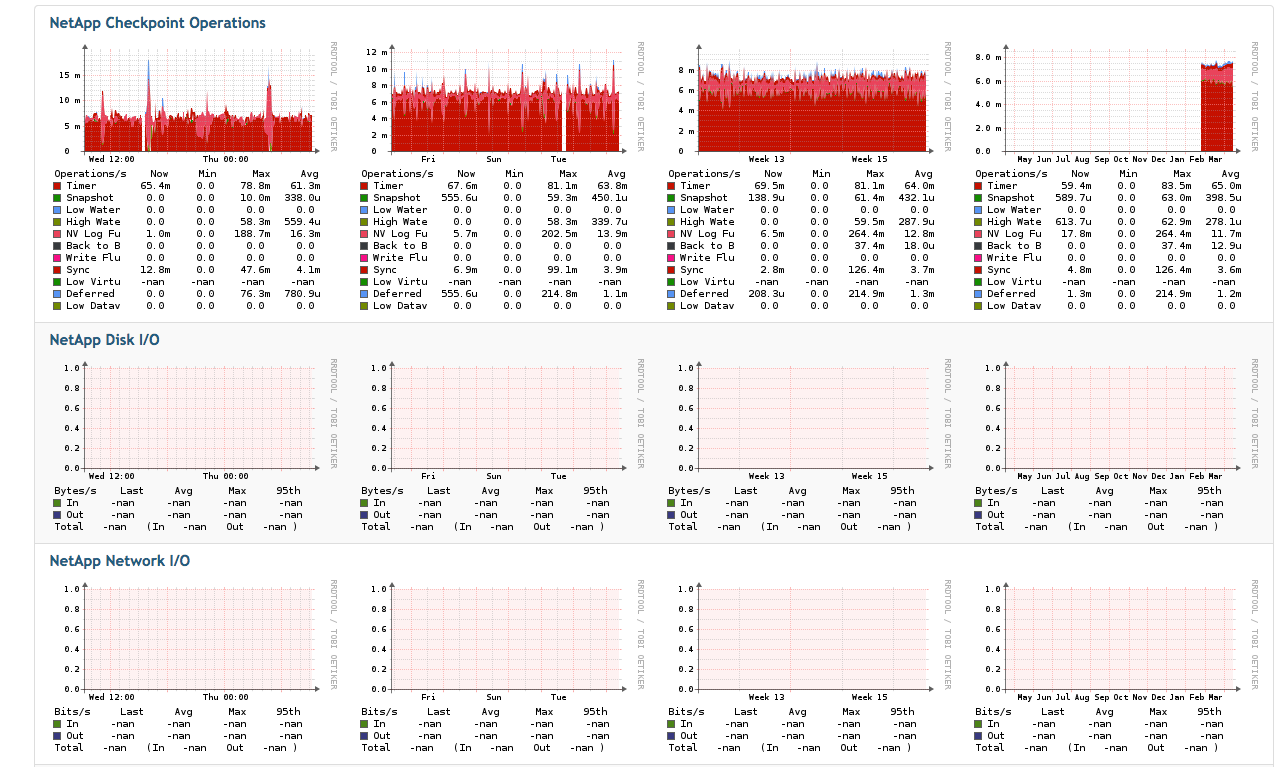
Apologies. I have attached a screenshot of part of the Observium Graphs page for one of our NetApp devices. You can see in the image that some of the graphs are displaying properly, but not all of them.
Thanks.
-Pete
On 2015-04-16 04:59, Adam Armstrong wrote:
No one will understand what you're talking about, so no one will reply. Include screenshots.
adam.
Sent from Mailbird [1]
On 16/04/2015 00:43:08, Peter Loron peterl@standingwave.org wrote:We're running Observium Pro 0.15.4.6386, and I have added our NetApp 2230 filers. The filers are running v8.2.2 Cluster. I'm getting some
data, but the graphs in Observium for Network I/O and Disk I/O are all NaN.
Any ideas?
I'm willing to poke into the issue (bad interpretation of returned values? Need updated OID?), but not sure where to start.
Thanks.
-Pete