
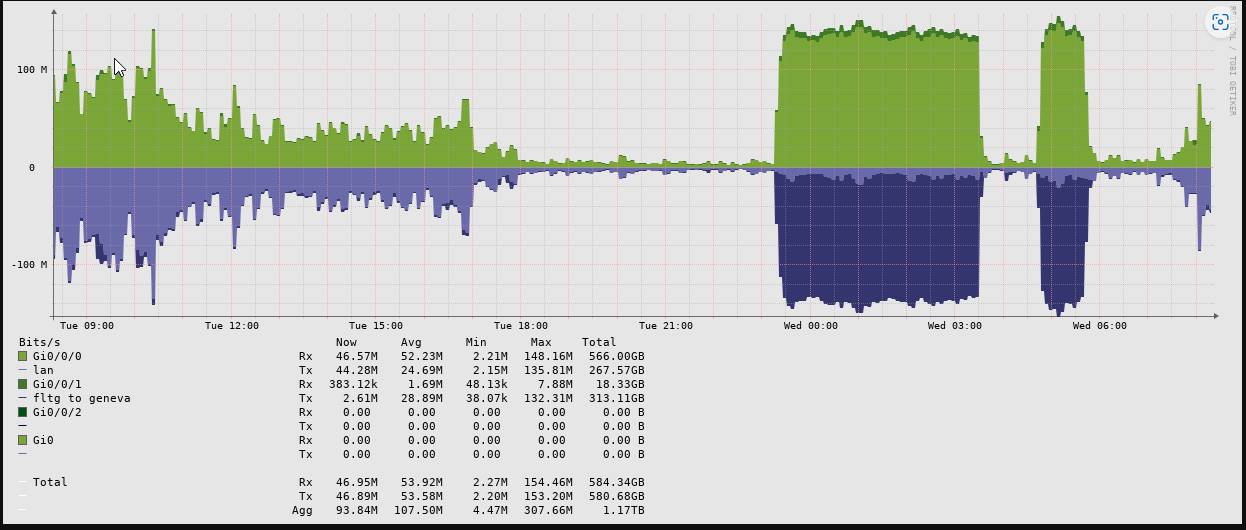
Hi, after several years of using Observium, it just occurred to me recently that I am not sure how to read the traffic graphs. For example, I always thought that above "0" on the horizontal axis was transmit and below was receive. But as I look closer, that cannot be. Also, the colors on the graph do not seem to line up with the legend...for example in this graph, I see 4 colors, light/dark green and light/dark purple. But the legend seems to have the same color for g0/0/0 as g0. I guess my questions are: How are transmits and receives represented on the traffic graphs? Why are the colors in the graph not lining up with the legend? What does negative 100M represent?
thanks
[cid:image004.jpg@01D9F11E.FB948DB0]
Tony Guadagno O +1 585 577 1003 C +1 585 703 6700 E tonyg@guadagnoconsulting.commailto:tonyg@guadagnoconsulting.com [cid:image001.jpg@01D84DD6.FC9912E0]