
Hello
We are using latest Observium 20.9.10749 (stable), paid edition Noted that in some graphs, kind of spikes. Debugging shows that the polling interval is not every 300 seconds:
/37554|1603201212|267|1785377894|1068531295|386467237639270|41301474049631|87Mbps|22.7Mbps|v2c// //37554|1603201534|322|2182521058|2288947079|386489109618914|41306989432711|67.9Mbps|17.1Mbps|v2c// //37554|1603201811|277|2993214954|3745224137|386511395149290|41312740677065|80.4Mbps|20.7Mbps|v2c// //37554|1603202130|319|2034988746|794409408|386536206726858|41318379796928|77.7Mbps|17.6Mbps|v2c// //37554|1603202410|280|215877678|2105208367|386560157419566|41323985563183|85.5Mbps|20Mbps|v2c// //37554|1603202737|327|2876073363|3906420769|386584292451731|41330081742881|73.8Mbps|18.6Mbps|v2c// //37554|1603203010|273|816113491|1430194856|386608002295635|41336195451560|86.8Mbps|22.3Mbps|v2c/
So, the graphs is with spikes, because not similar period taken.
Obviously, each 5 minutes, CPU raises to 75% ( Xeon 16 Cores, 8 Gb RAM, )
/[2020/10/20 11:21:04 -0300] observium-wrapper(611935): /opt/observium/observium-wrapper: processed 160 devices in 62.68 seconds with 32 threads, load average (5min) 8.45/
What can I do to fix it?
Regards

Hi,
Its not possible to get exactly 300 second polling because of the variable time it takes to poll things. Its also not required, because RRDtool will calculate correct rates for the poller period.
There shouldnt be spikes outside the event that devices return an incorrect counter and then revert back to the correct counter. This happens on a few devices, but its pretty rare.
Adam.
From: observium observium-bounces@observium.org On Behalf Of Ing. Andrés Gallo via observium Sent: 20 October 2020 18:27 To: observium@observium.org Cc: Ing. Andrés Gallo agallo@cotel.com.ar Subject: [Observium] Polling not periodical
Hello
We are using latest Observium 20.9.10749 (stable), paid edition Noted that in some graphs, kind of spikes. Debugging shows that the polling interval is not every 300 seconds:
37554|1603201212|267|1785377894|1068531295|386467237639270|41301474049631|87 Mbps|22.7Mbps|v2c 37554|1603201534|322|2182521058|2288947079|386489109618914|41306989432711|67 .9Mbps|17.1Mbps|v2c 37554|1603201811|277|2993214954|3745224137|386511395149290|41312740677065|80 .4Mbps|20.7Mbps|v2c 37554|1603202130|319|2034988746|794409408|386536206726858|41318379796928|77. 7Mbps|17.6Mbps|v2c 37554|1603202410|280|215877678|2105208367|386560157419566|41323985563183|85. 5Mbps|20Mbps|v2c 37554|1603202737|327|2876073363|3906420769|386584292451731|41330081742881|73 .8Mbps|18.6Mbps|v2c 37554|1603203010|273|816113491|1430194856|386608002295635|41336195451560|86. 8Mbps|22.3Mbps|v2c
So, the graphs is with spikes, because not similar period taken.
Obviously, each 5 minutes, CPU raises to 75% ( Xeon 16 Cores, 8 Gb RAM, )
[2020/10/20 11:21:04 -0300] observium-wrapper(611935): /opt/observium/observium-wrapper: processed 160 devices in 62.68 seconds with 32 threads, load average (5min) 8.45
What can I do to fix it?
Regards
Hi Adam
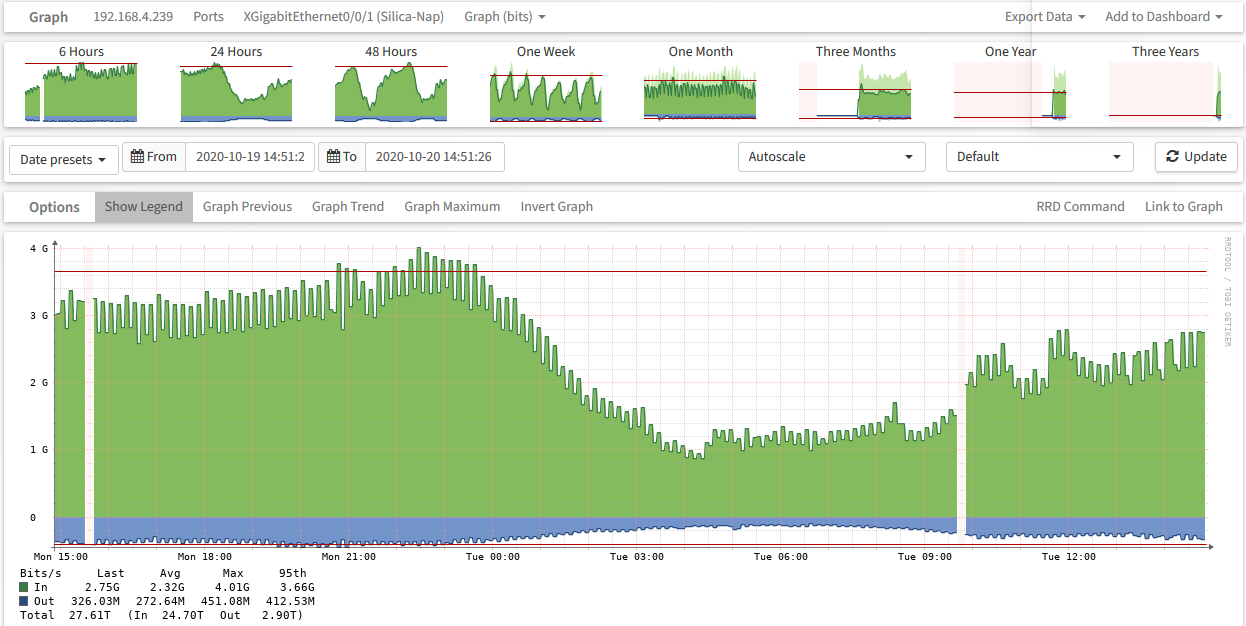
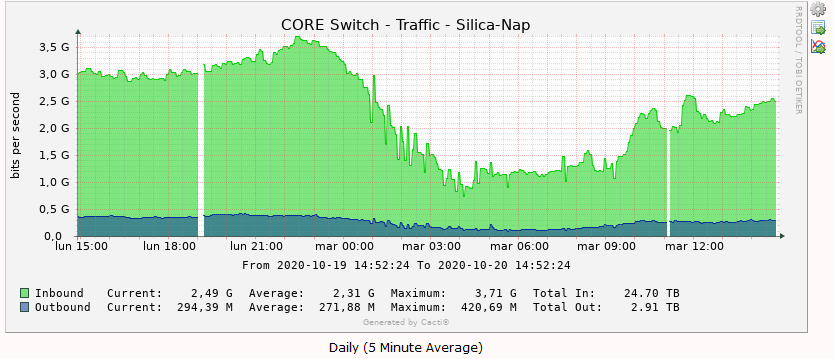
Well, it's happening then. Also set up Cacti to poll same interface to compare:
Observium:
Cacti:
As you can see, not so evident 'saw' in Cacti.
Moving observium to another server ( 24 cores, 8 gb RAM ) slightly improve it, but not enough to make curve 'smooth'. Could be any performance tunning ( I tried wrappers and threads variables )
Regards
Andres El 20/10/2020 a las 14:40, Adam Armstrong via observium escribió:
Saludos
Hi,
It’s not possible to get exactly 300 second polling because of the variable time it takes to poll things. It’s also not required, because RRDtool will calculate correct rates for the poller period.
There shouldn’t be spikes outside the event that devices return an incorrect counter and then revert back to the correct counter. This happens on a few devices, but it’s pretty rare.
Adam.
*From:*observium observium-bounces@observium.org *On Behalf Of *Ing. Andrés Gallo via observium *Sent:* 20 October 2020 18:27 *To:* observium@observium.org *Cc:* Ing. Andrés Gallo agallo@cotel.com.ar *Subject:* [Observium] Polling not periodical
Hello
We are using latest Observium 20.9.10749 (stable), paid edition Noted that in some graphs, kind of spikes. Debugging shows that the polling interval is not every 300 seconds:
/37554|1603201212|267|1785377894|1068531295|386467237639270|41301474049631|87Mbps|22.7Mbps|v2c 37554|1603201534|322|2182521058|2288947079|386489109618914|41306989432711|67.9Mbps|17.1Mbps|v2c 37554|1603201811|277|2993214954|3745224137|386511395149290|41312740677065|80.4Mbps|20.7Mbps|v2c 37554|1603202130|319|2034988746|794409408|386536206726858|41318379796928|77.7Mbps|17.6Mbps|v2c 37554|1603202410|280|215877678|2105208367|386560157419566|41323985563183|85.5Mbps|20Mbps|v2c 37554|1603202737|327|2876073363|3906420769|386584292451731|41330081742881|73.8Mbps|18.6Mbps|v2c 37554|1603203010|273|816113491|1430194856|386608002295635|41336195451560|86.8Mbps|22.3Mbps|v2c/
So, the graphs is with spikes, because not similar period taken.
Obviously, each 5 minutes, CPU raises to 75% ( Xeon 16 Cores, 8 Gb RAM, )
/[2020/10/20 11:21:04 -0300] observium-wrapper(611935): /opt/observium/observium-wrapper: processed 160 devices in 62.68 seconds with 32 threads, load average (5min) 8.45/
What can I do to fix it?
Regards
-- Saludos,
* Ing. Andrés E. Gallo*
<="" img="" class="auto-style6">
Tel (02255)-46-1641
Móvil(02255)-15-57-0220 Paseo 114 y Av. 3 (B7165) Villa Gesell-Bs.As.
agallo@cotel.com.ar mailto:agallo@fecosur.com.ar
http://www.gesell.com.ar http://www.nuestro.com.ar
observium mailing list observium@observium.org http://postman.memetic.org/cgi-bin/mailman/listinfo/observium
Haha, how bizarre. Thats the kind of thing you see when you have a very high polling frequency interacting with a very low counter update frequency.
What is that device, and how frequently does it update its interface counters? oO
Adam.
From: Ing. Andrés Gallo agallo@cotel.com.ar Sent: 20 October 2020 18:56 To: Observium observium@observium.org Cc: Adam Armstrong adama@observium.org Subject: Re: [Observium] Polling not periodical
Hi Adam
Well, it's happening then. Also set up Cacti to poll same interface to compare:
Observium:
Cacti:
As you can see, not so evident 'saw' in Cacti.
Moving observium to another server ( 24 cores, 8 gb RAM ) slightly improve it, but not enough to make curve 'smooth'. Could be any performance tunning ( I tried wrappers and threads variables )
Regards
Andres
El 20/10/2020 a las 14:40, Adam Armstrong via observium escribió:
Hi,
Its not possible to get exactly 300 second polling because of the variable time it takes to poll things. Its also not required, because RRDtool will calculate correct rates for the poller period.
There shouldnt be spikes outside the event that devices return an incorrect counter and then revert back to the correct counter. This happens on a few devices, but its pretty rare.
Adam.
From: observium mailto:observium-bounces@observium.org observium-bounces@observium.org On Behalf Of Ing. Andrés Gallo via observium Sent: 20 October 2020 18:27 To: observium@observium.org mailto:observium@observium.org Cc: Ing. Andrés Gallo mailto:agallo@cotel.com.ar agallo@cotel.com.ar Subject: [Observium] Polling not periodical
Hello
We are using latest Observium 20.9.10749 (stable), paid edition Noted that in some graphs, kind of spikes. Debugging shows that the polling interval is not every 300 seconds:
37554|1603201212|267|1785377894|1068531295|386467237639270|41301474049631|87 Mbps|22.7Mbps|v2c 37554|1603201534|322|2182521058|2288947079|386489109618914|41306989432711|67 .9Mbps|17.1Mbps|v2c 37554|1603201811|277|2993214954|3745224137|386511395149290|41312740677065|80 .4Mbps|20.7Mbps|v2c 37554|1603202130|319|2034988746|794409408|386536206726858|41318379796928|77. 7Mbps|17.6Mbps|v2c 37554|1603202410|280|215877678|2105208367|386560157419566|41323985563183|85. 5Mbps|20Mbps|v2c 37554|1603202737|327|2876073363|3906420769|386584292451731|41330081742881|73 .8Mbps|18.6Mbps|v2c 37554|1603203010|273|816113491|1430194856|386608002295635|41336195451560|86. 8Mbps|22.3Mbps|v2c
So, the graphs is with spikes, because not similar period taken.
Obviously, each 5 minutes, CPU raises to 75% ( Xeon 16 Cores, 8 Gb RAM, )
[2020/10/20 11:21:04 -0300] observium-wrapper(611935): /opt/observium/observium-wrapper: processed 160 devices in 62.68 seconds with 32 threads, load average (5min) 8.45
What can I do to fix it?
Regards
Adam
it's a /S6720-50L-HI-48S Huawei Versatile Routing Platform Software VRP (R) software,Version 5.170 (S6720 V200R019C10SPC500) Copyright (C) 2007 Huawei Technologies Co., Ltd./
This are graphing OK: /S5720-28X-SI-24S-AC Huawei Versatile Routing Platform Software VRP (R) software,Version 5.170 (S5720 V200R010C00SPC600) Copyright (C) 2007 Huawei Technologies Co., Ltd. ///S5720-28X-LI-24S-AC Huawei Versatile Routing Platform Software VRP (R) software,Version 5.170 (S5720 V200R019C10SPC500) Copyright (C) 2007 Huawei Technologies Co., Ltd.
//This is not: /-S6720-30C-EI-24S-AC Huawei Versatile Routing Platform Software VRP (R) software,Version 5.170 (S6720 V200R019C10SPC500) Copyright (C) 2007 Huawei Technologies Co., Ltd. / Regards
Andres/ / El 20/10/2020 a las 16:00, Adam Armstrong via observium escribió:
Saludos
Haha, how bizarre. That’s the kind of thing you see when you have a very high polling frequency interacting with a very low counter update frequency.
What is that device, and how frequently does it update its interface counters? oO
Adam.
*From:*Ing. Andrés Gallo agallo@cotel.com.ar *Sent:* 20 October 2020 18:56 *To:* Observium observium@observium.org *Cc:* Adam Armstrong adama@observium.org *Subject:* Re: [Observium] Polling not periodical
Hi Adam
Well, it's happening then. Also set up Cacti to poll same interface to compare:
Observium:
Cacti:
As you can see, not so evident 'saw' in Cacti.
Moving observium to another server ( 24 cores, 8 gb RAM ) slightly improve it, but not enough to make curve 'smooth'. Could be any performance tunning ( I tried wrappers and threads variables )
Regards
Andres
El 20/10/2020 a las 14:40, Adam Armstrong via observium escribió:
Hi,

It’s not possible to get exactly 300 second polling because of the
variable time it takes to poll things. It’s also not required,
because RRDtool will calculate correct rates for the poller period.

There shouldn’t be spikes outside the event that devices return an
incorrect counter and then revert back to the correct counter.
This happens on a few devices, but it’s pretty rare.

Adam.

*From:*observium <observium-bounces@observium.org>
<mailto:observium-bounces@observium.org> *On Behalf Of *Ing.
Andrés Gallo via observium
*Sent:* 20 October 2020 18:27
*To:* observium@observium.org <mailto:observium@observium.org>
*Cc:* Ing. Andrés Gallo <agallo@cotel.com.ar>
<mailto:agallo@cotel.com.ar>
*Subject:* [Observium] Polling not periodical

Hello

We are using latest Observium 20.9.10749 (stable), paid edition
Noted that in some graphs, kind of spikes.
Debugging shows that the polling interval is not every 300 seconds:

/37554|1603201212|267|1785377894|1068531295|386467237639270|41301474049631|87Mbps|22.7Mbps|v2c
37554|1603201534|322|2182521058|2288947079|386489109618914|41306989432711|67.9Mbps|17.1Mbps|v2c
37554|1603201811|277|2993214954|3745224137|386511395149290|41312740677065|80.4Mbps|20.7Mbps|v2c
37554|1603202130|319|2034988746|794409408|386536206726858|41318379796928|77.7Mbps|17.6Mbps|v2c
37554|1603202410|280|215877678|2105208367|386560157419566|41323985563183|85.5Mbps|20Mbps|v2c
37554|1603202737|327|2876073363|3906420769|386584292451731|41330081742881|73.8Mbps|18.6Mbps|v2c
37554|1603203010|273|816113491|1430194856|386608002295635|41336195451560|86.8Mbps|22.3Mbps|v2c/

So, the graphs is with spikes, because not similar period taken.

Obviously, each 5 minutes, CPU raises to 75% ( Xeon 16 Cores, 8 Gb
RAM,  )

/[2020/10/20 11:21:04 -0300] observium-wrapper(611935):
/opt/observium/observium-wrapper: processed 160 devices in 62.68
seconds with 32 threads, load average (5min) 8.45/

What can I do to fix it?

Regards

--
Saludos,

* Ing. Andrés E. Gallo*

<="" img="" class="auto-style6">


 Tel (02255)-46-1641

Móvil(02255)-15-57-0220
    Paseo 114 y Av. 3
(B7165) Villa Gesell-Bs.As.

agallo@cotel.com.ar <mailto:agallo@fecosur.com.ar>

http://www.gesell.com.ar <http://www.nuestro.com.ar>


_______________________________________________

observium mailing list

observium@observium.org  <mailto:observium@observium.org>

http://postman.memetic.org/cgi-bin/mailman/listinfo/observium
observium mailing list observium@observium.org http://postman.memetic.org/cgi-bin/mailman/listinfo/observium
participants (2)
-
 Adam Armstrong
 -
 Ing. Andrés Gallo