
Hello,
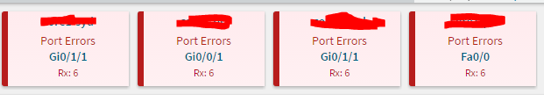
My dashboard is showing port errors and I'm trying to understand where this information is coming from ?
[image: Inline image 1]
Those are all different routers.
Here's show int of the 1st one. Are the errors being read from the input error below ? It's been on Rx: 6 for a very long time, even if I clear the counters.
xxxx-xxxx#show int g0/1/1 GigabitEthernet0/1/1 is up, line protocol is up Hardware is SPA-2X1GE-V2, address is 0026.0ba5.0a11 (bia 0026.0ba5.0a11) Description: Management Internet address is 10.75.1.3/24 MTU 1500 bytes, BW 1000000 Kbit/sec, DLY 10 usec, reliability 255/255, txload 1/255, rxload 1/255 Encapsulation ARPA, loopback not set Keepalive not supported Full Duplex, 1000Mbps, link type is force-up, media type is RJ45 output flow-control is on, input flow-control is on ARP type: ARPA, ARP Timeout 04:00:00 Last input 00:00:01, output 00:00:01, output hang never Last clearing of "show interface" counters 14:22:12 Input queue: 0/375/0/0 (size/max/drops/flushes); Total output drops: 0 Queueing strategy: fifo Output queue: 0/40 (size/max) 5 minute input rate 798000 bits/sec, 84 packets/sec 5 minute output rate 56000 bits/sec, 61 packets/sec 3721054 packets input, 4443301060 bytes, 0 no buffer Received 604 broadcasts (0 IP multicasts) 0 runts, 1224 giants, 0 throttles * 1224 input errors*, 0 CRC, 0 frame, 0 overrun, 0 ignored 0 watchdog, 24679 multicast, 0 pause input 1957690 packets output, 267851747 bytes, 0 underruns 0 output errors, 0 collisions, 0 interface resets 0 unknown protocol drops 0 babbles, 0 late collision, 0 deferred 0 lost carrier, 0 no carrier, 0 pause output 0 output buffer failures, 0 output buffers swapped out
Thanks in advance!
Ross.

That’s exactly where it comes from.
-- Jay
From: observium observium-bounces@observium.org on behalf of "Ross [Eve IT]" ross@eve-it.net Reply-To: Observium Public Support observium@observium.org Date: Thursday, March 23, 2017 at 1:37 PM To: "observium@observium.org" observium@observium.org Subject: [Observium] port errors
Hello,
My dashboard is showing port errors and I'm trying to understand where this information is coming from ?
[nline image 1]
Those are all different routers.
Here's show int of the 1st one. Are the errors being read from the input error below ? It's been on Rx: 6 for a very long time, even if I clear the counters.
xxxx-xxxx#show int g0/1/1 GigabitEthernet0/1/1 is up, line protocol is up Hardware is SPA-2X1GE-V2, address is 0026.0ba5.0a11 (bia 0026.0ba5.0a11) Description: Management Internet address is 10.75.1.3/24[10.75.1.3]https://urldefense.proofpoint.com/v2/url?u=http-3A__10.75.1.3_24&d=BQMFaQ&c=sy2pFYeXOTBQJUPqadkFIXq5lzPIgQxhI8DCCAdSjYc&r=ABp-W7DPgLKCKlUN3YMk4NOW3xFdLejq7IJ9RyIqzoE&m=ahOULAnRbu99dv1okntzPGZa6D99YvQ8omakIR9OJwQ&s=rJIir7ibhj5JUb1V0fdT2aeHVDLSrcPt2eJBW9B44Jk&e= MTU 1500 bytes, BW 1000000 Kbit/sec, DLY 10 usec, reliability 255/255, txload 1/255, rxload 1/255 Encapsulation ARPA, loopback not set Keepalive not supported Full Duplex, 1000Mbps, link type is force-up, media type is RJ45 output flow-control is on, input flow-control is on ARP type: ARPA, ARP Timeout 04:00:00 Last input 00:00:01, output 00:00:01, output hang never Last clearing of "show interface" counters 14:22:12 Input queue: 0/375/0/0 (size/max/drops/flushes); Total output drops: 0 Queueing strategy: fifo Output queue: 0/40 (size/max) 5 minute input rate 798000 bits/sec, 84 packets/sec 5 minute output rate 56000 bits/sec, 61 packets/sec 3721054 packets input, 4443301060 bytes, 0 no buffer Received 604 broadcasts (0 IP multicasts) 0 runts, 1224 giants, 0 throttles 1224 input errors, 0 CRC, 0 frame, 0 overrun, 0 ignored 0 watchdog, 24679 multicast, 0 pause input 1957690 packets output, 267851747 bytes, 0 underruns 0 output errors, 0 collisions, 0 interface resets 0 unknown protocol drops 0 babbles, 0 late collision, 0 deferred 0 lost carrier, 0 no carrier, 0 pause output 0 output buffer failures, 0 output buffers swapped out
Thanks in advance!
Ross.
Thanks Jay, should it clear if clear the counters ?
On Fri, Mar 24, 2017 at 10:56 AM, Jay Christopher < jchristopher@shutterfly.com> wrote:
That’s exactly where it comes from.
--
Jay
*From: *observium observium-bounces@observium.org on behalf of "Ross [Eve IT]" ross@eve-it.net *Reply-To: *Observium Public Support observium@observium.org *Date: *Thursday, March 23, 2017 at 1:37 PM *To: *"observium@observium.org" observium@observium.org *Subject: *[Observium] port errors
Hello,
My dashboard is showing port errors and I'm trying to understand where this information is coming from ?
[image: nline image 1]
Those are all different routers.
Here's show int of the 1st one.
Are the errors being read from the input error below ?
It's been on Rx: 6 for a very long time, even if I clear the counters.
xxxx-xxxx#show int g0/1/1
GigabitEthernet0/1/1 is up, line protocol is up
Hardware is SPA-2X1GE-V2, address is 0026.0ba5.0a11 (bia 0026.0ba5.0a11)
Description: Management
Internet address is 10.75.1.3/24[10.75.1.3] https://urldefense.proofpoint.com/v2/url?u=http-3A__10.75.1.3_24&d=BQMFaQ&c=sy2pFYeXOTBQJUPqadkFIXq5lzPIgQxhI8DCCAdSjYc&r=ABp-W7DPgLKCKlUN3YMk4NOW3xFdLejq7IJ9RyIqzoE&m=ahOULAnRbu99dv1okntzPGZa6D99YvQ8omakIR9OJwQ&s=rJIir7ibhj5JUb1V0fdT2aeHVDLSrcPt2eJBW9B44Jk&e=
MTU 1500 bytes, BW 1000000 Kbit/sec, DLY 10 usec,
reliability 255/255, txload 1/255, rxload 1/255Encapsulation ARPA, loopback not set
Keepalive not supported
Full Duplex, 1000Mbps, link type is force-up, media type is RJ45
output flow-control is on, input flow-control is on
ARP type: ARPA, ARP Timeout 04:00:00
Last input 00:00:01, output 00:00:01, output hang never
Last clearing of "show interface" counters 14:22:12
Input queue: 0/375/0/0 (size/max/drops/flushes); Total output drops: 0
Queueing strategy: fifo
Output queue: 0/40 (size/max)
5 minute input rate 798000 bits/sec, 84 packets/sec
5 minute output rate 56000 bits/sec, 61 packets/sec
 3721054 packets input, 4443301060 bytes, 0 no buffer

 Received 604 broadcasts (0 IP multicasts)

 0 runts, 1224 giants, 0 throttles

* 1224 input errors*, 0 CRC, 0 frame, 0 overrun, 0 ignored

 0 watchdog, 24679 multicast, 0 pause input

 1957690 packets output, 267851747 bytes, 0 underruns

 0 output errors, 0 collisions, 0 interface resets

 0 unknown protocol drops

 0 babbles, 0 late collision, 0 deferred

 0 lost carrier, 0 no carrier, 0 pause output

 0 output buffer failures, 0 output buffers swapped out
Thanks in advance!
Ross.
observium mailing list observium@observium.org http://postman.memetic.org/cgi-bin/mailman/listinfo/observium
It will clear once you fix the errors on the interface.
-- Jay
From: observium observium-bounces@observium.org on behalf of "Ross [Eve IT]" ross@eve-it.net Reply-To: Observium Public Support observium@observium.org Date: Thursday, March 23, 2017 at 5:48 PM To: Observium Public Support observium@observium.org Subject: Re: [Observium] port errors
Thanks Jay, should it clear if clear the counters ?
On Fri, Mar 24, 2017 at 10:56 AM, Jay Christopher <jchristopher@shutterfly.commailto:jchristopher@shutterfly.com> wrote: That’s exactly where it comes from.
-- Jay
From: observium <observium-bounces@observium.orgmailto:observium-bounces@observium.org> on behalf of "Ross [Eve IT]" <ross@eve-it.netmailto:ross@eve-it.net> Reply-To: Observium Public Support <observium@observium.orgmailto:observium@observium.org> Date: Thursday, March 23, 2017 at 1:37 PM To: "observium@observium.orgmailto:observium@observium.org" <observium@observium.orgmailto:observium@observium.org> Subject: [Observium] port errors
Hello,
My dashboard is showing port errors and I'm trying to understand where this information is coming from ?
[line image 1]
Those are all different routers.
Here's show int of the 1st one. Are the errors being read from the input error below ? It's been on Rx: 6 for a very long time, even if I clear the counters.
xxxx-xxxx#show int g0/1/1 GigabitEthernet0/1/1 is up, line protocol is up Hardware is SPA-2X1GE-V2, address is 0026.0ba5.0a11 (bia 0026.0ba5.0a11) Description: Management Internet address is 10.75.1.3/24[10.75.1.3]https://urldefense.proofpoint.com/v2/url?u=http-3A__10.75.1.3_24&d=BQMFaQ&c=sy2pFYeXOTBQJUPqadkFIXq5lzPIgQxhI8DCCAdSjYc&r=ABp-W7DPgLKCKlUN3YMk4NOW3xFdLejq7IJ9RyIqzoE&m=ahOULAnRbu99dv1okntzPGZa6D99YvQ8omakIR9OJwQ&s=rJIir7ibhj5JUb1V0fdT2aeHVDLSrcPt2eJBW9B44Jk&e= MTU 1500 bytes, BW 1000000 Kbit/sec, DLY 10 usec, reliability 255/255, txload 1/255, rxload 1/255 Encapsulation ARPA, loopback not set Keepalive not supported Full Duplex, 1000Mbps, link type is force-up, media type is RJ45 output flow-control is on, input flow-control is on ARP type: ARPA, ARP Timeout 04:00:00 Last input 00:00:01, output 00:00:01, output hang never Last clearing of "show interface" counters 14:22:12 Input queue: 0/375/0/0 (size/max/drops/flushes); Total output drops: 0 Queueing strategy: fifo Output queue: 0/40 (size/max) 5 minute input rate 798000 bits/sec, 84 packets/sec 5 minute output rate 56000 bits/sec, 61 packets/sec 3721054 packets input, 4443301060 bytes, 0 no buffer Received 604 broadcasts (0 IP multicasts) 0 runts, 1224 giants, 0 throttles 1224 input errors, 0 CRC, 0 frame, 0 overrun, 0 ignored 0 watchdog, 24679 multicast, 0 pause input 1957690 packets output, 267851747 bytes, 0 underruns 0 output errors, 0 collisions, 0 interface resets 0 unknown protocol drops 0 babbles, 0 late collision, 0 deferred 0 lost carrier, 0 no carrier, 0 pause output 0 output buffer failures, 0 output buffers swapped out
Thanks in advance!
Ross.
_______________________________________________ observium mailing list observium@observium.orgmailto:observium@observium.org http://postman.memetic.org/cgi-bin/mailman/listinfo/observium%5Bpostman.meme...]https://urldefense.proofpoint.com/v2/url?u=http-3A__postman.memetic.org_cgi-2Dbin_mailman_listinfo_observium&d=BQMFaQ&c=sy2pFYeXOTBQJUPqadkFIXq5lzPIgQxhI8DCCAdSjYc&r=ABp-W7DPgLKCKlUN3YMk4NOW3xFdLejq7IJ9RyIqzoE&m=XVq197jnP38nncyuRjPX8QhIAp3fTdNhrud9zsGw-mQ&s=zVVboOE9ZW6jd2Mjd8A2vhzkc9Ywc5k8RG2hXIE1SmM&e=
participants (2)
-
 Jay Christopher
 -
 Ross [Eve IT]