
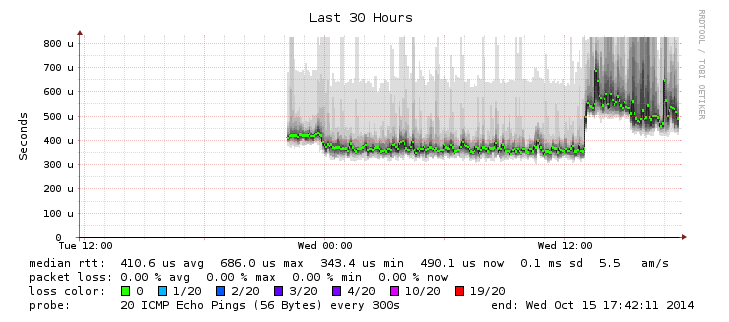
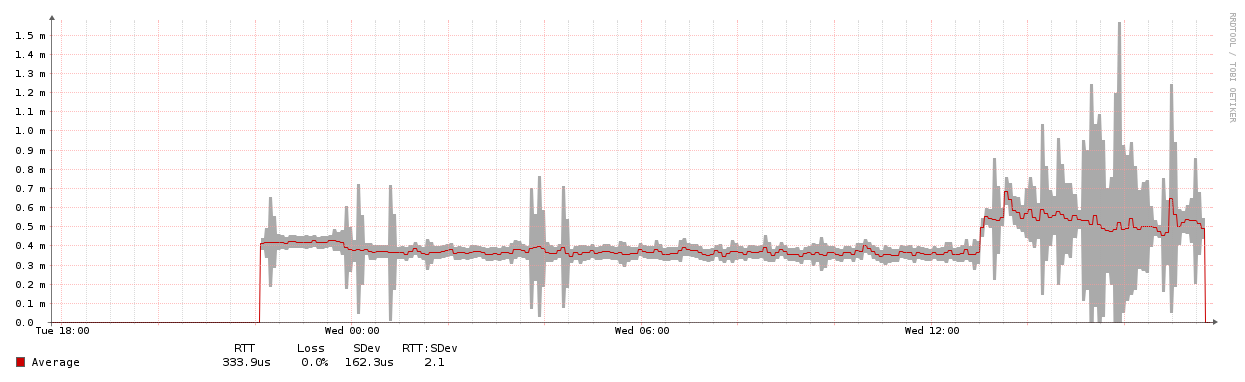
The integrated smokeping graphs don't have the same appearance as they do in smokeping itself. Is there a way to make the graphs have the same appearance?
Also, the data represented in Observium doesn't appear to match smokeping when looking at the variance. I've attached examples. I realize that it's the same rrd being drawn but it's just the representation of the data that is different.
Smokeping 2.6.8 and Observium 0.14.10.5883
Justin

Yes, Observium just reads Smokeping's rrd files. Once developers reported, that they won't provide more support for Smokeping rrds parsing. For me current level of integration with Smokeping is useless - it just mimics info of graphs, generated in Poller - Ping Response. четверг, 16 октября 2014г., 01:52 +0400 от Justin Miller observium@dynstatic.net: The integrated smokeping graphs don't have the same appearance as they do in smokeping itself. Is there a way to make the graphs have the same appearance? Also, the data represented in Observium doesn't appear to match smokeping when looking at the variance. I've attached examples. I realize that it's the same rrd being drawn but it's just the representation of the data that is different. Smokeping 2.6.8 and Observium 0.14.10.5883 Justin _______________________________________________ observium mailing list observium@observium.org http://postman.memetic.org/cgi-bin/mailman/listinfo/observium
participants (2)
-
 Justin Miller
 -
 Сережка Хомяков