
Hi there! When we are deleting a device we struggle with the time it takes, I have done a debug and this seems to be the problem:
SQL[DELETE FROM `devices_perftimes` WHERE `device_id` = '593'] ROWS[-1] SQL RUNTIME[97.04324698s] ERROR[Error in query: (The total number of locks exceeds the lock table size) 1206]
Can you help me with what I can do to fix this problem?
This also take some time: SQL[DELETE FROM `alert_log` WHERE `device_id` = '593'] ROWS[11480] SQL RUNTIME[15.23252392s]
Regards Fredrik
-----Ursprungligt meddelande----- Från: observium [mailto:observium-bounces@observium.org] För greg lambert Skickat: den 25 oktober 2016 09:41 Till: Observium Network Observation System observium@observium.org Ämne: [Observium] Acme Packet SBC 3820
Good Day,
I just loaded my SBC into observium - it doesn not graph the voice utilization. I was hoping to use it to graph voice channel useage etc.
Is there any suggested way to get this graphed?
Regards,
Greg
_______________________________________________ observium mailing list observium@observium.org http://postman.memetic.org/cgi-bin/mailman/listinfo/observium

I think it helps if you setup housekeeping first in this case, it will clean up your install, and will fix your issue.
Maarten
Sent from my iPhone
On 27 Oct 2016, at 15:19, Svensson Fredrik A fredrik.a.svensson@rjl.se wrote:
Hi there! When we are deleting a device we struggle with the time it takes, I have done a debug and this seems to be the problem:
SQL[DELETE FROM `devices_perftimes` WHERE `device_id` = '593'] ROWS[-1] SQL RUNTIME[97.04324698s] ERROR[Error in query: (The total number of locks exceeds the lock table size) 1206]
Can you help me with what I can do to fix this problem?
This also take some time: SQL[DELETE FROM `alert_log` WHERE `device_id` = '593'] ROWS[11480] SQL RUNTIME[15.23252392s]
Regards Fredrik
-----Ursprungligt meddelande----- Från: observium [mailto:observium-bounces@observium.org] För greg lambert Skickat: den 25 oktober 2016 09:41 Till: Observium Network Observation System observium@observium.org Ämne: [Observium] Acme Packet SBC 3820
Good Day,
I just loaded my SBC into observium - it doesn not graph the voice utilization. I was hoping to use it to graph voice channel useage etc.
Is there any suggested way to get this graphed?
Regards,
Greg
observium mailing list observium@observium.org http://postman.memetic.org/cgi-bin/mailman/listinfo/observium _______________________________________________ observium mailing list observium@observium.org http://postman.memetic.org/cgi-bin/mailman/listinfo/observium

We use a galera cluster and getting locks on these tables are impossible on large installations. Even with housekeeping, so our housekeeping is done with a scheduled task to drop or rename the table & create a new one each day. Same goes for syslog:
CREATE DEFINER=`root`@`%` EVENT `devices_perftimes_cleanup` ON SCHEDULE EVERY 1 DAY STARTS '2016-09-09 01:00:00' ON COMPLETION PRESERVE DISABLE ON SLAVE COMMENT '' DO TRUNCATE devices_perftimes
We used to monitor our citrix netscaler farms with citrix command center, their way of fixing this was by having a table for each day (or week, or month) for collecting data. Could this ever be implemented as well in the future ? Especially for syslog.
Kind regards
-----Original Message----- From: observium [mailto:observium-bounces@observium.org] On Behalf Of Moerman, Maarten Sent: donderdag 27 oktober 2016 15:48 To: Observium Network Observation System observium@observium.org Subject: Re: [Observium] Deleting device problems!
I think it helps if you setup housekeeping first in this case, it will clean up your install, and will fix your issue.
Maarten
Sent from my iPhone
On 27 Oct 2016, at 15:19, Svensson Fredrik A fredrik.a.svensson@rjl.se wrote:
Hi there! When we are deleting a device we struggle with the time it takes, I have done a debug and this seems to be the problem:
SQL[DELETE FROM `devices_perftimes` WHERE `device_id` = '593'] ROWS[-1] SQL RUNTIME[97.04324698s] ERROR[Error in query: (The total number of locks exceeds the lock table size) 1206]
Can you help me with what I can do to fix this problem?
This also take some time: SQL[DELETE FROM `alert_log` WHERE `device_id` = '593'] ROWS[11480] SQL RUNTIME[15.23252392s]
Regards Fredrik
-----Ursprungligt meddelande----- Från: observium [mailto:observium-bounces@observium.org] För greg lambert Skickat: den 25 oktober 2016 09:41 Till: Observium Network Observation System observium@observium.org Ämne: [Observium] Acme Packet SBC 3820
Good Day,
I just loaded my SBC into observium - it doesn not graph the voice utilization. I was hoping to use it to graph voice channel useage etc.
Is there any suggested way to get this graphed?
Regards,
Greg
observium mailing list observium@observium.org http://postman.memetic.org/cgi-bin/mailman/listinfo/observium _______________________________________________ observium mailing list observium@observium.org http://postman.memetic.org/cgi-bin/mailman/listinfo/observium
_______________________________________________ observium mailing list observium@observium.org http://postman.memetic.org/cgi-bin/mailman/listinfo/observium
We do not have a cluster. Housekeeping fixed the alert log delay, but not devices_perftimes. What part of housekeeping takes care of devices_perftimes ?
Regards Fredrik
-----Ursprungligt meddelande----- Från: observium [mailto:observium-bounces@observium.org] För Stef Renders Skickat: den 27 oktober 2016 15:57 Till: Observium Network Observation System observium@observium.org Ämne: Re: [Observium] Deleting device problems!
We use a galera cluster and getting locks on these tables are impossible on large installations. Even with housekeeping, so our housekeeping is done with a scheduled task to drop or rename the table & create a new one each day. Same goes for syslog:
CREATE DEFINER=`root`@`%` EVENT `devices_perftimes_cleanup` ON SCHEDULE EVERY 1 DAY STARTS '2016-09-09 01:00:00' ON COMPLETION PRESERVE DISABLE ON SLAVE COMMENT '' DO TRUNCATE devices_perftimes
We used to monitor our citrix netscaler farms with citrix command center, their way of fixing this was by having a table for each day (or week, or month) for collecting data. Could this ever be implemented as well in the future ? Especially for syslog.
Kind regards
-----Original Message----- From: observium [mailto:observium-bounces@observium.org] On Behalf Of Moerman, Maarten Sent: donderdag 27 oktober 2016 15:48 To: Observium Network Observation System observium@observium.org Subject: Re: [Observium] Deleting device problems!
I think it helps if you setup housekeeping first in this case, it will clean up your install, and will fix your issue.
Maarten
Sent from my iPhone
On 27 Oct 2016, at 15:19, Svensson Fredrik A fredrik.a.svensson@rjl.se wrote:
Hi there! When we are deleting a device we struggle with the time it takes, I have done a debug and this seems to be the problem:
SQL[DELETE FROM `devices_perftimes` WHERE `device_id` = '593'] ROWS[-1] SQL RUNTIME[97.04324698s] ERROR[Error in query: (The total number of locks exceeds the lock table size) 1206]
Can you help me with what I can do to fix this problem?
This also take some time: SQL[DELETE FROM `alert_log` WHERE `device_id` = '593'] ROWS[11480] SQL RUNTIME[15.23252392s]
Regards Fredrik
-----Ursprungligt meddelande----- Från: observium [mailto:observium-bounces@observium.org] För greg lambert Skickat: den 25 oktober 2016 09:41 Till: Observium Network Observation System observium@observium.org Ämne: [Observium] Acme Packet SBC 3820
Good Day,
I just loaded my SBC into observium - it doesn not graph the voice utilization. I was hoping to use it to graph voice channel useage etc.
Is there any suggested way to get this graphed?
Regards,
Greg
observium mailing list observium@observium.org http://postman.memetic.org/cgi-bin/mailman/listinfo/observium _______________________________________________ observium mailing list observium@observium.org http://postman.memetic.org/cgi-bin/mailman/listinfo/observium
_______________________________________________ observium mailing list observium@observium.org http://postman.memetic.org/cgi-bin/mailman/listinfo/observium
_______________________________________________ observium mailing list observium@observium.org http://postman.memetic.org/cgi-bin/mailman/listinfo/observium
Truncating devices_perftimes makes the problem go away, thanks for your input!
-----Ursprungligt meddelande----- Från: observium [mailto:observium-bounces@observium.org] För Svensson Fredrik A Skickat: den 28 oktober 2016 07:43 Till: Observium Network Observation System observium@observium.org Ämne: Re: [Observium] Deleting device problems!
We do not have a cluster. Housekeeping fixed the alert log delay, but not devices_perftimes. What part of housekeeping takes care of devices_perftimes ?
Regards Fredrik
-----Ursprungligt meddelande----- Från: observium [mailto:observium-bounces@observium.org] För Stef Renders Skickat: den 27 oktober 2016 15:57 Till: Observium Network Observation System observium@observium.org Ämne: Re: [Observium] Deleting device problems!
We use a galera cluster and getting locks on these tables are impossible on large installations. Even with housekeeping, so our housekeeping is done with a scheduled task to drop or rename the table & create a new one each day. Same goes for syslog:
CREATE DEFINER=`root`@`%` EVENT `devices_perftimes_cleanup` ON SCHEDULE EVERY 1 DAY STARTS '2016-09-09 01:00:00' ON COMPLETION PRESERVE DISABLE ON SLAVE COMMENT '' DO TRUNCATE devices_perftimes
We used to monitor our citrix netscaler farms with citrix command center, their way of fixing this was by having a table for each day (or week, or month) for collecting data. Could this ever be implemented as well in the future ? Especially for syslog.
Kind regards
-----Original Message----- From: observium [mailto:observium-bounces@observium.org] On Behalf Of Moerman, Maarten Sent: donderdag 27 oktober 2016 15:48 To: Observium Network Observation System observium@observium.org Subject: Re: [Observium] Deleting device problems!
I think it helps if you setup housekeeping first in this case, it will clean up your install, and will fix your issue.
Maarten
Sent from my iPhone
On 27 Oct 2016, at 15:19, Svensson Fredrik A fredrik.a.svensson@rjl.se wrote:
Hi there! When we are deleting a device we struggle with the time it takes, I have done a debug and this seems to be the problem:
SQL[DELETE FROM `devices_perftimes` WHERE `device_id` = '593'] ROWS[-1] SQL RUNTIME[97.04324698s] ERROR[Error in query: (The total number of locks exceeds the lock table size) 1206]
Can you help me with what I can do to fix this problem?
This also take some time: SQL[DELETE FROM `alert_log` WHERE `device_id` = '593'] ROWS[11480] SQL RUNTIME[15.23252392s]
Regards Fredrik
-----Ursprungligt meddelande----- Från: observium [mailto:observium-bounces@observium.org] För greg lambert Skickat: den 25 oktober 2016 09:41 Till: Observium Network Observation System observium@observium.org Ämne: [Observium] Acme Packet SBC 3820
Good Day,
I just loaded my SBC into observium - it doesn not graph the voice utilization. I was hoping to use it to graph voice channel useage etc.
Is there any suggested way to get this graphed?
Regards,
Greg
observium mailing list observium@observium.org http://postman.memetic.org/cgi-bin/mailman/listinfo/observium _______________________________________________ observium mailing list observium@observium.org http://postman.memetic.org/cgi-bin/mailman/listinfo/observium
_______________________________________________ observium mailing list observium@observium.org http://postman.memetic.org/cgi-bin/mailman/listinfo/observium
_______________________________________________ observium mailing list observium@observium.org http://postman.memetic.org/cgi-bin/mailman/listinfo/observium _______________________________________________ observium mailing list observium@observium.org http://postman.memetic.org/cgi-bin/mailman/listinfo/observium

Hi
Since I’ve updated to 8202 - no graphs are drawing. Not sure where to check?
Regards,
Shaun

Open one of the graph URLs in a separate window and add &debug=1 to the end of the URL.
Also, please don't hijack existing list threads
Adam.
Sent from BlueMail
On 7 Nov 2016, 12:45, at 12:45, Shaun Courtney shaun@cybersmart.co.za wrote:
Hi
Since I’ve updated to 8202 - no graphs are drawing. Not sure where to check?
Regards,
Shaun
observium mailing list observium@observium.org http://postman.memetic.org/cgi-bin/mailman/listinfo/observium
Hi
On 07 Nov 2016, at 3:15 PM, Adam Armstrong <adama@memetic.org mailto:adama@memetic.org> wrote:
Open one of the graph URLs in a separate window and add &debug=1 to the end of the URL.
Picked one at random - a whole lot of SQL … and the only “red” errors:
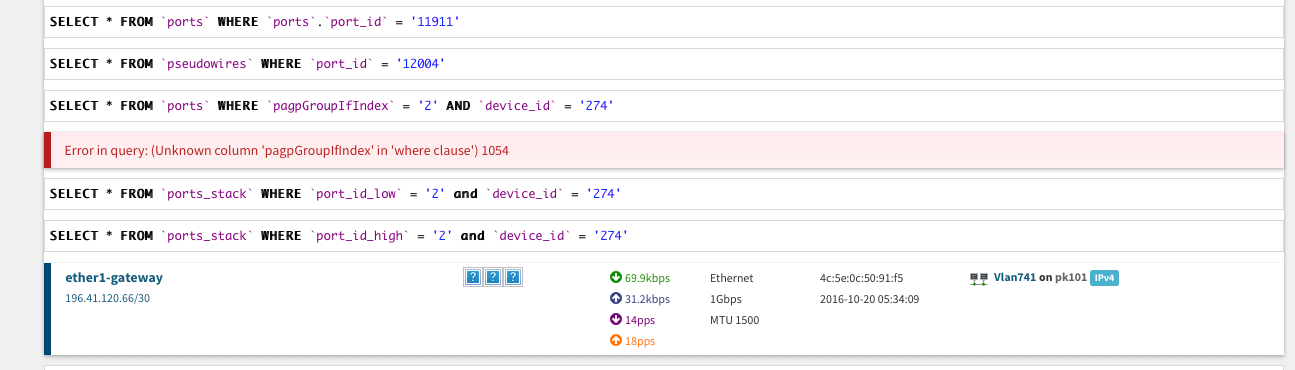
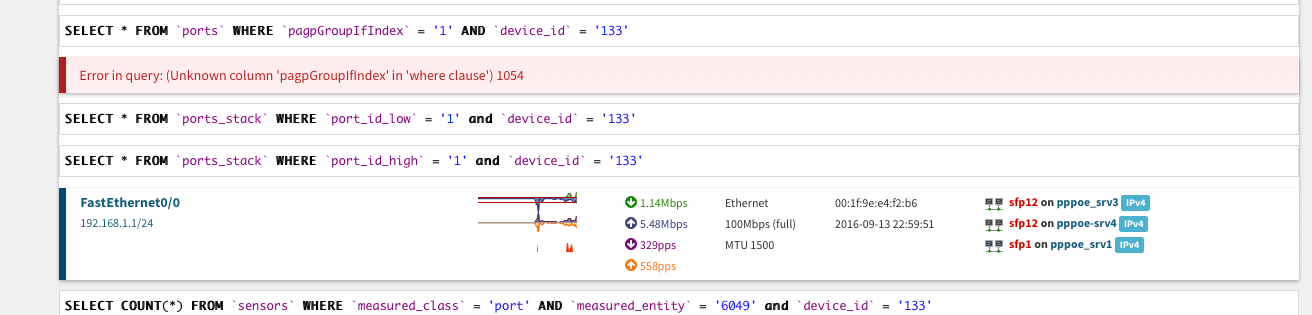
SELECT COUNT(*) FROM `ports` WHERE `pagpGroupIfIndex` = '2' and `device_id` = '274' Error in query: (Unknown column 'pagpGroupIfIndex' in 'where clause') 1054
Not sure if that helps.
This has been dropped from the table ports - update 297.sql
update/297.sql:ALTER TABLE `ports` DROP `pagpOperationMode` ,DROP `pagpPortState` ,DROP `pagpPartnerDeviceId` ,DROP `pagpPartnerLearnMethod` ,DROP `pagpPartnerIfIndex` ,DROP `pagpPartnerGroupIfIndex` ,DROP `pagpPartnerDeviceName` ,DROP `pagpEthcOperationMode` ,DROP `pagpDeviceId` ,DROP `pagpGroupIfIndex` ;
Not sure where else to check?
Observium 0.16.11.8202 (rolling) http://www.observium.org/
Also have this at the bottom of the page.
But I don’t think this error is the cause, as on another instance I have the same error - but the graphing works Observium 0.16.10.8181 (stable) http://www.observium.org/
Also, please don't hijack existing list threads
Sorry ;(
-sc
Adam.
Sent from BlueMail http://www.bluemail.me/r
On 7 Nov 2016, at 12:45, Shaun Courtney <shaun@cybersmart.co.za mailto:shaun@cybersmart.co.za> wrote: Hi
Since I’ve updated to 8202 - no graphs are drawing. Not sure where to check?
Regards,
Shaun
observium mailing list observium@observium.org mailto:observium@observium.org http://postman.memetic.org/cgi-bin/mailman/listinfo/observium http://postman.memetic.org/cgi-bin/mailman/listinfo/observium _______________________________________________ observium mailing list observium@observium.org mailto:observium@observium.org http://postman.memetic.org/cgi-bin/mailman/listinfo/observium http://postman.memetic.org/cgi-bin/mailman/listinfo/observium
On the end of the graph URL, not on the end of the page URL.
adam.
Sent from Mailbird [http://www.getmailbird.com/?utm_source=Mailbird&utm_medium=email&utm...] On 07/11/2016 14:14:44, Shaun Courtney shaun@cybersmart.co.za wrote: Hi
On 07 Nov 2016, at 3:15 PM, Adam Armstrong <adama@memetic.org [mailto:adama@memetic.org]> wrote:
Open one of the graph URLs in a separate window and add &debug=1 to the end of the URL.
Picked one at random - a whole lot of SQL … and the only “red” errors:
SELECT COUNT(*) FROM `ports` WHERE `pagpGroupIfIndex` = '2' and `device_id` = '274' Error in query: (Unknown column 'pagpGroupIfIndex' in 'where clause') 1054
Not sure if that helps.
This has been dropped from the table ports - update 297.sql
update/297.sql:ALTER TABLE `ports` DROP `pagpOperationMode` ,DROP `pagpPortState` ,DROP `pagpPartnerDeviceId` ,DROP `pagpPartnerLearnMethod` ,DROP `pagpPartnerIfIndex` ,DROP `pagpPartnerGroupIfIndex` ,DROP `pagpPartnerDeviceName` ,DROP `pagpEthcOperationMode` ,DROP `pagpDeviceId` ,DROP `pagpGroupIfIndex` ;
Not sure where else to check?
Observium 0.16.11.8202 (rolling) [http://www.observium.org/]
Also have this at the bottom of the page.
But I don’t think this error is the cause, as on another instance I have the same error - but the graphing works Observium 0.16.10.8181 (stable) [http://www.observium.org/]
Also, please don't hijack existing list threads
Sorry ;(
-sc
Adam.
Sent from BlueMail [http://www.bluemail.me/r]
On 7 Nov 2016, at 12:45, Shaun Courtney <shaun@cybersmart.co.za [mailto:shaun@cybersmart.co.za]> wrote: Hi
Since I’ve updated to 8202 - no graphs are drawing. Not sure where to check?
Regards,
Shaun
observium mailing list observium@observium.org [mailto:observium@observium.org] http://postman.memetic.org/cgi-bin/mailman/listinfo/observium [http://postman.memetic.org/cgi-bin/mailman/listinfo/observium]
_______________________________________________ observium mailing list observium@observium.org [mailto:observium@observium.org] http://postman.memetic.org/cgi-bin/mailman/listinfo/observium [http://postman.memetic.org/cgi-bin/mailman/listinfo/observium]
Hi.
On 07 Nov 2016, at 4:16 PM, Adam Armstrong <adama@memetic.org mailto:adama@memetic.org> wrote:
On the end of the graph URL, not on the end of the page URL.
So this is what I did - hopefully correct …
Observium -> Devices -> All Devices -> Pick one at random -> Ports -> ether1 -> Under traffic select the first [?] . Pick 6 hours and “Open image in new tab” and add &debug=1
http://observium.lightspeed.co.za/graph.php?type=port_bits&to=1478544692... http://observium.lightspeed.co.za/graph.php?type=port_bits&to=1478544692&id=11582&from=1478523092&height=60&width=113&legend=no&debug=1
SELECT * FROM `entity_permissions` WHERE `user_id` = ‘1' SELECT `alert_table_id`, `device_id`, `entity_id`, `entity_type` FROM `alert_table` SELECT `value` FROM `users_prefs` WHERE `user_id` = '1' AND `pref` = 'atom_key'
$graphtype/usr/local/www/observium/html/includes/graphs/graph.inc.php:33
array(5 0 => port_bits type => port 1 => port subtype => bits 2 => bits )
SELECT `device_id` FROM `ports` WHERE `port_id` = '11582' SELECT * FROM `ports` WHERE `ports`.`port_id` = '11582' SELECT * FROM `devices` WHERE `device_id` = '246' SELECT * FROM `device_graphs` WHERE `device_id` = '246'
× RRD CMD[%ygraph /tmp/1UawDb1OdZwZKoMg.png -g -Y --alt-autoscale --rigid --start 1478523092 --end 1478544692 --width 113 --height 60 -c BACK#EEEEEE00 -c SHADEA#EEEEEE00 -c SHADEB#EEEEEE00 -c FONT#000000 -c CANVAS#FFFFFF00 -c GRID#a5a5a5 -c MGRID#FF9999 -c FRAME#5e5e5e -c ARROW#5e5e5e -R normal --only-graph --font LEGEND:7:'DroidSansMono,DejaVuSansMono' --font AXIS:6:'DroidSansMono,DejaVuSansMono' --font-render-mode normal -E COMMENT:'Bits/s Last Avg Max 95th \n' DEF:outoctets=/usr/local/www/observium/rrd/comitis.lightspeed.co.za/port-2.rrd:OUTOCTETS:AVERAGE DEF:inoctets=/usr/local/www/observium/rrd/comitis.lightspeed.co.za/port-2.rrd:INOCTETS:AVERAGE DEF:outoctets_max=/usr/local/www/observium/rrd/comitis.lightspeed.co.za/port-2.rrd:OUTOCTETS:MAX DEF:inoctets_max=/usr/local/www/observium/rrd/comitis.lightspeed.co.za/port-2.rrd:INOCTETS:MAX CDEF:alloctets=outoctets,inoctets,+ CDEF:wrongin=alloctets,UN,INF,UNKN,IF CDEF:wrongout=wrongin,-1,* CDEF:octets=inoctets,outoctets,+ CDEF:doutoctets=outoctets,-1,* CDEF:outbits=outoctets,8,* CDEF:outbits_max=outoctets_max,8,* CDEF:doutoctets_max=outoctets_max,-1,* CDEF:doutbits=doutoctets,8,* CDEF:doutbits_max=doutoctets_max,8,* CDEF:inbits=inoctets,8,* CDEF:inbits_max=inoctets_max,8,* VDEF:totin=inoctets,TOTAL VDEF:totout=outoctets,TOTAL VDEF:tot=octets,TOTAL VDEF:95thin=inbits,95,PERCENT VDEF:95thout=outbits,95,PERCENT CDEF:pout_tmp=doutbits,-1,* VDEF:dpout_tmp=pout_tmp,95,PERCENT CDEF:dpout_tmp2=doutbits,doutbits,-,dpout_tmp,-1,*,+ VDEF:d95thout=dpout_tmp2,FIRST AREA:inbits#92B73F LINE1.25:inbits#4A8328:'In ' GPRINT:inbits:LAST:%6.2lf%s GPRINT:inbits:AVERAGE:%6.2lf%s GPRINT:inbits_max:MAX:%6.2lf%s GPRINT:95thin:%6.2lf%s\n AREA:doutbits#7075B8 LINE1.25:doutbits#323B7C:'Out' GPRINT:outbits:LAST:%6.2lf%s GPRINT:outbits:AVERAGE:%6.2lf%s GPRINT:outbits_max:MAX:%6.2lf%s GPRINT:95thout:%6.2lf%s\n LINE1:95thin#aa0000 LINE1:d95thout#bb0000 GPRINT:tot:'Total %6.2lf%s' GPRINT:totin:'(In %6.2lf%s' GPRINT:totout:'Out %6.2lf%s)\l' AREA:wrongin#FFF2F2 AREA:wrongout#FFF2F2%n] × RRD RUNTIME[0.0379s] RRD STDOUT[113x60] RRD_STATUS[TRUE] × CMD[/bin/ls -l /tmp/1UawDb1OdZwZKoMg.png] × CMD EXITCODE[0] CMD RUNTIME[0.0095s] × STDOUT[ -rw-r--r-- 1 www wheel 3358 Nov 7 20:51 /tmp/1UawDb1OdZwZKoMg.png ]
× Runtime 0.083518981933594 secs
adam.
Sent from Mailbird http://www.getmailbird.com/?utm_source=Mailbird&utm_medium=email&utm_campaign=sent-from-mailbirdOn 07/11/2016 14:14:44, Shaun Courtney <shaun@cybersmart.co.za mailto:shaun@cybersmart.co.za> wrote:
Hi
On 07 Nov 2016, at 3:15 PM, Adam Armstrong <adama@memetic.org mailto:adama@memetic.org> wrote:
Open one of the graph URLs in a separate window and add &debug=1 to the end of the URL.
Picked one at random - a whole lot of SQL … and the only “red” errors:
SELECT COUNT(*) FROM `ports` WHERE `pagpGroupIfIndex` = '2' and `device_id` = '274' Error in query: (Unknown column 'pagpGroupIfIndex' in 'where clause') 1054
Not sure if that helps.
This has been dropped from the table ports - update 297.sql
update/297.sql:ALTER TABLE `ports` DROP `pagpOperationMode` ,DROP `pagpPortState` ,DROP `pagpPartnerDeviceId` ,DROP `pagpPartnerLearnMethod` ,DROP `pagpPartnerIfIndex` ,DROP `pagpPartnerGroupIfIndex` ,DROP `pagpPartnerDeviceName` ,DROP `pagpEthcOperationMode` ,DROP `pagpDeviceId` ,DROP `pagpGroupIfIndex` ;
Not sure where else to check?
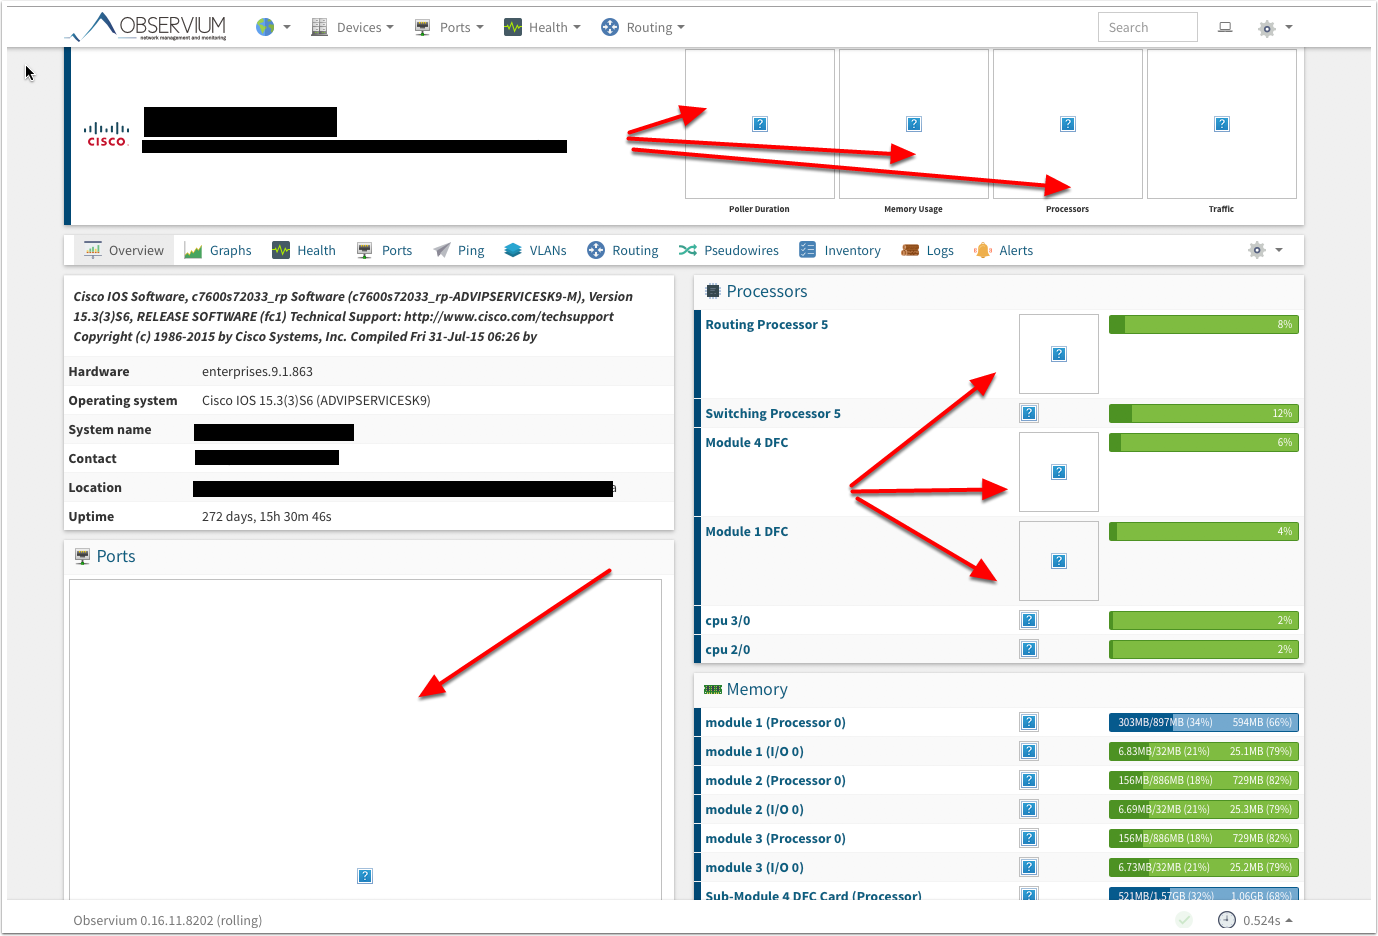
Observium 0.16.11.8202 (rolling) http://www.observium.org/ <PastedGraphic-4.png>
Also have this at the bottom of the page.
<PastedGraphic-6.png>
But I don’t think this error is the cause, as on another instance I have the same error - but the graphing works Observium 0.16.10.8181 (stable) http://www.observium.org/
<PastedGraphic-5.png>
Also, please don't hijack existing list threads
Sorry ;(
-sc
Adam.
Sent from BlueMail http://www.bluemail.me/r
On 7 Nov 2016, at 12:45, Shaun Courtney <shaun@cybersmart.co.za mailto:shaun@cybersmart.co.za> wrote: Hi
Since I’ve updated to 8202 - no graphs are drawing. Not sure where to check?
Regards,
Shaun
<PastedGraphic-3.png>
observium mailing list observium@observium.org mailto:observium@observium.org http://postman.memetic.org/cgi-bin/mailman/listinfo/observium http://postman.memetic.org/cgi-bin/mailman/listinfo/observium _______________________________________________ observium mailing list observium@observium.org mailto:observium@observium.org http://postman.memetic.org/cgi-bin/mailman/listinfo/observium http://postman.memetic.org/cgi-bin/mailman/listinfo/observium
observium mailing list observium@observium.org mailto:observium@observium.org http://postman.memetic.org/cgi-bin/mailman/listinfo/observium
It seems that the graphs are drawing correctly, but something is happening before they get displayed.
Did you put some erroneous characters in your config.php?
Does it have a ?> at the end with extra lines after it?
Adam.
Sent from BlueMail
On 7 Nov 2016, 19:03, at 19:03, Shaun Courtney shaun@cybersmart.co.za wrote:
Hi.
On 07 Nov 2016, at 4:16 PM, Adam Armstrong <adama@memetic.org
mailto:adama@memetic.org> wrote:
On the end of the graph URL, not on the end of the page URL.
So this is what I did - hopefully correct …
Observium -> Devices -> All Devices -> Pick one at random -> Ports -> ether1 -> Under traffic select the first [?] . Pick 6 hours and “Open image in new tab” and add &debug=1
http://observium.lightspeed.co.za/graph.php?type=port_bits&to=1478544692... http://observium.lightspeed.co.za/graph.php?type=port_bits&to=1478544692&id=11582&from=1478523092&height=60&width=113&legend=no&debug=1
SELECT * FROM `entity_permissions` WHERE `user_id` = ‘1' SELECT `alert_table_id`, `device_id`, `entity_id`, `entity_type` FROM `alert_table` SELECT `value` FROM `users_prefs` WHERE `user_id` = '1' AND `pref` = 'atom_key'
$graphtype/usr/local/www/observium/html/includes/graphs/graph.inc.php:33 array(5 0 => port_bits type => port 1 => port subtype => bits 2 => bits )
SELECT `device_id` FROM `ports` WHERE `port_id` = '11582' SELECT * FROM `ports` WHERE `ports`.`port_id` = '11582' SELECT * FROM `devices` WHERE `device_id` = '246' SELECT * FROM `device_graphs` WHERE `device_id` = '246'
× RRD CMD[%ygraph /tmp/1UawDb1OdZwZKoMg.png -g -Y --alt-autoscale --rigid --start 1478523092 --end 1478544692 --width 113 --height 60 -c BACK#EEEEEE00 -c SHADEA#EEEEEE00 -c SHADEB#EEEEEE00 -c FONT#000000 -c CANVAS#FFFFFF00 -c GRID#a5a5a5 -c MGRID#FF9999 -c FRAME#5e5e5e -c ARROW#5e5e5e -R normal --only-graph --font LEGEND:7:'DroidSansMono,DejaVuSansMono' --font AXIS:6:'DroidSansMono,DejaVuSansMono' --font-render-mode normal -E COMMENT:'Bits/s Last Avg Max 95th \n' DEF:outoctets=/usr/local/www/observium/rrd/comitis.lightspeed.co.za/port-2.rrd:OUTOCTETS:AVERAGE DEF:inoctets=/usr/local/www/observium/rrd/comitis.lightspeed.co.za/port-2.rrd:INOCTETS:AVERAGE DEF:outoctets_max=/usr/local/www/observium/rrd/comitis.lightspeed.co.za/port-2.rrd:OUTOCTETS:MAX DEF:inoctets_max=/usr/local/www/observium/rrd/comitis.lightspeed.co.za/port-2.rrd:INOCTETS:MAX CDEF:alloctets=outoctets,inoctets,+ CDEF:wrongin=alloctets,UN,INF,UNKN,IF CDEF:wrongout=wrongin,-1,* CDEF:octets=inoctets,outoctets,+ CDEF:doutoctets=outoctets,-1,* CDEF:outbits=outoctets,8,* CDEF:outbits_max=outoctets_max,8,* CDEF:doutoctets_max=outoctets_max,-1,* CDEF:doutbits=doutoctets,8,* CDEF:doutbits_max=doutoctets_max,8,* CDEF:inbits=inoctets,8,* CDEF:inbits_max=inoctets_max,8,* VDEF:totin=inoctets,TOTAL VDEF:totout=outoctets,TOTAL VDEF:tot=octets,TOTAL VDEF:95thin=inbits,95,PERCENT VDEF:95thout=outbits,95,PERCENT CDEF:pout_tmp=doutbits,-1,* VDEF:dpout_tmp=pout_tmp,95,PERCENT CDEF:dpout_tmp2=doutbits,doutbits,-,dpout_tmp,-1,*,+ VDEF:d95thout=dpout_tmp2,FIRST AREA:inbits#92B73F LINE1.25:inbits#4A8328:'In ' GPRINT:inbits:LAST:%6.2lf%s GPRINT:inbits:AVERAGE:%6.2lf%s GPRINT:inbits_max:MAX:%6.2lf%s GPRINT:95thin:%6.2lf%s\n AREA:doutbits#7075B8 LINE1.25:doutbits#323B7C:'Out' GPRINT:outbits:LAST:%6.2lf%s GPRINT:outbits:AVERAGE:%6.2lf%s GPRINT:outbits_max:MAX:%6.2lf%s GPRINT:95thout:%6.2lf%s\n LINE1:95thin#aa0000 LINE1:d95thout#bb0000 GPRINT:tot:'Total %6.2lf%s' GPRINT:totin:'(In %6.2lf%s' GPRINT:totout:'Out %6.2lf%s)\l' AREA:wrongin#FFF2F2 AREA:wrongout#FFF2F2%n] × RRD RUNTIME[0.0379s] RRD STDOUT[113x60] RRD_STATUS[TRUE] × CMD[/bin/ls -l /tmp/1UawDb1OdZwZKoMg.png] × CMD EXITCODE[0] CMD RUNTIME[0.0095s] × STDOUT[ -rw-r--r-- 1 www wheel 3358 Nov 7 20:51 /tmp/1UawDb1OdZwZKoMg.png ]
× Runtime 0.083518981933594 secs
adam.
Sent from Mailbird
http://www.getmailbird.com/?utm_source=Mailbird&utm_medium=email&utm_campaign=sent-from-mailbirdOn 07/11/2016 14:14:44, Shaun Courtney <shaun@cybersmart.co.za mailto:shaun@cybersmart.co.za> wrote:
Hi
On 07 Nov 2016, at 3:15 PM, Adam Armstrong <adama@memetic.org
mailto:adama@memetic.org> wrote:
Open one of the graph URLs in a separate window and add &debug=1 to
the end of the URL.
Picked one at random - a whole lot of SQL … and the only “red”
errors:
SELECT COUNT(*) FROM `ports` WHERE `pagpGroupIfIndex` = '2' and
`device_id` = '274'
Error in query: (Unknown column 'pagpGroupIfIndex' in 'where
clause') 1054
Not sure if that helps.
This has been dropped from the table ports - update 297.sql
update/297.sql:ALTER TABLE `ports` DROP `pagpOperationMode` ,DROP
`pagpPortState` ,DROP `pagpPartnerDeviceId` ,DROP `pagpPartnerLearnMethod` ,DROP `pagpPartnerIfIndex` ,DROP `pagpPartnerGroupIfIndex` ,DROP `pagpPartnerDeviceName` ,DROP `pagpEthcOperationMode` ,DROP `pagpDeviceId` ,DROP `pagpGroupIfIndex` ;
Not sure where else to check?
Observium 0.16.11.8202 (rolling) http://www.observium.org/ <PastedGraphic-4.png>
Also have this at the bottom of the page.
<PastedGraphic-6.png>
But I don’t think this error is the cause, as on another instance I
have the same error - but the graphing works Observium 0.16.10.8181 (stable) http://www.observium.org/
<PastedGraphic-5.png>
Also, please don't hijack existing list threads
Sorry ;(
-sc
Adam.
Sent from BlueMail http://www.bluemail.me/r
On 7 Nov 2016, at 12:45, Shaun Courtney <shaun@cybersmart.co.za
mailto:shaun@cybersmart.co.za> wrote:
Hi
Since I’ve updated to 8202 - no graphs are drawing. Not sure where
to check?
Regards,
Shaun
<PastedGraphic-3.png>
observium mailing list observium@observium.org mailto:observium@observium.org http://postman.memetic.org/cgi-bin/mailman/listinfo/observium
http://postman.memetic.org/cgi-bin/mailman/listinfo/observium
observium mailing list observium@observium.org mailto:observium@observium.org http://postman.memetic.org/cgi-bin/mailman/listinfo/observium
http://postman.memetic.org/cgi-bin/mailman/listinfo/observium
observium mailing list observium@observium.org mailto:observium@observium.org http://postman.memetic.org/cgi-bin/mailman/listinfo/observium
observium mailing list observium@observium.org http://postman.memetic.org/cgi-bin/mailman/listinfo/observium
Hi
On 07 Nov 2016, at 9:40 PM, Adam Armstrong <adama@memetic.org mailto:adama@memetic.org> wrote:
It seems that the graphs are drawing correctly, but something is happening before they get displayed.
Did you put some erroneous characters in your config.php?
Does it have a ?> at the end with extra lines after it?
On the money … someone™ added a blank line after ?> ...
Sorted - thanks for the help.
Regards,
Shaun
Adam.
Sent from BlueMail http://www.bluemail.me/r
On 7 Nov 2016, at 19:03, Shaun Courtney <shaun@cybersmart.co.za mailto:shaun@cybersmart.co.za> wrote: Hi.
On 07 Nov 2016, at 4:16 PM, Adam Armstrong <adama@memetic.org mailto:adama@memetic.org> wrote:
On the end of the graph URL, not on the end of the page URL.
So this is what I did - hopefully correct …
Observium -> Devices -> All Devices -> Pick one at random -> Ports -> ether1 -> Under traffic select the first [?] . Pick 6 hours and “Open image in new tab” and add &debug=1
http://observium.lightspeed.co.za/graph.php?type=port_bits&to=1478544692... http://observium.lightspeed.co.za/graph.php?type=port_bits&to=1478544692&id=11582&from=1478523092&height=60&width=113&legend=no&debug=1
SELECT * FROM `entity_permissions` WHERE `user_id` = ‘1' SELECT `alert_table_id`, `device_id`, `entity_id`, `entity_type` FROM `alert_table` SELECT `value` FROM `users_prefs` WHERE `user_id` = '1' AND `pref` = 'atom_key'
$graphtype/usr/local/www/observium/html/includes/graphs/graph.inc.php:33
array(5 0 => port_bits type => port 1 => port subtype => bits 2 => bits )
SELECT `device_id` FROM `ports` WHERE `port_id` = '11582' SELECT * FROM `ports` WHERE `ports`.`port_id` = '11582' SELECT * FROM `devices` WHERE `device_id` = '246' SELECT * FROM `device_graphs` WHERE `device_id` = '246'
× RRD CMD[%ygraph /tmp/1UawDb1OdZwZKoMg.png -g -Y --alt-autoscale --rigid --start 1478523092 --end 1478544692 --width 113 --height 60 -c BACK#EEEEEE00 -c SHADEA#EEEEEE00 -c SHADEB#EEEEEE00 -c FONT#000000 -c CANVAS#FFFFFF00 -c GRID#a5a5a5 -c MGRID#FF9999 -c FRAME#5e5e5e -c ARROW#5e5e5e -R normal --only-graph --font LEGEND:7:'DroidSansMono,DejaVuSansMono' --font AXIS:6:'DroidSansMono,DejaVuSansMono' --font-render-mode normal -E COMMENT:'Bits/s Last Avg Max 95th \n' DEF:outoctets=/usr/local/www/observium/rrd/comitis.lightspeed.co.za/port-2.rrd:OUTOCTETS:AVERAGE DEF:inoctets=/usr/local/www/observium/rrd/comitis.lightspeed.co.za/port-2.rrd:INOCTETS:AVERAGE DEF:outoctets_max=/usr/local/www/observium/rrd/comitis.lightspeed.co.za/port-2.rrd:OUTOCTETS:MAX DEF:inoctets_max=/usr/local/www/observium/rrd/comitis.lightspeed.co.za/port-2.rrd:INOCTETS:MAX CDEF:alloctets=outoctets,inoctets,+ CDEF:wrongin=alloctets,UN,INF,UNKN,IF CDEF:wrongout=wrongin,-1,* CDEF:octets=inoctets,outoctets,+ CDEF:doutoctets=outoctets,-1,* CDEF:outbits=outoctets,8,* CDEF:outbits_max=outoctets_max,8,* CDEF:doutoctets_max=outoctets_max,-1,* CDEF:doutbits=doutoctets,8,* CDEF:doutbits_max=doutoctets_max,8,* CDEF:inbits=inoctets,8,* CDEF:inbits_max=inoctets_max,8,* VDEF:totin=inoctets,TOTAL VDEF:totout=outoctets,TOTAL VDEF:tot=octets,TOTAL VDEF:95thin=inbits,95,PERCENT VDEF:95thout=outbits,95,PERCENT CDEF:pout_tmp=doutbits,-1,* VDEF:dpout_tmp=pout_tmp,95,PERCENT CDEF:dpout_tmp2=doutbits,doutbits,-,dpout_tmp,-1,*,+ VDEF:d95thout=dpout_tmp2,FIRST AREA:inbits#92B73F LINE1.25:inbits#4A8328:'In ' GPRINT:inbits:LAST:%6.2lf%s GPRINT:inbits:AVERAGE:%6.2lf%s GPRINT:inbits_max:MAX:%6.2lf%s GPRINT:95thin:%6.2lf%s\n AREA:doutbits#7075B8 LINE1.25:doutbits#323B7C:'Out' GPRINT:outbits:LAST:%6.2lf%s GPRINT:outbits:AVERAGE:%6.2lf%s GPRINT:outbits_max:MAX:%6.2lf%s GPRINT:95thout:%6.2lf%s\n LINE1:95thin#aa0000 LINE1:d95thout#bb0000 GPRINT:tot:'Total %6.2lf%s' GPRINT:totin:'(In %6.2lf%s' GPRINT:totout:'Out %6.2lf%s)\l' AREA:wrongin#FFF2F2 AREA:wrongout#FFF2F2%n] × RRD RUNTIME[0.0379s] RRD STDOUT[113x60] RRD_STATUS[TRUE] × CMD[/bin/ls -l /tmp/1UawDb1OdZwZKoMg.png] × CMD EXITCODE[0] CMD RUNTIME[0.0095s] × STDOUT[ -rw-r--r-- 1 www wheel 3358 Nov 7 20:51 /tmp/1UawDb1OdZwZKoMg.png ] <attachment.png> × Runtime 0.083518981933594 secs
adam.
Sent from Mailbird http://www.getmailbird.com/?utm_source=Mailbird&utm_medium=email&utm_campaign=sent-from-mailbirdOn 07/11/2016 14:14:44, Shaun Courtney <shaun@cybersmart.co.za mailto:shaun@cybersmart.co.za> wrote:
Hi
On 07 Nov 2016, at 3:15 PM, Adam Armstrong <adama@memetic.org mailto:adama@memetic.org> wrote:
Open one of the graph URLs in a separate window and add &debug=1 to the end of the URL.
Picked one at random - a whole lot of SQL … and the only “red” errors:
SELECT COUNT(*) FROM `ports` WHERE `pagpGroupIfIndex` = '2' and `device_id` = '274' Error in query: (Unknown column 'pagpGroupIfIndex' in 'where clause') 1054
Not sure if that helps.
This has been dropped from the table ports - update 297.sql
update/297.sql:ALTER TABLE `ports` DROP `pagpOperationMode` ,DROP `pagpPortState` ,DROP `pagpPartnerDeviceId` ,DROP `pagpPartnerLearnMethod` ,DROP `pagpPartnerIfIndex` ,DROP `pagpPartnerGroupIfIndex` ,DROP `pagpPartnerDeviceName` ,DROP `pagpEthcOperationMode` ,DROP `pagpDeviceId` ,DROP `pagpGroupIfIndex` ;
Not sure where else to check?
Observium 0.16.11.8202 (rolling) http://www.observium.org/ <PastedGraphic-4.png>
Also have this at the bottom of the page.
<PastedGraphic-6.png>
But I don’t think this error is the cause, as on another instance I have the same error - but the graphing works Observium 0.16.10.8181 (stable) http://www.observium.org/
<PastedGraphic-5.png>
Also, please don't hijack existing list threads
Sorry ;(
-sc
Adam.
Sent from BlueMail http://www.bluemail.me/r
On 7 Nov 2016, at 12:45, Shaun Courtney <shaun@cybersmart.co.za mailto:shaun@cybersmart.co.za> wrote: Hi
Since I’ve updated to 8202 - no graphs are drawing. Not sure where to check?
Regards,
Shaun
<PastedGraphic-3.png>
observium mailing list observium@observium.org mailto:observium@observium.org http://postman.memetic.org/cgi-bin/mailman/listinfo/observium http://postman.memetic.org/cgi-bin/mailman/listinfo/observium _______________________________________________ observium mailing list observium@observium.org mailto:observium@observium.org http://postman.memetic.org/cgi-bin/mailman/listinfo/observium http://postman.memetic.org/cgi-bin/mailman/listinfo/observium
observium mailing list observium@observium.org mailto:observium@observium.org http://postman.memetic.org/cgi-bin/mailman/listinfo/observium http://postman.memetic.org/cgi-bin/mailman/listinfo/observium
observium mailing list observium@observium.org mailto:observium@observium.org http://postman.memetic.org/cgi-bin/mailman/listinfo/observium http://postman.memetic.org/cgi-bin/mailman/listinfo/observium _______________________________________________ observium mailing list observium@observium.org mailto:observium@observium.org http://postman.memetic.org/cgi-bin/mailman/listinfo/observium
participants (5)
-
 Adam Armstrong
 -
 Moerman, Maarten
 -
 Shaun Courtney
 -
 Stef Renders
 -
 Svensson Fredrik A