
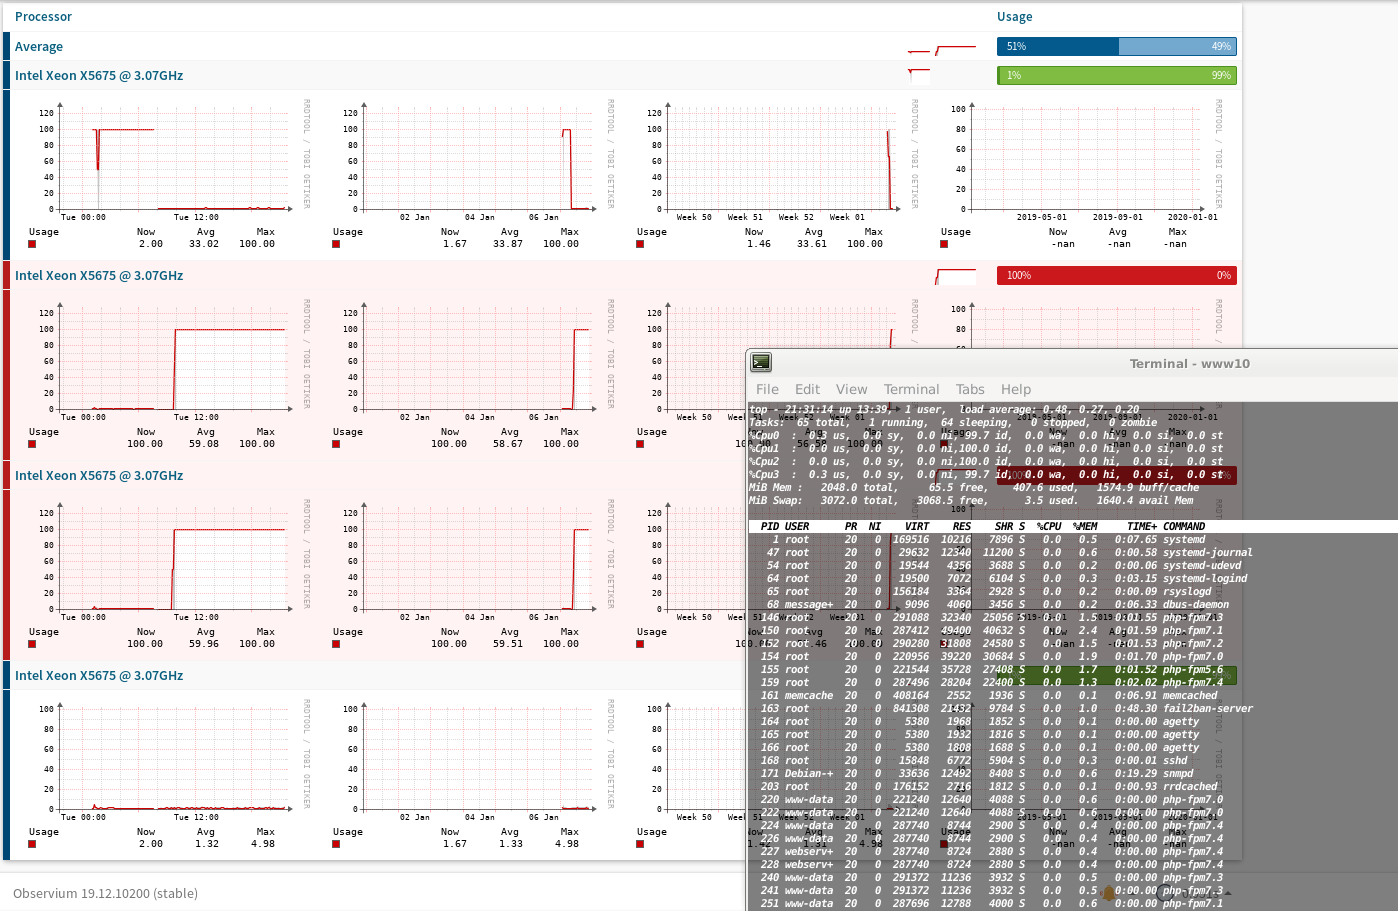
I'm monitoring 3 LXC containers of my new installed homelab server but somehow the CPU values polled via SNMP are completely messy while checking inside the container with TOP they are correct there. Attached is a screenshot of one of three fresh installed LXC containers where they are doing nothing yet showing the CPU utilization via SNMP and TOP. Also the physical server does nothing and is showing the correct values via SNMP and TOP. Anyone know how to fix that?
thx, cody
On 2020-01-07 21:39, cody via observium wrote:
I'm monitoring 3 LXC containers of my new installed homelab server but somehow the CPU values polled via SNMP are completely messy while checking inside the container with TOP they are correct there. Attached is a screenshot of one of three fresh installed LXC containers where they are doing nothing yet showing the CPU utilization via SNMP and TOP. Also the physical server does nothing and is showing the correct values via SNMP and TOP. Anyone know how to fix that?
I've been watching for a while now what happens at every second and it looks like the spikes are generated when the SNMP query is executed. Inside the LXC container the CPU utilization goes up for 1-2 seconds exactly at that time and i assume SNMP fetches then these values. Tried now multiple times with the PRO version in our company and CE version at home and it seems to happen exactly at every 5 minutes when the poller runs.
Attached a screenshot from the CE version at home which also runs as a LXC container when it polls itself - same three cores are showing 100% in TOP for 1 second as in the graph. Doesn't happen in our company with the PRO version running inside a KVM VM.

There's no difference to how the two versions operate when polling these things.
We can only show the data that the SNMPd provides to us. If the number being returned is an instantaneous value instead of a 5 minute average, the act of polling itself will affect the value.
But if you don't poll it, is it even turned on?
Adam.
-----Original Message----- From: observium observium-bounces@observium.org On Behalf Of cody via observium Sent: 07 January 2020 21:52 To: Observium observium@observium.org Cc: cody@mail-server.cc Subject: Re: [Observium] LXC monitoring via SNMP
On 2020-01-07 21:39, cody via observium wrote:
I'm monitoring 3 LXC containers of my new installed homelab server but somehow the CPU values polled via SNMP are completely messy while checking inside the container with TOP they are correct there. Attached is a screenshot of one of three fresh installed LXC containers where they are doing nothing yet showing the CPU utilization via SNMP and TOP. Also the physical server does nothing and is showing the correct values via SNMP and TOP. Anyone know how to fix that?
I've been watching for a while now what happens at every second and it looks like the spikes are generated when the SNMP query is executed. Inside the LXC container the CPU utilization goes up for 1-2 seconds exactly at that time and i assume SNMP fetches then these values. Tried now multiple times with the PRO version in our company and CE version at home and it seems to happen exactly at every 5 minutes when the poller runs.
Attached a screenshot from the CE version at home which also runs as a LXC container when it polls itself - same three cores are showing 100% in TOP for 1 second as in the graph. Doesn't happen in our company with the PRO version running inside a KVM VM.
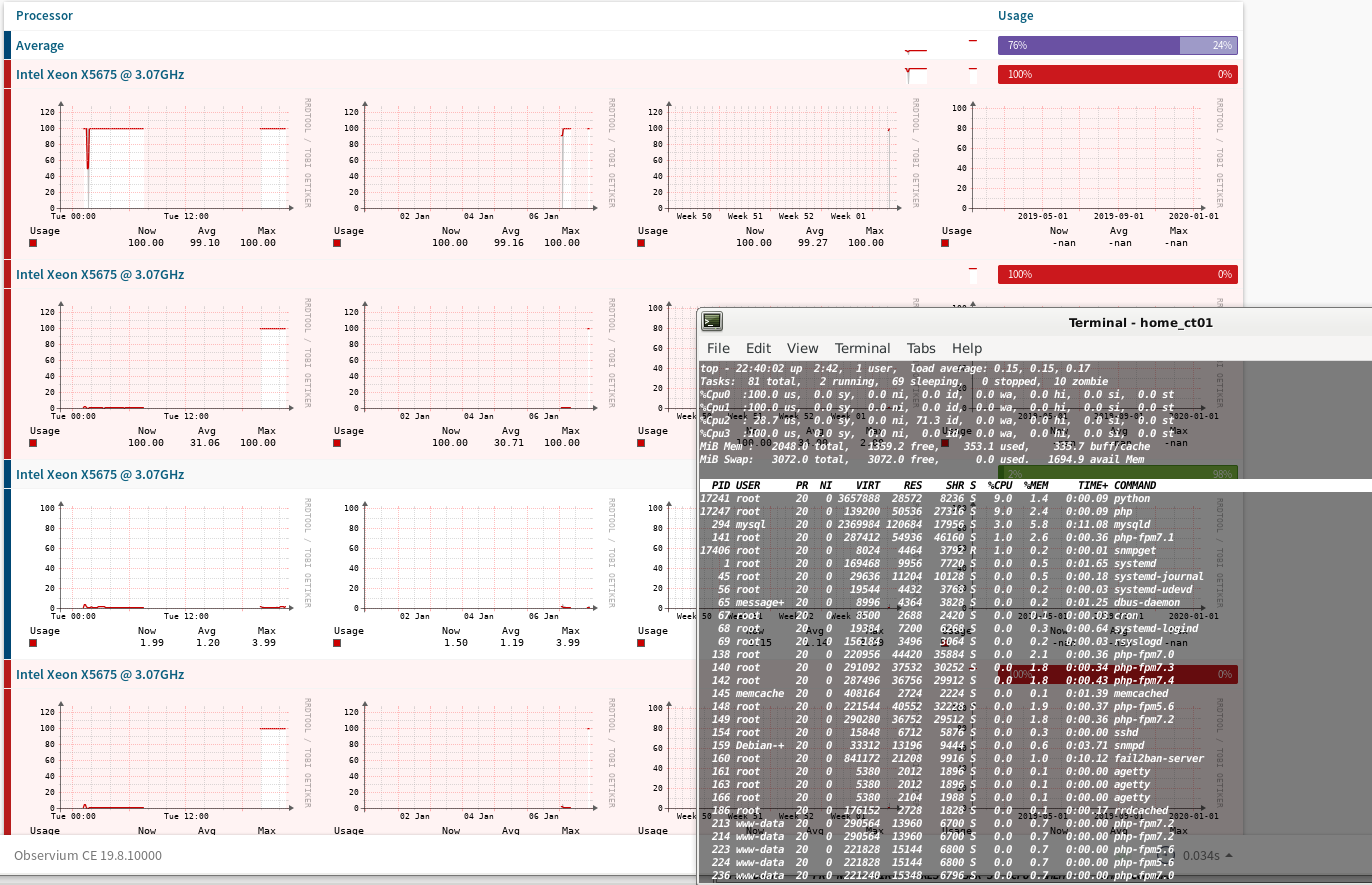
Still confused... the LXC Container im running Observium on and polls itself via SNMP has 4 cores assigned where 3 cores are graphed at 100% all the time since the container is turned on - and it's now explicitly the only Container/VM running on this hardware.
But if i manually run following SNMP query on the LXC Container i get the same values as TOP shows for 1/5/15 minutes:
root@observium-ce:~# snmpwalk -v3 -l authPriv -u xxx -a SHA -A xxx -x AES -X xxx 127.0.0.1 .1.3.6.1.4.1.2021.10.1.3 iso.3.6.1.4.1.2021.10.1.3.1 = STRING: "0.09" iso.3.6.1.4.1.2021.10.1.3.2 = STRING: "0.06" iso.3.6.1.4.1.2021.10.1.3.3 = STRING: "0.07" root@observium-ce:~#
top - 22:17:18 up 1 day, 2:09, 2 users, load average: 0.09, 0.06, 0.07
This doesn't match what is graphed for the CPU cores in Observium
On 2020-01-08 03:05, adama--- via observium wrote:
There's no difference to how the two versions operate when polling these things.
We can only show the data that the SNMPd provides to us. If the number being returned is an instantaneous value instead of a 5 minute average, the act of polling itself will affect the value.
But if you don't poll it, is it even turned on?
Observium is polling the hrProcessorLoad, right?
If run that manually i'm getting exactly what is Observium graphing (when i'm interpreting that correctly) - 3 cores at 100
root@observium-ce:~# snmpwalk -v3 -l authPriv -u xxx -a SHA -A xxx -x AES -X xxx 127.0.0.1 HOST-RESOURCES-MIB::hrProcessorLoad HOST-RESOURCES-MIB::hrProcessorLoad.196608 = INTEGER: 100 HOST-RESOURCES-MIB::hrProcessorLoad.196609 = INTEGER: 100 HOST-RESOURCES-MIB::hrProcessorLoad.196610 = INTEGER: 5 HOST-RESOURCES-MIB::hrProcessorLoad.196611 = INTEGER: 100 root@observium-ce:~#
versus:
root@observium-ce:~# snmpwalk -v3 -l authPriv -u xxx -a SHA -A xxx -x AES -X xxx 127.0.0.1 .1.3.6.1.4.1.2021.10.1.3 iso.3.6.1.4.1.2021.10.1.3.1 = STRING: "0.05" iso.3.6.1.4.1.2021.10.1.3.2 = STRING: "0.07" iso.3.6.1.4.1.2021.10.1.3.3 = STRING: "0.13" root@observium-ce:~#
top - 22:42:48 up 1 day, 2:45, 2 users, load average: 0.05, 0.07, 0.13
On 2020-01-08 22:28, cody via observium wrote:
Still confused... the LXC Container im running Observium on and polls itself via SNMP has 4 cores assigned where 3 cores are graphed at 100% all the time since the container is turned on - and it's now explicitly the only Container/VM running on this hardware.
But if i manually run following SNMP query on the LXC Container i get the same values as TOP shows for 1/5/15 minutes:
root@observium-ce:~# snmpwalk -v3 -l authPriv -u xxx -a SHA -A xxx -x AES -X xxx 127.0.0.1 .1.3.6.1.4.1.2021.10.1.3 iso.3.6.1.4.1.2021.10.1.3.1 = STRING: "0.09" iso.3.6.1.4.1.2021.10.1.3.2 = STRING: "0.06" iso.3.6.1.4.1.2021.10.1.3.3 = STRING: "0.07" root@observium-ce:~#
top - 22:17:18 up 1 day, 2:09, 2 users, load average: 0.09, 0.06, 0.07
This doesn't match what is graphed for the CPU cores in Observium
On 2020-01-08 03:05, adama--- via observium wrote:
There's no difference to how the two versions operate when polling these things.
We can only show the data that the SNMPd provides to us. If the number being returned is an instantaneous value instead of a 5 minute average, the act of polling itself will affect the value.
But if you don't poll it, is it even turned on?
observium mailing list observium@observium.org http://postman.memetic.org/cgi-bin/mailman/listinfo/observium

Why do you think processor load is going to be the same as load average? Oo
They're not measuring the same thing.
Adam.
Sent from BlueMail
On 8 Jan 2020, 21:43, at 21:43, cody via observium observium@observium.org wrote:
Observium is polling the hrProcessorLoad, right?
If run that manually i'm getting exactly what is Observium graphing (when i'm interpreting that correctly) - 3 cores at 100
root@observium-ce:~# snmpwalk -v3 -l authPriv -u xxx -a SHA -A xxx -x AES -X xxx 127.0.0.1 HOST-RESOURCES-MIB::hrProcessorLoad HOST-RESOURCES-MIB::hrProcessorLoad.196608 = INTEGER: 100 HOST-RESOURCES-MIB::hrProcessorLoad.196609 = INTEGER: 100 HOST-RESOURCES-MIB::hrProcessorLoad.196610 = INTEGER: 5 HOST-RESOURCES-MIB::hrProcessorLoad.196611 = INTEGER: 100 root@observium-ce:~#
versus:
root@observium-ce:~# snmpwalk -v3 -l authPriv -u xxx -a SHA -A xxx -x AES -X xxx 127.0.0.1 .1.3.6.1.4.1.2021.10.1.3 iso.3.6.1.4.1.2021.10.1.3.1 = STRING: "0.05" iso.3.6.1.4.1.2021.10.1.3.2 = STRING: "0.07" iso.3.6.1.4.1.2021.10.1.3.3 = STRING: "0.13" root@observium-ce:~#
top - 22:42:48 up 1 day, 2:45, 2 users, load average: 0.05, 0.07, 0.13
On 2020-01-08 22:28, cody via observium wrote:
Still confused... the LXC Container im running Observium on and polls itself via SNMP has 4 cores assigned where 3 cores are graphed at
100%
all the time since the container is turned on - and it's now explicitly the only Container/VM running on this hardware.
But if i manually run following SNMP query on the LXC Container i get the same values as TOP shows for 1/5/15 minutes:
root@observium-ce:~# snmpwalk -v3 -l authPriv -u xxx -a SHA -A xxx -x AES -X xxx 127.0.0.1 .1.3.6.1.4.1.2021.10.1.3 iso.3.6.1.4.1.2021.10.1.3.1 = STRING: "0.09" iso.3.6.1.4.1.2021.10.1.3.2 = STRING: "0.06" iso.3.6.1.4.1.2021.10.1.3.3 = STRING: "0.07" root@observium-ce:~#
top - 22:17:18 up 1 day, 2:09, 2 users, load average: 0.09, 0.06, 0.07
This doesn't match what is graphed for the CPU cores in Observium
On 2020-01-08 03:05, adama--- via observium wrote:
There's no difference to how the two versions operate when polling these things.
We can only show the data that the SNMPd provides to us. If the
number
being returned is an instantaneous value instead of a 5 minute average,
the
act of polling itself will affect the value.
But if you don't poll it, is it even turned on?
observium mailing list observium@observium.org http://postman.memetic.org/cgi-bin/mailman/listinfo/observium
observium mailing list observium@observium.org http://postman.memetic.org/cgi-bin/mailman/listinfo/observium

Just for know:
HOST-RESOURCES-MIB::hrProcessorLoad == .1.3.6.1.2.1.25.3.3.1.2 UCD-SNMP-MIB::laLoad == .1.3.6.1.4.1.2021.10.1.3
Load average is not CPU usage, this metric is old as UNIX: https://en.wikipedia.org/wiki/Load_(computing)
cody via observium wrote on 09.01.2020 00:43:
Observium is polling the hrProcessorLoad, right?
If run that manually i'm getting exactly what is Observium graphing (when i'm interpreting that correctly) - 3 cores at 100
root@observium-ce:~# snmpwalk -v3 -l authPriv -u xxx -a SHA -A xxx -x AES -X xxx 127.0.0.1 HOST-RESOURCES-MIB::hrProcessorLoad HOST-RESOURCES-MIB::hrProcessorLoad.196608 = INTEGER: 100 HOST-RESOURCES-MIB::hrProcessorLoad.196609 = INTEGER: 100 HOST-RESOURCES-MIB::hrProcessorLoad.196610 = INTEGER: 5 HOST-RESOURCES-MIB::hrProcessorLoad.196611 = INTEGER: 100 root@observium-ce:~#
versus:
root@observium-ce:~# snmpwalk -v3 -l authPriv -u xxx -a SHA -A xxx -x AES -X xxx 127.0.0.1 .1.3.6.1.4.1.2021.10.1.3 iso.3.6.1.4.1.2021.10.1.3.1 = STRING: "0.05" iso.3.6.1.4.1.2021.10.1.3.2 = STRING: "0.07" iso.3.6.1.4.1.2021.10.1.3.3 = STRING: "0.13" root@observium-ce:~#
top - 22:42:48 up 1 day, 2:45, 2 users, load average: 0.05, 0.07, 0.13
On 2020-01-08 22:28, cody via observium wrote:
Still confused... the LXC Container im running Observium on and polls itself via SNMP has 4 cores assigned where 3 cores are graphed at 100% all the time since the container is turned on - and it's now explicitly the only Container/VM running on this hardware.
But if i manually run following SNMP query on the LXC Container i get the same values as TOP shows for 1/5/15 minutes:
root@observium-ce:~# snmpwalk -v3 -l authPriv -u xxx -a SHA -A xxx -x AES -X xxx 127.0.0.1 .1.3.6.1.4.1.2021.10.1.3 iso.3.6.1.4.1.2021.10.1.3.1 = STRING: "0.09" iso.3.6.1.4.1.2021.10.1.3.2 = STRING: "0.06" iso.3.6.1.4.1.2021.10.1.3.3 = STRING: "0.07" root@observium-ce:~#
top - 22:17:18 up 1 day, 2:09, 2 users, load average: 0.09, 0.06, 0.07
This doesn't match what is graphed for the CPU cores in Observium
On 2020-01-08 03:05, adama--- via observium wrote:
There's no difference to how the two versions operate when polling these things.
We can only show the data that the SNMPd provides to us. If the number being returned is an instantaneous value instead of a 5 minute average, the act of polling itself will affect the value.
But if you don't poll it, is it even turned on?
observium mailing list observium@observium.org http://postman.memetic.org/cgi-bin/mailman/listinfo/observium
observium mailing list observium@observium.org http://postman.memetic.org/cgi-bin/mailman/listinfo/observium
Those OIDs are load average, not CPU usage.
Adam.
Sent from BlueMail
On 8 Jan 2020, 21:28, at 21:28, cody via observium observium@observium.org wrote:
Still confused... the LXC Container im running Observium on and polls itself via SNMP has 4 cores assigned where 3 cores are graphed at 100% all the time since the container is turned on - and it's now explicitly
the only Container/VM running on this hardware.
But if i manually run following SNMP query on the LXC Container i get the same values as TOP shows for 1/5/15 minutes:
root@observium-ce:~# snmpwalk -v3 -l authPriv -u xxx -a SHA -A xxx -x AES -X xxx 127.0.0.1 .1.3.6.1.4.1.2021.10.1.3 iso.3.6.1.4.1.2021.10.1.3.1 = STRING: "0.09" iso.3.6.1.4.1.2021.10.1.3.2 = STRING: "0.06" iso.3.6.1.4.1.2021.10.1.3.3 = STRING: "0.07" root@observium-ce:~#
top - 22:17:18 up 1 day, 2:09, 2 users, load average: 0.09, 0.06, 0.07
This doesn't match what is graphed for the CPU cores in Observium
On 2020-01-08 03:05, adama--- via observium wrote:
There's no difference to how the two versions operate when polling these things.
We can only show the data that the SNMPd provides to us. If the
number
being returned is an instantaneous value instead of a 5 minute average, the
act of polling itself will affect the value.
But if you don't poll it, is it even turned on?
observium mailing list observium@observium.org http://postman.memetic.org/cgi-bin/mailman/listinfo/observium
participants (4)
-
 Adam Armstrong
 -
 adama@observium.org
 -
 cody@mail-server.cc
 -
 Mike Stupalov