
When looking at the 6 hour graph, if I graph previous, shouldn’t it show what happened during that time frame 24 hours ago? It looks like it’s just showing what happened the 6 hours before the 6 hours I’m looking at. Which is I guess technically true for what “Graph Previous” means. Is there a way to graph previous time frame yesterday?
My use case is zooming in on a time frame and then looking at usage and then trying to see what happened yesterday to see if there was a significant difference. If I zoom in and see the 20 minutes before hand, well it’s just not useful.
It works fine for 24 hr, and week and month. 48 hr could be a little weird as well.
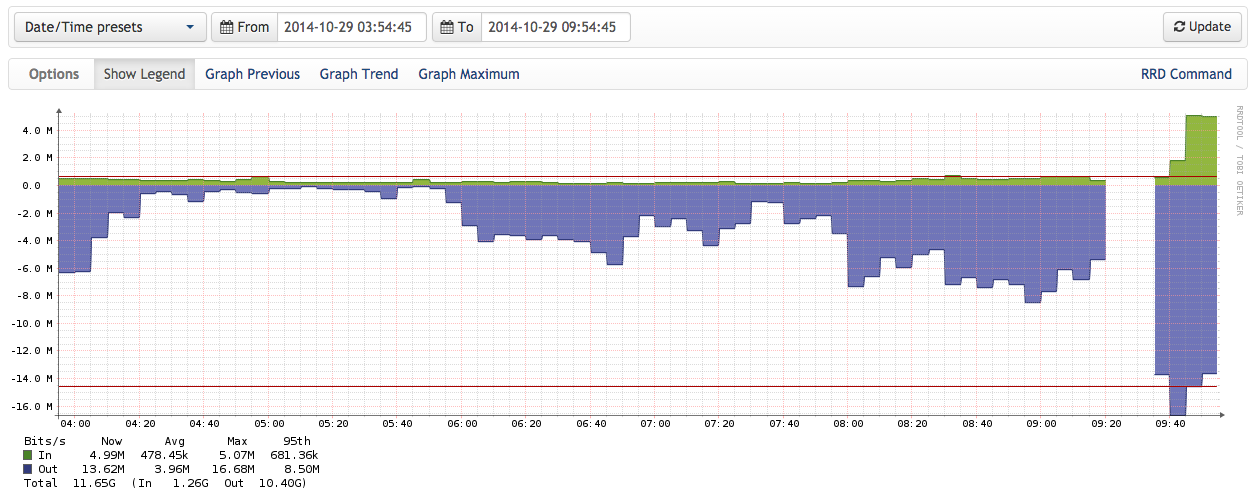
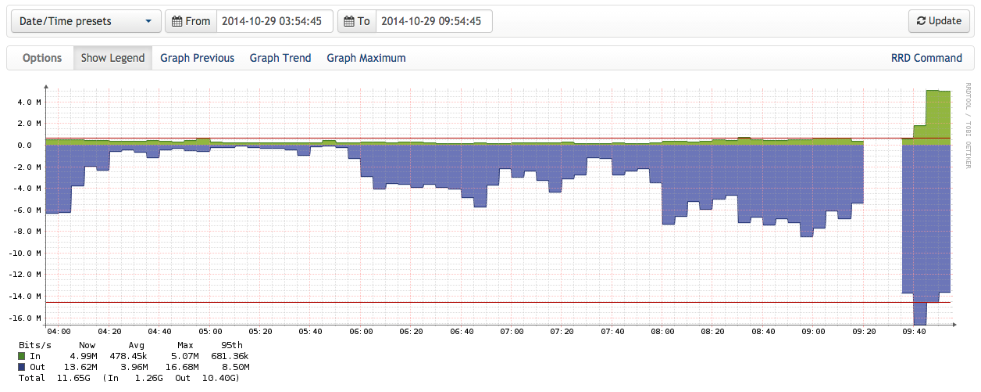
The last 6 hours with graph previous - I don’t know how useful it is to see the previous 6 hours here.
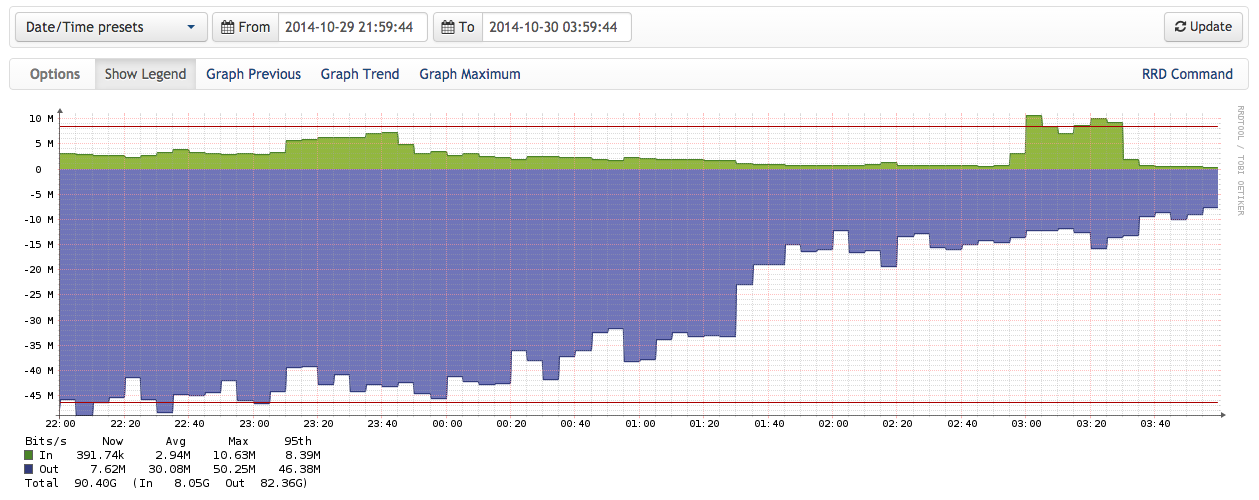
The actual previous time period yesterday - not to same scale
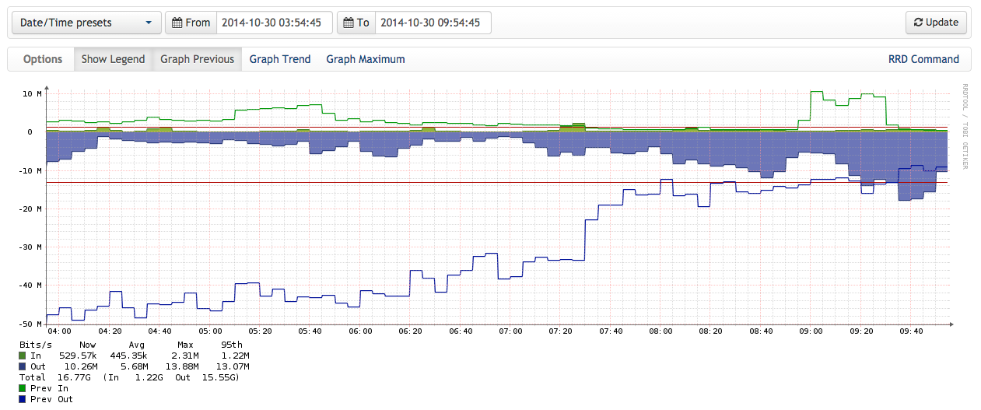
This is what is actually being graphed in graph previous.

It shows you what happened in the previous time period directly before the one you're graphing. It's not currently configurable.
adam.
------ Original Message ------ From: "Justin Miller" observium@dynstatic.net To: "Observium Network Observation System" observium@observium.org Sent: 10/30/2014 8:12:41 AM Subject: [Observium] Graph Previous
When looking at the 6 hour graph, if I graph previous, shouldn’t it show what happened during that time frame 24 hours ago? It looks like it’s just showing what happened the 6 hours before the 6 hours I’m looking at. Which is I guess technically true for what “Graph Previous” means. Is there a way to graph previous time frame yesterday?
My use case is zooming in on a time frame and then looking at usage and then trying to see what happened yesterday to see if there was a significant difference. If I zoom in and see the 20 minutes before hand, well it’s just not useful.
It works fine for 24 hr, and week and month. 48 hr could be a little weird as well.
The last 6 hours with graph previous - I don’t know how useful it is to see the previous 6 hours here.
The actual previous time period yesterday - not to same scale
This is what is actually being graphed in graph previous.
participants (2)
-
 Adam Armstrong
 -
 Justin Miller