Graph Data only displays -nan

First, I must apologize for yet another question about "graphs not working". However, I have read everything I can find in the mail archives, in forums, and have reinstalled multiple times following the instructions exactly. Each time with the -nan listed for all data points. Verified permissions on the rrd and tmp folders and both match the same user/group as what everything is running as. I eventually resorted to installing and running everything as root to try and resolve permission errors. Once I figure out what's wrong I'll go back to std user. Sorry for the long email, but I wanted to include everything I know so far.
Monitoring Host: Ubuntu 13.04 Observium 13.12.4811 Virtual Machine on Hyper-V
Currently Monitored Devices: 3 HP Procurve Switches 1 Ricoh Copier 2 Sonicwall Firewalls
Testing results thus far:
1. Real-time graphing works for each device.
2. Every other graph is drawn, but has "-nan" for each data point. Same for each device.
3. Prior to installing jpgraph (to get billing to work) all devices did not list traffic data under the Ports tab.
4. Post jpgraph install and config, traffic info under Ports tab works for Ricoh Copier and 1 of 3 HP Procurve switches, but no other devices. Only 0 bps is listed.
5. Enabled rrdcached in the config file with adding $config['rrdcached'] = "unix:/var/run/rrdcached.sock";.
6. Ran discovery and polling for everything again and all devices list stats for traffic under Ports tab.
7. Billing still doesn't capture traffic data on any device.
8. Billing Accurate Graphs gives an error of 25121 - "Empty input data array specified for plot. Must have at least one data point." I believe billing errors may be related to the rest.
I ran discovery and polling in debug mode writing to text files and it appears that the data is being pulled from the device correctly. It also looks like it writes the data into the rrd device file and updates the mysql database without showing any errors. Thus, I'm perplexed as to what it could be and have no direction to look into... Help would be appreciated. Thanks, Jason

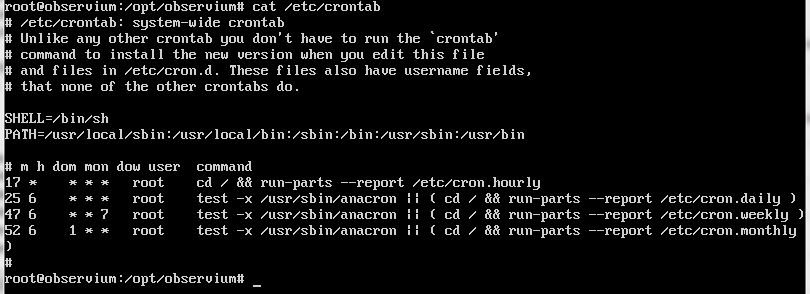
Please paste the output of this command: cat /etc/crontab
Thanks, Tom
On 05/12/2013 21:40, Jason Ross wrote:
First, I must apologize for yet another question about "graphs not working". However, I have read everything I can find in the mail archives, in forums, and have reinstalled multiple times following the instructions exactly. Each time with the --nan listed for all data points. Verified permissions on the rrd and tmp folders and both match the same user/group as what everything is running as. I eventually resorted to installing and running everything as root to try and resolve permission errors. Once I figure out what's wrong I'll go back to std user. Sorry for the long email, but I wanted to include everything I know so far.
Monitoring Host:
Ubuntu 13.04
Observium 13.12.4811
Virtual Machine on Hyper-V
Currently Monitored Devices:
3 HP Procurve Switches
1 Ricoh Copier
2 Sonicwall Firewalls
Testing results thus far:
1.Real-time graphing works for each device.
2.Every other graph is drawn, but has "-nan" for each data point. Same for each device.
3.Prior to installing jpgraph (to get billing to work) all devices did not list traffic data under the Ports tab.
4.Post jpgraph install and config, traffic info under Ports tab works for Ricoh Copier and 1 of 3 HP Procurve switches, but no other devices. Only 0 bps is listed.
5.Enabled rrdcached in the config file with adding $config['rrdcached'] = "unix:/var/run/rrdcached.sock";.
6.Ran discovery and polling for everything again and all devices list stats for traffic under Ports tab.
7.Billing still doesn't capture traffic data on any device.
8.Billing Accurate Graphs gives an error of 25121 -- "Empty input data array specified for plot. Must have at least one data point."
I believe billing errors may be related to the rest.
I ran discovery and polling in debug mode writing to text files and it appears that the data is being pulled from the device correctly. It also looks like it writes the data into the rrd device file and updates the mysql database without showing any errors. Thus, I'm perplexed as to what it could be and have no direction to look into... Help would be appreciated.
Thanks, Jason
observium mailing list observium@observium.org http://postman.memetic.org/cgi-bin/mailman/listinfo/observium
Sorry it's a screenshot instead of text...don't have an easy way to grab files off that server yet. Here is the output. [cid:image001.jpg@01CEF1C1.08821CD0]
From: observium [mailto:observium-bounces@observium.org] On Behalf Of Tom Laermans Sent: Thursday, December 05, 2013 12:59 PM To: Observium Network Observation System Subject: Re: [Observium] Graph Data only displays -nan
Please paste the output of this command: cat /etc/crontab
Thanks, Tom
On 05/12/2013 21:40, Jason Ross wrote: First, I must apologize for yet another question about "graphs not working". However, I have read everything I can find in the mail archives, in forums, and have reinstalled multiple times following the instructions exactly. Each time with the -nan listed for all data points. Verified permissions on the rrd and tmp folders and both match the same user/group as what everything is running as. I eventually resorted to installing and running everything as root to try and resolve permission errors. Once I figure out what's wrong I'll go back to std user. Sorry for the long email, but I wanted to include everything I know so far.
Monitoring Host: Ubuntu 13.04 Observium 13.12.4811 Virtual Machine on Hyper-V
Currently Monitored Devices: 3 HP Procurve Switches 1 Ricoh Copier 2 Sonicwall Firewalls
Testing results thus far:
1. Real-time graphing works for each device.
2. Every other graph is drawn, but has "-nan" for each data point. Same for each device.
3. Prior to installing jpgraph (to get billing to work) all devices did not list traffic data under the Ports tab.
4. Post jpgraph install and config, traffic info under Ports tab works for Ricoh Copier and 1 of 3 HP Procurve switches, but no other devices. Only 0 bps is listed.
5. Enabled rrdcached in the config file with adding $config['rrdcached'] = "unix:/var/run/rrdcached.sock";.
6. Ran discovery and polling for everything again and all devices list stats for traffic under Ports tab.
7. Billing still doesn't capture traffic data on any device.
8. Billing Accurate Graphs gives an error of 25121 - "Empty input data array specified for plot. Must have at least one data point." I believe billing errors may be related to the rest.
I ran discovery and polling in debug mode writing to text files and it appears that the data is being pulled from the device correctly. It also looks like it writes the data into the rrd device file and updates the mysql database without showing any errors. Thus, I'm perplexed as to what it could be and have no direction to look into... Help would be appreciated. Thanks, Jason
_______________________________________________
observium mailing list
observium@observium.orgmailto:observium@observium.org
http://postman.memetic.org/cgi-bin/mailman/listinfo/observium

So where did you put the observium from jobs...?
Adam.
Jason Ross jross@medicalteams.org wrote:
Sorry it's a screenshot instead of text...don't have an easy way to grab files off that server yet. Here is the output. [cid:image001.jpg@01CEF1C1.08821CD0]
From: observium [mailto:observium-bounces@observium.org] On Behalf Of Tom Laermans Sent: Thursday, December 05, 2013 12:59 PM To: Observium Network Observation System Subject: Re: [Observium] Graph Data only displays -nan
Please paste the output of this command: cat /etc/crontab
Thanks, Tom
On 05/12/2013 21:40, Jason Ross wrote: First, I must apologize for yet another question about "graphs not working". However, I have read everything I can find in the mail archives, in forums, and have reinstalled multiple times following the instructions exactly. Each time with the -nan listed for all data points. Verified permissions on the rrd and tmp folders and both match the same user/group as what everything is running as. I eventually resorted to installing and running everything as root to try and resolve permission errors. Once I figure out what's wrong I'll go back to std user. Sorry for the long email, but I wanted to include everything I know so far.
Monitoring Host: Ubuntu 13.04 Observium 13.12.4811 Virtual Machine on Hyper-V
Currently Monitored Devices: 3 HP Procurve Switches 1 Ricoh Copier 2 Sonicwall Firewalls
Testing results thus far:
Real-time graphing works for each device.Every other graph is drawn, but has "-nan" for each datapoint. Same for each device.
Prior to installing jpgraph (to get billing to work) alldevices did not list traffic data under the Ports tab.
Post jpgraph install and config, traffic info under Ports tabworks for Ricoh Copier and 1 of 3 HP Procurve switches, but no other devices. Only 0 bps is listed.
Enabled rrdcached in the config file with adding$config['rrdcached'] = "unix:/var/run/rrdcached.sock";.
Ran discovery and polling for everything again and all deviceslist stats for traffic under Ports tab.
Billing still doesn't capture traffic data on any device.Billing Accurate Graphs gives an error of 25121 - "Empty inputdata array specified for plot. Must have at least one data point." I believe billing errors may be related to the rest.
I ran discovery and polling in debug mode writing to text files and it appears that the data is being pulled from the device correctly. It also looks like it writes the data into the rrd device file and updates the mysql database without showing any errors. Thus, I'm perplexed as to what it could be and have no direction to look into... Help would be appreciated. Thanks, Jason
observium mailing list
observium@observium.orgmailto:observium@observium.org
http://postman.memetic.org/cgi-bin/mailman/listinfo/observium
observium mailing list observium@observium.org http://postman.memetic.org/cgi-bin/mailman/listinfo/observium
Not sure if you meant cron jobs instead of from jobs, but it seems like you may have. I followed the instructions: Add cron jobs, create a new file /etc/cron.d/observium with the following contents: Important! Please note that the below example includes a username, so will only work in /etc/crontab or /etc/cron.d/observium. It will NOT work in a user crontab edited with crontab -e. 33 */6 * * * root /opt/observium/discovery.php -h all >> /dev/null 2>&1 */5 * * * * root /opt/observium/discovery.php -h new >> /dev/null 2>&1 */5 * * * * root /opt/observium/poller-wrapper.py 1 >> /dev/null 2>&1 So these cron jobs are in a file I created located at /etc/cron.d/Observium. Do I need to move them? Thanks, Jason
From: observium [mailto:observium-bounces@observium.org] On Behalf Of Adam Armstrong Sent: Thursday, December 05, 2013 3:39 PM To: Observium Network Observation System Subject: Re: [Observium] Graph Data only displays -nan
So where did you put the observium from jobs...?
Adam.
Jason Ross <jross@medicalteams.orgmailto:jross@medicalteams.org> wrote: Sorry it’s a screenshot instead of text…don’t have an easy way to grab files off that server yet. Here is the output. [cid:image001.jpg@01CEF1C1.08821CD0]
From: observium [mailto:observium-bounces@observium.org] On Behalf Of Tom Laermans Sent: Thursday, December 05, 2013 12:59 PM To: Observium Network Observation System Subject: Re: [Observium] Graph Data only displays -nan
Please paste the output of this command: cat /etc/crontab
Thanks, Tom
On 05/12/2013 21:40, Jason Ross wrote: First, I must apologize for yet another question about “graphs not working”. However, I have read everything I can find in the mail archives, in forums, and have reinstalled multiple times following the instructions exactly. Each time with the –nan listed for all data points. Verified permissions on the rrd and tmp folders and both match the same user/group as what everything is running as. I eventually resorted to installing and running everything as root to try and resolve permission errors. Once I figure out what’s wrong I’ll go back to std user. Sorry for the long email, but I wanted to include everything I know so far.
Monitoring Host: Ubuntu 13.04 Observium 13.12.4811 Virtual Machine on Hyper-V
Currently Monitored Devices: 3 HP Procurve Switches 1 Ricoh Copier 2 Sonicwall Firewalls
Testing results thus far:
1. Real-time graphing works for each device.
2. Every other graph is drawn, but has “-nan” for each data point. Same for each device.
3. Prior to installing jpgraph (to get billing to work) all devices did not list traffic data under the Ports tab.
4. Post jpgraph install and config, traffic info under Ports tab works for Ricoh Copier and 1 of 3 HP Procurve switches, but no other devices. Only 0 bps is listed.
5. Enabled rrdcached in the config file with adding $config['rrdcached'] = "unix:/var/run/rrdcached.sock";.
6. Ran discovery and polling for everything again and all devices list stats for traffic under Ports tab.
7. Billing still doesn’t capture traffic data on any device.
8. Billing Accurate Graphs gives an error of 25121 – “Empty input data array specified for plot. Must have at least one data point.” I believe billing errors may be related to the rest.
I ran discovery and polling in debug mode writing to text files and it appears that the data is being pulled from the device correctly. It also looks like it writes the data into the rrd device file and updates the mysql database without showing any errors. Thus, I’m perplexed as to what it could be and have no direction to look into… Help would be appreciated. Thanks, Jason
_______________________________________________
observium mailing list
observium@observium.orgmailto:observium@observium.org
http://postman.memetic.org/cgi-bin/mailman/listinfo/observium
________________________________
observium mailing list observium@observium.orgmailto:observium@observium.org http://postman.memetic.org/cgi-bin/mailman/listinfo/observium
-- Sent from Kaiten Mail. Please excuse my brevity.
No, that is correct.
Some people insist on trying to put them in a user cron file with crontab -e, very common error, hence the big red box!
Adam.
Jason Ross jross@medicalteams.org wrote:
Not sure if you meant cron jobs instead of from jobs, but it seems like you may have. I followed the instructions: Add cron jobs, create a new file /etc/cron.d/observium with the following contents: Important! Please note that the below example includes a username, so will only work in /etc/crontab or /etc/cron.d/observium. It will NOT work in a user crontab edited with crontab -e. 33 */6 * * * root /opt/observium/discovery.php -h all >> /dev/null 2>&1 */5 * * * * root /opt/observium/discovery.php -h new >> /dev/null 2>&1 */5 * * * * root /opt/observium/poller-wrapper.py 1 >> /dev/null 2>&1 So these cron jobs are in a file I created located at /etc/cron.d/Observium. Do I need to move them? Thanks, Jason
From: observium [mailto:observium-bounces@observium.org] On Behalf Of Adam Armstrong Sent: Thursday, December 05, 2013 3:39 PM To: Observium Network Observation System Subject: Re: [Observium] Graph Data only displays -nan
So where did you put the observium from jobs...?
Adam.
Jason Ross <jross@medicalteams.orgmailto:jross@medicalteams.org> wrote: Sorry it’s a screenshot instead of text…don’t have an easy way to grab files off that server yet. Here is the output. [cid:image001.jpg@01CEF1C1.08821CD0]
From: observium [mailto:observium-bounces@observium.org] On Behalf Of Tom Laermans Sent: Thursday, December 05, 2013 12:59 PM To: Observium Network Observation System Subject: Re: [Observium] Graph Data only displays -nan
Please paste the output of this command: cat /etc/crontab
Thanks, Tom
On 05/12/2013 21:40, Jason Ross wrote: First, I must apologize for yet another question about “graphs not working”. However, I have read everything I can find in the mail archives, in forums, and have reinstalled multiple times following the instructions exactly. Each time with the –nan listed for all data points. Verified permissions on the rrd and tmp folders and both match the same user/group as what everything is running as. I eventually resorted to installing and running everything as root to try and resolve permission errors. Once I figure out what’s wrong I’ll go back to std user. Sorry for the long email, but I wanted to include everything I know so far.
Monitoring Host: Ubuntu 13.04 Observium 13.12.4811 Virtual Machine on Hyper-V
Currently Monitored Devices: 3 HP Procurve Switches 1 Ricoh Copier 2 Sonicwall Firewalls
Testing results thus far:
Real-time graphing works for each device.Every other graph is drawn, but has “-nan” for each datapoint. Same for each device.
Prior to installing jpgraph (to get billing to work) alldevices did not list traffic data under the Ports tab.
Post jpgraph install and config, traffic info under Ports tabworks for Ricoh Copier and 1 of 3 HP Procurve switches, but no other devices. Only 0 bps is listed.
Enabled rrdcached in the config file with adding$config['rrdcached'] = "unix:/var/run/rrdcached.sock";.
Ran discovery and polling for everything again and all deviceslist stats for traffic under Ports tab.
Billing still doesn’t capture traffic data on any device.Billing Accurate Graphs gives an error of 25121 – “Empty inputdata array specified for plot. Must have at least one data point.” I believe billing errors may be related to the rest.
I ran discovery and polling in debug mode writing to text files and it appears that the data is being pulled from the device correctly. It also looks like it writes the data into the rrd device file and updates the mysql database without showing any errors. Thus, I’m perplexed as to what it could be and have no direction to look into… Help would be appreciated. Thanks, Jason
observium mailing list
observium@observium.orgmailto:observium@observium.org
http://postman.memetic.org/cgi-bin/mailman/listinfo/observium
observium mailing list observium@observium.orgmailto:observium@observium.org http://postman.memetic.org/cgi-bin/mailman/listinfo/observium
-- Sent from Kaiten Mail. Please excuse my brevity.
observium mailing list observium@observium.org http://postman.memetic.org/cgi-bin/mailman/listinfo/observium
Ha! Yeah I can at least pick up on the hints. :-)
From: observium [mailto:observium-bounces@observium.org] On Behalf Of Adam Armstrong Sent: Thursday, December 05, 2013 3:45 PM To: Observium Network Observation System Subject: Re: [Observium] Graph Data only displays -nan
No, that is correct.
Some people insist on trying to put them in a user cron file with crontab -e, very common error, hence the big red box!
Adam.
Jason Ross <jross@medicalteams.orgmailto:jross@medicalteams.org> wrote: Not sure if you meant cron jobs instead of from jobs, but it seems like you may have. I followed the instructions: Add cron jobs, create a new file /etc/cron.d/observium with the following contents: Important! Please note that the below example includes a username, so will only work in /etc/crontab or /etc/cron.d/observium. It will NOT work in a user crontab edited with crontab -e. 33 */6 * * * root /opt/observium/discovery.php -h all >> /dev/null 2>&1 */5 * * * * root /opt/observium/discovery.php -h new >> /dev/null 2>&1 */5 * * * * root /opt/observium/poller-wrapper.py 1 >> /dev/null 2>&1 So these cron jobs are in a file I created located at /etc/cron.d/Observium. Do I need to move them? Thanks, Jason
From: observium [mailto:observium-bounces@observium.org] On Behalf Of Adam Armstrong Sent: Thursday, December 05, 2013 3:39 PM To: Observium Network Observation System Subject: Re: [Observium] Graph Data only displays -nan
So where did you put the observium from jobs...?
Adam.
Jason Ross <jross@medicalteams.orgmailto:jross@medicalteams.org> wrote: Sorry it’s a screenshot instead of text…don’t have an easy way to grab files off that server yet. Here is the output. [cid:image001.jpg@01CEF1C1.08821CD0]
From: observium [mailto:observium-bounces@observium.org] On Behalf Of Tom Laermans Sent: Thursday, December 05, 2013 12:59 PM To: Observium Network Observation System Subject: Re: [Observium] Graph Data only displays -nan
Please paste the output of this command: cat /etc/crontab
Thanks, Tom
On 05/12/2013 21:40, Jason Ross wrote: First, I must apologize for yet another question about “graphs not working”. However, I have read everything I can find in the mail archives, in forums, and have reinstalled multiple times following the instructions exactly. Each time with the –nan listed for all data points. Verified permissions on the rrd and tmp folders and both match the same user/group as what everything is running as. I eventually resorted to installing and running everything as root to try and resolve permission errors. Once I figure out what’s wrong I’ll go back to std user. Sorry for the long email, but I wanted to include everything I know so far.
Monitoring Host: Ubuntu 13.04 Observium 13.12.4811 Virtual Machine on Hyper-V
Currently Monitored Devices: 3 HP Procurve Switches 1 Ricoh Copier 2 Sonicwall Firewalls
Testing results thus far:
1. Real-time graphing works for each device.
2. Every other graph is drawn, but has “-nan” for each data point. Same for each device.
3. Prior to installing jpgraph (to get billing to work) all devices did not list traffic data under the Ports tab.
4. Post jpgraph install and config, traffic info under Ports tab works for Ricoh Copier and 1 of 3 HP Procurve switches, but no other devices. Only 0 bps is listed.
5. Enabled rrdcached in the config file with adding $config['rrdcached'] = "unix:/var/run/rrdcached.sock";.
6. Ran discovery and polling for everything again and all devices list stats for traffic under Ports tab.
7. Billing still doesn’t capture traffic data on any device.
8. Billing Accurate Graphs gives an error of 25121 – “Empty input data array specified for plot. Must have at least one data point.” I believe billing errors may be related to the rest.
I ran discovery and polling in debug mode writing to text files and it appears that the data is being pulled from the device correctly. It also looks like it writes the data into the rrd device file and updates the mysql database without showing any errors. Thus, I’m perplexed as to what it could be and have no direction to look into… Help would be appreciated. Thanks, Jason
_______________________________________________
observium mailing list
observium@observium.orgmailto:observium@observium.org
http://postman.memetic.org/cgi-bin/mailman/listinfo/observium
________________________________
observium mailing list observium@observium.orgmailto:observium@observium.org http://postman.memetic.org/cgi-bin/mailman/listinfo/observium
-- Sent from Kaiten Mail. Please excuse my brevity.
Any other ideas or things I can check?
From: observium [mailto:observium-bounces@observium.org] On Behalf Of Jason Ross Sent: Thursday, December 05, 2013 3:48 PM To: Observium Network Observation System Subject: Re: [Observium] Graph Data only displays -nan
Ha! Yeah I can at least pick up on the hints. :-)
From: observium [mailto:observium-bounces@observium.org] On Behalf Of Adam Armstrong Sent: Thursday, December 05, 2013 3:45 PM To: Observium Network Observation System Subject: Re: [Observium] Graph Data only displays -nan
No, that is correct.
Some people insist on trying to put them in a user cron file with crontab -e, very common error, hence the big red box!
Adam.
Jason Ross <jross@medicalteams.orgmailto:jross@medicalteams.org> wrote: Not sure if you meant cron jobs instead of from jobs, but it seems like you may have. I followed the instructions: Add cron jobs, create a new file /etc/cron.d/observium with the following contents: Important! Please note that the below example includes a username, so will only work in /etc/crontab or /etc/cron.d/observium. It will NOT work in a user crontab edited with crontab -e. 33 */6 * * * root /opt/observium/discovery.php -h all >> /dev/null 2>&1 */5 * * * * root /opt/observium/discovery.php -h new >> /dev/null 2>&1 */5 * * * * root /opt/observium/poller-wrapper.py 1 >> /dev/null 2>&1 So these cron jobs are in a file I created located at /etc/cron.d/Observium. Do I need to move them? Thanks, Jason
From: observium [mailto:observium-bounces@observium.org] On Behalf Of Adam Armstrong Sent: Thursday, December 05, 2013 3:39 PM To: Observium Network Observation System Subject: Re: [Observium] Graph Data only displays -nan
So where did you put the observium from jobs...?
Adam.
Jason Ross <jross@medicalteams.orgmailto:jross@medicalteams.org> wrote: Sorry it’s a screenshot instead of text…don’t have an easy way to grab files off that server yet. Here is the output. [cid:image001.jpg@01CEF1C1.08821CD0]
From: observium [mailto:observium-bounces@observium.org] On Behalf Of Tom Laermans Sent: Thursday, December 05, 2013 12:59 PM To: Observium Network Observation System Subject: Re: [Observium] Graph Data only displays -nan
Please paste the output of this command: cat /etc/crontab
Thanks, Tom
On 05/12/2013 21:40, Jason Ross wrote: First, I must apologize for yet another question about “graphs not working”. However, I have read everything I can find in the mail archives, in forums, and have reinstalled multiple times following the instructions exactly. Each time with the –nan listed for all data points. Verified permissions on the rrd and tmp folders and both match the same user/group as what everything is running as. I eventually resorted to installing and running everything as root to try and resolve permission errors. Once I figure out what’s wrong I’ll go back to std user. Sorry for the long email, but I wanted to include everything I know so far.
Monitoring Host: Ubuntu 13.04 Observium 13.12.4811 Virtual Machine on Hyper-V
Currently Monitored Devices: 3 HP Procurve Switches 1 Ricoh Copier 2 Sonicwall Firewalls
Testing results thus far:
1. Real-time graphing works for each device.
2. Every other graph is drawn, but has “-nan” for each data point. Same for each device.
3. Prior to installing jpgraph (to get billing to work) all devices did not list traffic data under the Ports tab.
4. Post jpgraph install and config, traffic info under Ports tab works for Ricoh Copier and 1 of 3 HP Procurve switches, but no other devices. Only 0 bps is listed.
5. Enabled rrdcached in the config file with adding $config['rrdcached'] = "unix:/var/run/rrdcached.sock";.
6. Ran discovery and polling for everything again and all devices list stats for traffic under Ports tab.
7. Billing still doesn’t capture traffic data on any device.
8. Billing Accurate Graphs gives an error of 25121 – “Empty input data array specified for plot. Must have at least one data point.” I believe billing errors may be related to the rest.
I ran discovery and polling in debug mode writing to text files and it appears that the data is being pulled from the device correctly. It also looks like it writes the data into the rrd device file and updates the mysql database without showing any errors. Thus, I’m perplexed as to what it could be and have no direction to look into… Help would be appreciated. Thanks, Jason
_______________________________________________
observium mailing list
observium@observium.orgmailto:observium@observium.org
http://postman.memetic.org/cgi-bin/mailman/listinfo/observium
________________________________
observium mailing list observium@observium.orgmailto:observium@observium.org http://postman.memetic.org/cgi-bin/mailman/listinfo/observium
-- Sent from Kaiten Mail. Please excuse my brevity.
Ok, so I know my graphing issus are permissions related, and I’ve checked the rrd folder permissions / tried adjusting them with solutions given to other people with graphing problems. I’m still unable to get anything other than “-nan” into the graphs. -All graphs write, but no data is displayed. -Realtime graphs display data -Traffic stats is being displayed in the “Ports” tab for my devices.
Install Info: -During last setup/install I enabled root user and installed everything under root. (Was a last ditch effort and I’ll change / redo after I get this working at least once…) -rrd folder has root:root listed with “ls -la” output. (I tried using www-data:ww-data, Observium:root, etc with no success.) -cron jobs (not using e-tab) had user “root” listed exactly like in the install guide. /etc/cron.d/Observium Currently has no user listed, but it made no difference that I can see.
Today I updated to version 4836 and had “no auth” displayed in the device graphs previews, which I hadn’t ever seen before. Seems like it was something that changed from 4811 to 4836 as I hadn’t made any other changes. However, I still only get –nan in the data fields, which furthers my belief that I’m missing something having to do with folder permissions.
Can someone give a list of folders that need to have specific permissions set? And if you’re feeling REALLY generous, maybe even what the permissions should be with knowing that everything was installed using the root user? I’d really love to move past this and start testing Observium! Thanks, Jason
From: observium [mailto:observium-bounces@observium.org] On Behalf Of Jason Ross Sent: Friday, December 06, 2013 10:25 AM To: Observium Network Observation System Subject: Re: [Observium] Graph Data only displays -nan
Any other ideas or things I can check?
From: observium [mailto:observium-bounces@observium.org] On Behalf Of Jason Ross Sent: Thursday, December 05, 2013 3:48 PM To: Observium Network Observation System Subject: Re: [Observium] Graph Data only displays -nan
Ha! Yeah I can at least pick up on the hints. :-)
From: observium [mailto:observium-bounces@observium.org] On Behalf Of Adam Armstrong Sent: Thursday, December 05, 2013 3:45 PM To: Observium Network Observation System Subject: Re: [Observium] Graph Data only displays -nan
No, that is correct.
Some people insist on trying to put them in a user cron file with crontab -e, very common error, hence the big red box!
Adam.
Jason Ross <jross@medicalteams.orgmailto:jross@medicalteams.org> wrote: Not sure if you meant cron jobs instead of from jobs, but it seems like you may have. I followed the instructions: Add cron jobs, create a new file /etc/cron.d/observium with the following contents: Important! Please note that the below example includes a username, so will only work in /etc/crontab or /etc/cron.d/observium. It will NOT work in a user crontab edited with crontab -e. 33 */6 * * * root /opt/observium/discovery.php -h all >> /dev/null 2>&1 */5 * * * * root /opt/observium/discovery.php -h new >> /dev/null 2>&1 */5 * * * * root /opt/observium/poller-wrapper.py 1 >> /dev/null 2>&1 So these cron jobs are in a file I created located at /etc/cron.d/Observium. Do I need to move them? Thanks, Jason
From: observium [mailto:observium-bounces@observium.org] On Behalf Of Adam Armstrong Sent: Thursday, December 05, 2013 3:39 PM To: Observium Network Observation System Subject: Re: [Observium] Graph Data only displays -nan
So where did you put the observium from jobs...?
Adam.
Jason Ross <jross@medicalteams.orgmailto:jross@medicalteams.org> wrote: Sorry it’s a screenshot instead of text…don’t have an easy way to grab files off that server yet. Here is the output. [cid:image001.jpg@01CEF1C1.08821CD0]
From: observium [mailto:observium-bounces@observium.org] On Behalf Of Tom Laermans Sent: Thursday, December 05, 2013 12:59 PM To: Observium Network Observation System Subject: Re: [Observium] Graph Data only displays -nan
Please paste the output of this command: cat /etc/crontab
Thanks, Tom
On 05/12/2013 21:40, Jason Ross wrote: First, I must apologize for yet another question about “graphs not working”. However, I have read everything I can find in the mail archives, in forums, and have reinstalled multiple times following the instructions exactly. Each time with the –nan listed for all data points. Verified permissions on the rrd and tmp folders and both match the same user/group as what everything is running as. I eventually resorted to installing and running everything as root to try and resolve permission errors. Once I figure out what’s wrong I’ll go back to std user. Sorry for the long email, but I wanted to include everything I know so far.
Monitoring Host: Ubuntu 13.04 Observium 13.12.4811 Virtual Machine on Hyper-V
Currently Monitored Devices: 3 HP Procurve Switches 1 Ricoh Copier 2 Sonicwall Firewalls
Testing results thus far:
1. Real-time graphing works for each device.
2. Every other graph is drawn, but has “-nan” for each data point. Same for each device.
3. Prior to installing jpgraph (to get billing to work) all devices did not list traffic data under the Ports tab.
4. Post jpgraph install and config, traffic info under Ports tab works for Ricoh Copier and 1 of 3 HP Procurve switches, but no other devices. Only 0 bps is listed.
5. Enabled rrdcached in the config file with adding $config['rrdcached'] = "unix:/var/run/rrdcached.sock";.
6. Ran discovery and polling for everything again and all devices list stats for traffic under Ports tab.
7. Billing still doesn’t capture traffic data on any device.
8. Billing Accurate Graphs gives an error of 25121 – “Empty input data array specified for plot. Must have at least one data point.” I believe billing errors may be related to the rest.
I ran discovery and polling in debug mode writing to text files and it appears that the data is being pulled from the device correctly. It also looks like it writes the data into the rrd device file and updates the mysql database without showing any errors. Thus, I’m perplexed as to what it could be and have no direction to look into… Help would be appreciated. Thanks, Jason
_______________________________________________
observium mailing list
observium@observium.orgmailto:observium@observium.org
http://postman.memetic.org/cgi-bin/mailman/listinfo/observium
________________________________
observium mailing list observium@observium.orgmailto:observium@observium.org http://postman.memetic.org/cgi-bin/mailman/listinfo/observium
-- Sent from Kaiten Mail. Please excuse my brevity.
Is this a clean server with nothing else on it?
Jason Ross jross@medicalteams.org wrote:
Ok, so I know my graphing issus are permissions related, and I’ve checked the rrd folder permissions / tried adjusting them with solutions given to other people with graphing problems. I’m still unable to get anything other than “-nan” into the graphs. -All graphs write, but no data is displayed. -Realtime graphs display data -Traffic stats is being displayed in the “Ports” tab for my devices.
Install Info: -During last setup/install I enabled root user and installed everything under root. (Was a last ditch effort and I’ll change / redo after I get this working at least once…) -rrd folder has root:root listed with “ls -la” output. (I tried using www-data:ww-data, Observium:root, etc with no success.) -cron jobs (not using e-tab) had user “root” listed exactly like in the install guide. /etc/cron.d/Observium Currently has no user listed, but it made no difference that I can see.
Today I updated to version 4836 and had “no auth” displayed in the device graphs previews, which I hadn’t ever seen before. Seems like it was something that changed from 4811 to 4836 as I hadn’t made any other changes. However, I still only get –nan in the data fields, which furthers my belief that I’m missing something having to do with folder permissions.
Can someone give a list of folders that need to have specific permissions set? And if you’re feeling REALLY generous, maybe even what the permissions should be with knowing that everything was installed using the root user? I’d really love to move past this and start testing Observium! Thanks, Jason
From: observium [mailto:observium-bounces@observium.org] On Behalf Of Jason Ross Sent: Friday, December 06, 2013 10:25 AM To: Observium Network Observation System Subject: Re: [Observium] Graph Data only displays -nan
Any other ideas or things I can check?
From: observium [mailto:observium-bounces@observium.org] On Behalf Of Jason Ross Sent: Thursday, December 05, 2013 3:48 PM To: Observium Network Observation System Subject: Re: [Observium] Graph Data only displays -nan
Ha! Yeah I can at least pick up on the hints. :-)
From: observium [mailto:observium-bounces@observium.org] On Behalf Of Adam Armstrong Sent: Thursday, December 05, 2013 3:45 PM To: Observium Network Observation System Subject: Re: [Observium] Graph Data only displays -nan
No, that is correct.
Some people insist on trying to put them in a user cron file with crontab -e, very common error, hence the big red box!
Adam.
Jason Ross <jross@medicalteams.orgmailto:jross@medicalteams.org> wrote: Not sure if you meant cron jobs instead of from jobs, but it seems like you may have. I followed the instructions: Add cron jobs, create a new file /etc/cron.d/observium with the following contents: Important! Please note that the below example includes a username, so will only work in /etc/crontab or /etc/cron.d/observium. It will NOT work in a user crontab edited with crontab -e. 33 */6 * * * root /opt/observium/discovery.php -h all >> /dev/null 2>&1 */5 * * * * root /opt/observium/discovery.php -h new >> /dev/null 2>&1 */5 * * * * root /opt/observium/poller-wrapper.py 1 >> /dev/null 2>&1 So these cron jobs are in a file I created located at /etc/cron.d/Observium. Do I need to move them? Thanks, Jason
From: observium [mailto:observium-bounces@observium.org] On Behalf Of Adam Armstrong Sent: Thursday, December 05, 2013 3:39 PM To: Observium Network Observation System Subject: Re: [Observium] Graph Data only displays -nan
So where did you put the observium from jobs...?
Adam.
Jason Ross <jross@medicalteams.orgmailto:jross@medicalteams.org> wrote: Sorry it’s a screenshot instead of text…don’t have an easy way to grab files off that server yet. Here is the output. [cid:image001.jpg@01CEF1C1.08821CD0]
From: observium [mailto:observium-bounces@observium.org] On Behalf Of Tom Laermans Sent: Thursday, December 05, 2013 12:59 PM To: Observium Network Observation System Subject: Re: [Observium] Graph Data only displays -nan
Please paste the output of this command: cat /etc/crontab
Thanks, Tom
On 05/12/2013 21:40, Jason Ross wrote: First, I must apologize for yet another question about “graphs not working”. However, I have read everything I can find in the mail archives, in forums, and have reinstalled multiple times following the instructions exactly. Each time with the –nan listed for all data points. Verified permissions on the rrd and tmp folders and both match the same user/group as what everything is running as. I eventually resorted to installing and running everything as root to try and resolve permission errors. Once I figure out what’s wrong I’ll go back to std user. Sorry for the long email, but I wanted to include everything I know so far.
Monitoring Host: Ubuntu 13.04 Observium 13.12.4811 Virtual Machine on Hyper-V
Currently Monitored Devices: 3 HP Procurve Switches 1 Ricoh Copier 2 Sonicwall Firewalls
Testing results thus far:
Real-time graphing works for each device.Every other graph is drawn, but has “-nan” for each datapoint. Same for each device.
Prior to installing jpgraph (to get billing to work) alldevices did not list traffic data under the Ports tab.
Post jpgraph install and config, traffic info under Ports tabworks for Ricoh Copier and 1 of 3 HP Procurve switches, but no other devices. Only 0 bps is listed.
Enabled rrdcached in the config file with adding$config['rrdcached'] = "unix:/var/run/rrdcached.sock";.
Ran discovery and polling for everything again and all deviceslist stats for traffic under Ports tab.
Billing still doesn’t capture traffic data on any device.Billing Accurate Graphs gives an error of 25121 – “Empty inputdata array specified for plot. Must have at least one data point.” I believe billing errors may be related to the rest.
I ran discovery and polling in debug mode writing to text files and it appears that the data is being pulled from the device correctly. It also looks like it writes the data into the rrd device file and updates the mysql database without showing any errors. Thus, I’m perplexed as to what it could be and have no direction to look into… Help would be appreciated. Thanks, Jason
observium mailing list
observium@observium.orgmailto:observium@observium.org
http://postman.memetic.org/cgi-bin/mailman/listinfo/observium
observium mailing list observium@observium.orgmailto:observium@observium.org http://postman.memetic.org/cgi-bin/mailman/listinfo/observium
-- Sent from Kaiten Mail. Please excuse my brevity.
observium mailing list observium@observium.org http://postman.memetic.org/cgi-bin/mailman/listinfo/observium
Yes, virtualized using hyper-v, but nothing else is on it. Started with a fresh image of Ubuntu server and went right into the Observium install instructions.
From: observium [mailto:observium-bounces@observium.org] On Behalf Of Adam Armstrong Sent: Tuesday, December 17, 2013 1:16 PM To: Observium Network Observation System Subject: Re: [Observium] Graph Data only displays -nan
Is this a clean server with nothing else on it? Jason Ross <jross@medicalteams.orgmailto:jross@medicalteams.org> wrote: Ok, so I know my graphing issus are permissions related, and I’ve checked the rrd folder permissions / tried adjusting them with solutions given to other people with graphing problems. I’m still unable to get anything other than “-nan” into the graphs. -All graphs write, but no data is displayed. -Realtime graphs display data -Traffic stats is being displayed in the “Ports” tab for my devices.
Install Info: -During last setup/install I enabled root user and installed everything under root. (Was a last ditch effort and I’ll change / redo after I get this working at least once…) -rrd folder has root:root listed with “ls -la” output. (I tried using www-data:ww-data, Observium:root, etc with no success.) -cron jobs (not using e-tab) had user “root” listed exactly like in the install guide. /etc/cron.d/Observium Currently has no user listed, but it made no difference that I can see.
Today I updated to version 4836 and had “no auth” displayed in the device graphs previews, which I hadn’t ever seen before. Seems like it was something that changed from 4811 to 4836 as I hadn’t made any other changes. However, I still only get –nan in the data fields, which furthers my belief that I’m missing something having to do with folder permissions.
Can someone give a list of folders that need to have specific permissions set? And if you’re feeling REALLY generous, maybe even what the permissions should be with knowing that everything was installed using the root user? I’d really love to move past this and start testing Observium! Thanks, Jason
From: observium [mailto:observium-bounces@observium.org] On Behalf Of Jason Ross Sent: Friday, December 06, 2013 10:25 AM To: Observium Network Observation System Subject: Re: [Observium] Graph Data only displays -nan
Any other ideas or things I can check?
From: observium [mailto:observium-bounces@observium.org] On Behalf Of Jason Ross Sent: Thursday, December 05, 2013 3:48 PM To: Observium Network Observation System Subject: Re: [Observium] Graph Data only displays -nan
Ha! Yeah I can at least pick up on the hints. :-)
From: observium [mailto:observium-bounces@observium.org] On Behalf Of Adam Armstrong Sent: Thursday, December 05, 2013 3:45 PM To: Observium Network Observation System Subject: Re: [Observium] Graph Data only displays -nan
No, that is correct.
Some people insist on trying to put them in a user cron file with crontab -e, very common error, hence the big red box!
Adam.
Jason Ross <jross@medicalteams.orgmailto:jross@medicalteams.org> wrote: Not sure if you meant cron jobs instead of from jobs, but it seems like you may have. I followed the instructions: Add cron jobs, create a new file /etc/cron.d/observium with the following contents: Important! Please note that the below example includes a username, so will only work in /etc/crontab or /etc/cron.d/observium. It will NOT work in a user crontab edited with crontab -e. 33 */6 * * * root /opt/observium/discovery.php -h all >> /dev/null 2>&1 */5 * * * * root /opt/observium/discovery.php -h new >> /dev/null 2>&1 */5 * * * * root /opt/observium/poller-wrapper.py 1 >> /dev/null 2>&1 So these cron jobs are in a file I created located at /etc/cron.d/Observium. Do I need to move them? Thanks, Jason
From: observium [mailto:observium-bounces@observium.org] On Behalf Of Adam Armstrong Sent: Thursday, December 05, 2013 3:39 PM To: Observium Network Observation System Subject: Re: [Observium] Graph Data only displays -nan
So where did you put the observium from jobs...?
Adam.
Jason Ross <jross@medicalteams.orgmailto:jross@medicalteams.org> wrote: Sorry it’s a screenshot instead of text…don’t have an easy way to grab files off that server yet. Here is the output. [cid:image001.jpg@01CEF1C1.08821CD0]
From: observium [mailto:observium-bounces@observium.org] On Behalf Of Tom Laermans Sent: Thursday, December 05, 2013 12:59 PM To: Observium Network Observation System Subject: Re: [Observium] Graph Data only displays -nan
Please paste the output of this command: cat /etc/crontab
Thanks, Tom
On 05/12/2013 21:40, Jason Ross wrote: First, I must apologize for yet another question about “graphs not working”. However, I have read everything I can find in the mail archives, in forums, and have reinstalled multiple times following the instructions exactly. Each time with the –nan listed for all data points. Verified permissions on the rrd and tmp folders and both match the same user/group as what everything is running as. I eventually resorted to installing and running everything as root to try and resolve permission errors. Once I figure out what’s wrong I’ll go back to std user. Sorry for the long email, but I wanted to include everything I know so far.
Monitoring Host: Ubuntu 13.04 Observium 13.12.4811 Virtual Machine on Hyper-V
Currently Monitored Devices: 3 HP Procurve Switches 1 Ricoh Copier 2 Sonicwall Firewalls
Testing results thus far:
1. Real-time graphing works for each device.
2. Every other graph is drawn, but has “-nan” for each data point. Same for each device.
3. Prior to installing jpgraph (to get billing to work) all devices did not list traffic data under the Ports tab.
4. Post jpgraph install and config, traffic info under Ports tab works for Ricoh Copier and 1 of 3 HP Procurve switches, but no other devices. Only 0 bps is listed.
5. Enabled rrdcached in the config file with adding $config['rrdcached'] = "unix:/var/run/rrdcached.sock";.
6. Ran discovery and polling for everything again and all devices list stats for traffic under Ports tab.
7. Billing still doesn’t capture traffic data on any device.
8. Billing Accurate Graphs gives an error of 25121 – “Empty input data array specified for plot. Must have at least one data point.” I believe billing errors may be related to the rest.
I ran discovery and polling in debug mode writing to text files and it appears that the data is being pulled from the device correctly. It also looks like it writes the data into the rrd device file and updates the mysql database without showing any errors. Thus, I’m perplexed as to what it could be and have no direction to look into… Help would be appreciated. Thanks, Jason
_______________________________________________
observium mailing list
observium@observium.orgmailto:observium@observium.org
http://postman.memetic.org/cgi-bin/mailman/listinfo/observium
________________________________
observium mailing list observium@observium.orgmailto:observium@observium.org http://postman.memetic.org/cgi-bin/mailman/listinfo/observium
-- Sent from my Android device with K-9 Mail. Please excuse my brevity.

CHMOD 755 on /opt/observium/rrd and ensure you don’t have anything in your snmpd.conf file.
I had the same issue.
-- Sincerely, Joshua Hopper, A+ CE Network Administrator [cid:image001.jpg@01CEFB48.848726F0] 420 3rd Ave NW Hickory NC 28601 Office: 828-449-1839x2160 | Cell: 828-855-7565
From: observium [mailto:observium-bounces@observium.org] On Behalf Of Jason Ross Sent: Tuesday, December 17, 2013 4:45 PM To: Observium Network Observation System Subject: Re: [Observium] Graph Data only displays -nan
Yes, virtualized using hyper-v, but nothing else is on it. Started with a fresh image of Ubuntu server and went right into the Observium install instructions.
From: observium [mailto:observium-bounces@observium.org] On Behalf Of Adam Armstrong Sent: Tuesday, December 17, 2013 1:16 PM To: Observium Network Observation System Subject: Re: [Observium] Graph Data only displays -nan
Is this a clean server with nothing else on it? Jason Ross <jross@medicalteams.orgmailto:jross@medicalteams.org> wrote: Ok, so I know my graphing issus are permissions related, and I’ve checked the rrd folder permissions / tried adjusting them with solutions given to other people with graphing problems. I’m still unable to get anything other than “-nan” into the graphs. -All graphs write, but no data is displayed. -Realtime graphs display data -Traffic stats is being displayed in the “Ports” tab for my devices.
Install Info: -During last setup/install I enabled root user and installed everything under root. (Was a last ditch effort and I’ll change / redo after I get this working at least once…) -rrd folder has root:root listed with “ls -la” output. (I tried using www-data:ww-data, Observium:root, etc with no success.) -cron jobs (not using e-tab) had user “root” listed exactly like in the install guide. /etc/cron.d/Observium Currently has no user listed, but it made no difference that I can see.
Today I updated to version 4836 and had “no auth” displayed in the device graphs previews, which I hadn’t ever seen before. Seems like it was something that changed from 4811 to 4836 as I hadn’t made any other changes. However, I still only get –nan in the data fields, which furthers my belief that I’m missing something having to do with folder permissions.
Can someone give a list of folders that need to have specific permissions set? And if you’re feeling REALLY generous, maybe even what the permissions should be with knowing that everything was installed using the root user? I’d really love to move past this and start testing Observium! Thanks, Jason
From: observium [mailto:observium-bounces@observium.org] On Behalf Of Jason Ross Sent: Friday, December 06, 2013 10:25 AM To: Observium Network Observation System Subject: Re: [Observium] Graph Data only displays -nan
Any other ideas or things I can check?
From: observium [mailto:observium-bounces@observium.org] On Behalf Of Jason Ross Sent: Thursday, December 05, 2013 3:48 PM To: Observium Network Observation System Subject: Re: [Observium] Graph Data only displays -nan
Ha! Yeah I can at least pick up on the hints. :-)
From: observium [mailto:observium-bounces@observium.org] On Behalf Of Adam Armstrong Sent: Thursday, December 05, 2013 3:45 PM To: Observium Network Observation System Subject: Re: [Observium] Graph Data only displays -nan
No, that is correct.
Some people insist on trying to put them in a user cron file with crontab -e, very common error, hence the big red box!
Adam.
Jason Ross <jross@medicalteams.orgmailto:jross@medicalteams.org> wrote: Not sure if you meant cron jobs instead of from jobs, but it seems like you may have. I followed the instructions: Add cron jobs, create a new file /etc/cron.d/observium with the following contents: Important! Please note that the below example includes a username, so will only work in /etc/crontab or /etc/cron.d/observium. It will NOT work in a user crontab edited with crontab -e. 33 */6 * * * root /opt/observium/discovery.php -h all >> /dev/null 2>&1 */5 * * * * root /opt/observium/discovery.php -h new >> /dev/null 2>&1 */5 * * * * root /opt/observium/poller-wrapper.py 1 >> /dev/null 2>&1 So these cron jobs are in a file I created located at /etc/cron.d/Observium. Do I need to move them? Thanks, Jason
From: observium [mailto:observium-bounces@observium.org] On Behalf Of Adam Armstrong Sent: Thursday, December 05, 2013 3:39 PM To: Observium Network Observation System Subject: Re: [Observium] Graph Data only displays -nan
So where did you put the observium from jobs...?
Adam.
Jason Ross <jross@medicalteams.orgmailto:jross@medicalteams.org> wrote: Sorry it’s a screenshot instead of text…don’t have an easy way to grab files off that server yet. Here is the output. [cid:image001.jpg@01CEF1C1.08821CD0]
From: observium [mailto:observium-bounces@observium.org] On Behalf Of Tom Laermans Sent: Thursday, December 05, 2013 12:59 PM To: Observium Network Observation System Subject: Re: [Observium] Graph Data only displays -nan
Please paste the output of this command: cat /etc/crontab
Thanks, Tom
On 05/12/2013 21:40, Jason Ross wrote: First, I must apologize for yet another question about “graphs not working”. However, I have read everything I can find in the mail archives, in forums, and have reinstalled multiple times following the instructions exactly. Each time with the –nan listed for all data points. Verified permissions on the rrd and tmp folders and both match the same user/group as what everything is running as. I eventually resorted to installing and running everything as root to try and resolve permission errors. Once I figure out what’s wrong I’ll go back to std user. Sorry for the long email, but I wanted to include everything I know so far.
Monitoring Host: Ubuntu 13.04 Observium 13.12.4811 Virtual Machine on Hyper-V
Currently Monitored Devices: 3 HP Procurve Switches 1 Ricoh Copier 2 Sonicwall Firewalls
Testing results thus far:
1. Real-time graphing works for each device.
2. Every other graph is drawn, but has “-nan” for each data point. Same for each device.
3. Prior to installing jpgraph (to get billing to work) all devices did not list traffic data under the Ports tab.
4. Post jpgraph install and config, traffic info under Ports tab works for Ricoh Copier and 1 of 3 HP Procurve switches, but no other devices. Only 0 bps is listed.
5. Enabled rrdcached in the config file with adding $config['rrdcached'] = "unix:/var/run/rrdcached.sock";.
6. Ran discovery and polling for everything again and all devices list stats for traffic under Ports tab.
7. Billing still doesn’t capture traffic data on any device.
8. Billing Accurate Graphs gives an error of 25121 – “Empty input data array specified for plot. Must have at least one data point.” I believe billing errors may be related to the rest.
I ran discovery and polling in debug mode writing to text files and it appears that the data is being pulled from the device correctly. It also looks like it writes the data into the rrd device file and updates the mysql database without showing any errors. Thus, I’m perplexed as to what it could be and have no direction to look into… Help would be appreciated. Thanks, Jason
_______________________________________________
observium mailing list
observium@observium.orgmailto:observium@observium.org
http://postman.memetic.org/cgi-bin/mailman/listinfo/observium
________________________________
observium mailing list observium@observium.orgmailto:observium@observium.org http://postman.memetic.org/cgi-bin/mailman/listinfo/observium
-- Sent from my Android device with K-9 Mail. Please excuse my brevity.
I tried that after reading your earlier post without success. Can’t remember if I did it recursively or not though… I’ll try again since I moved to an earlier snapshot.
For the snmpd.conf file, there should be, literally, nothing in it?
Ubuntu Server 13.04… I’ve seen you reply with that a hundred times Adam, but lots of people have trouble with it so maybe it’s only idiot proof if you are already familiar with linux, php, and apache web servers? I have installed per the directions page at least 4 times and all had the same results. I’ve gone over every instruction, looked it up and made sure I was understanding what I was doing, and still end up with the same results. Even tried 13.10, but that just made things more complicated and I went back to 13.04.
From: observium [mailto:observium-bounces@observium.org] On Behalf Of Josh Hopper Sent: Tuesday, December 17, 2013 1:54 PM To: Observium Network Observation System Subject: Re: [Observium] Graph Data only displays -nan
CHMOD 755 on /opt/observium/rrd and ensure you don’t have anything in your snmpd.conf file.
I had the same issue.
-- Sincerely, Joshua Hopper, A+ CE Network Administrator [http://www.protectplus.com/images/ppluslogo.jpg] 420 3rd Ave NW Hickory NC 28601 Office: 828-449-1839x2160 | Cell: 828-855-7565
From: observiu [mailto:observium-bounces@observium.org] On Behalf Of Jason Ross Sent: Tuesday, December 17, 2013 4:45 PM To: Observium Network Observation System Subject: Re: [Observium] Graph Data only displays -nan
Yes, virtualized using hyper-v, but nothing else is on it. Started with a fresh image of Ubuntu server and went right into the Observium install instructions.
From: observium [mailto:observium-bounces@observium.org] On Behalf Of Adam Armstrong Sent: Tuesday, December 17, 2013 1:16 PM To: Observium Network Observation System Subject: Re: [Observium] Graph Data only displays -nan
Is this a clean server with nothing else on it? Jason Ross <jross@medicalteams.orgmailto:jross@medicalteams.org> wrote: Ok, so I know my graphing issus are permissions related, and I’ve checked the rrd folder permissions / tried adjusting them with solutions given to other people with graphing problems. I’m still unable to get anything other than “-nan” into the graphs. -All graphs write, but no data is displayed. -Realtime graphs display data -Traffic stats is being displayed in the “Ports” tab for my devices.
Install Info: -During last setup/install I enabled root user and installed everything under root. (Was a last ditch effort and I’ll change / redo after I get this working at least once…) -rrd folder has root:root listed with “ls -la” output. (I tried using www-data:ww-data, Observium:root, etc with no success.) -cron jobs (not using e-tab) had user “root” listed exactly like in the install guide. /etc/cron.d/Observium Currently has no user listed, but it made no difference that I can see.
Today I updated to version 4836 and had “no auth” displayed in the device graphs previews, which I hadn’t ever seen before. Seems like it was something that changed from 4811 to 4836 as I hadn’t made any other changes. However, I still only get –nan in the data fields, which furthers my belief that I’m missing something having to do with folder permissions.
Can someone give a list of folders that need to have specific permissions set? And if you’re feeling REALLY generous, maybe even what the permissions should be with knowing that everything was installed using the root user? I’d really love to move past this and start testing Observium! Thanks, Jason
From: observium [mailto:observium-bounces@observium.org] On Behalf Of Jason Ross Sent: Friday, December 06, 2013 10:25 AM To: Observium Network Observation System Subject: Re: [Observium] Graph Data only displays -nan
Any other ideas or things I can check?
From: observium [mailto:observium-bounces@observium.org] On Behalf Of Jason Ross Sent: Thursday, December 05, 2013 3:48 PM To: Observium Network Observation System Subject: Re: [Observium] Graph Data only displays -nan
Ha! Yeah I can at least pick up on the hints. :-)
From: observium [mailto:observium-bounces@observium.org] On Behalf Of Adam Armstrong Sent: Thursday, December 05, 2013 3:45 PM To: Observium Network Observation System Subject: Re: [Observium] Graph Data only displays -nan
No, that is correct.
Some people insist on trying to put them in a user cron file with crontab -e, very common error, hence the big red box!
Adam.
Jason Ross <jross@medicalteams.orgmailto:jross@medicalteams.org> wrote: Not sure if you meant cron jobs instead of from jobs, but it seems like you may have. I followed the instructions: Add cron jobs, create a new file /etc/cron.d/observium with the following contents: Important! Please note that the below example includes a username, so will only work in /etc/crontab or /etc/cron.d/observium. It will NOT work in a user crontab edited with crontab -e. 33 */6 * * * root /opt/observium/discovery.php -h all >> /dev/null 2>&1 */5 * * * * root /opt/observium/discovery.php -h new >> /dev/null 2>&1 */5 * * * * root /opt/observium/poller-wrapper.py 1 >> /dev/null 2>&1 So these cron jobs are in a file I created located at /etc/cron.d/Observium. Do I need to move them? Thanks, Jason
From: observium [mailto:observium-bounces@observium.org] On Behalf Of Adam Armstrong Sent: Thursday, December 05, 2013 3:39 PM To: Observium Network Observation System Subject: Re: [Observium] Graph Data only displays -nan
So where did you put the observium from jobs...?
Adam.
Jason Ross <jross@medicalteams.orgmailto:jross@medicalteams.org> wrote: Sorry it’s a screenshot instead of text…don’t have an easy way to grab files off that server yet. Here is the output. [cid:image001.jpg@01CEF1C1.08821CD0]
From: observium [mailto:observium-bounces@observium.org] On Behalf Of Tom Laermans Sent: Thursday, December 05, 2013 12:59 PM To: Observium Network Observation System Subject: Re: [Observium] Graph Data only displays -nan
Please paste the output of this command: cat /etc/crontab
Thanks, Tom
On 05/12/2013 21:40, Jason Ross wrote: First, I must apologize for yet another question about “graphs not working”. However, I have read everything I can find in the mail archives, in forums, and have reinstalled multiple times following the instructions exactly. Each time with the –nan listed for all data points. Verified permissions on the rrd and tmp folders and both match the same user/group as what everything is running as. I eventually resorted to installing and running everything as root to try and resolve permission errors. Once I figure out what’s wrong I’ll go back to std user. Sorry for the long email, but I wanted to include everything I know so far.
Monitoring Host: Ubuntu 13.04 Observium 13.12.4811 Virtual Machine on Hyper-V
Currently Monitored Devices: 3 HP Procurve Switches 1 Ricoh Copier 2 Sonicwall Firewalls
Testing results thus far:
1. Real-time graphing works for each device.
2. Every other graph is drawn, but has “-nan” for each data point. Same for each device.
3. Prior to installing jpgraph (to get billing to work) all devices did not list traffic data under the Ports tab.
4. Post jpgraph install and config, traffic info under Ports tab works for Ricoh Copier and 1 of 3 HP Procurve switches, but no other devices. Only 0 bps is listed.
5. Enabled rrdcached in the config file with adding $config['rrdcached'] = "unix:/var/run/rrdcached.sock";.
6. Ran discovery and polling for everything again and all devices list stats for traffic under Ports tab.
7. Billing still doesn’t capture traffic data on any device.
8. Billing Accurate Graphs gives an error of 25121 – “Empty input data array specified for plot. Must have at least one data point.” I believe billing errors may be related to the rest.
I ran discovery and polling in debug mode writing to text files and it appears that the data is being pulled from the device correctly. It also looks like it writes the data into the rrd device file and updates the mysql database without showing any errors. Thus, I’m perplexed as to what it could be and have no direction to look into… Help would be appreciated. Thanks, Jason
_______________________________________________
observium mailing list
observium@observium.orgmailto:observium@observium.org
http://postman.memetic.org/cgi-bin/mailman/listinfo/observium
________________________________
observium mailing list observium@observium.orgmailto:observium@observium.org http://postman.memetic.org/cgi-bin/mailman/listinfo/observium
-- Sent from my Android device with K-9 Mail. Please excuse my brevity.
I honestly always use the install guide myself and just copy/paste everything.
If there were any issues with it, we'd get reports fro the 100 of people who install using it every week.
You shouldn't even need to know anything to install it!
Adam.
Jason Ross jross@medicalteams.org wrote:
I tried that after reading your earlier post without success. Can’t remember if I did it recursively or not though… I’ll try again since I moved to an earlier snapshot.
For the snmpd.conf file, there should be, literally, nothing in it?
Ubuntu Server 13.04… I’ve seen you reply with that a hundred times Adam, but lots of people have trouble with it so maybe it’s only idiot proof if you are already familiar with linux, php, and apache web servers? I have installed per the directions page at least 4 times and all had the same results. I’ve gone over every instruction, looked it up and made sure I was understanding what I was doing, and still end up with the same results. Even tried 13.10, but that just made things more complicated and I went back to 13.04.
From: observium [mailto:observium-bounces@observium.org] On Behalf Of Josh Hopper Sent: Tuesday, December 17, 2013 1:54 PM To: Observium Network Observation System Subject: Re: [Observium] Graph Data only displays -nan
CHMOD 755 on /opt/observium/rrd and ensure you don’t have anything in your snmpd.conf file.
I had the same issue.
-- Sincerely, Joshua Hopper, A+ CE Network Administrator [http://www.protectplus.com/images/ppluslogo.jpg] 420 3rd Ave NW Hickory NC 28601 Office: 828-449-1839x2160 | Cell: 828-855-7565
From: observiu [mailto:observium-bounces@observium.org] On Behalf Of Jason Ross Sent: Tuesday, December 17, 2013 4:45 PM To: Observium Network Observation System Subject: Re: [Observium] Graph Data only displays -nan
Yes, virtualized using hyper-v, but nothing else is on it. Started with a fresh image of Ubuntu server and went right into the Observium install instructions.
From: observium [mailto:observium-bounces@observium.org] On Behalf Of Adam Armstrong Sent: Tuesday, December 17, 2013 1:16 PM To: Observium Network Observation System Subject: Re: [Observium] Graph Data only displays -nan
Is this a clean server with nothing else on it? Jason Ross <jross@medicalteams.orgmailto:jross@medicalteams.org> wrote: Ok, so I know my graphing issus are permissions related, and I’ve checked the rrd folder permissions / tried adjusting them with solutions given to other people with graphing problems. I’m still unable to get anything other than “-nan” into the graphs. -All graphs write, but no data is displayed. -Realtime graphs display data -Traffic stats is being displayed in the “Ports” tab for my devices.
Install Info: -During last setup/install I enabled root user and installed everything under root. (Was a last ditch effort and I’ll change / redo after I get this working at least once…) -rrd folder has root:root listed with “ls -la” output. (I tried using www-data:ww-data, Observium:root, etc with no success.) -cron jobs (not using e-tab) had user “root” listed exactly like in the install guide. /etc/cron.d/Observium Currently has no user listed, but it made no difference that I can see.
Today I updated to version 4836 and had “no auth” displayed in the device graphs previews, which I hadn’t ever seen before. Seems like it was something that changed from 4811 to 4836 as I hadn’t made any other changes. However, I still only get –nan in the data fields, which furthers my belief that I’m missing something having to do with folder permissions.
Can someone give a list of folders that need to have specific permissions set? And if you’re feeling REALLY generous, maybe even what the permissions should be with knowing that everything was installed using the root user? I’d really love to move past this and start testing Observium! Thanks, Jason
From: observium [mailto:observium-bounces@observium.org] On Behalf Of Jason Ross Sent: Friday, December 06, 2013 10:25 AM To: Observium Network Observation System Subject: Re: [Observium] Graph Data only displays -nan
Any other ideas or things I can check?
From: observium [mailto:observium-bounces@observium.org] On Behalf Of Jason Ross Sent: Thursday, December 05, 2013 3:48 PM To: Observium Network Observation System Subject: Re: [Observium] Graph Data only displays -nan
Ha! Yeah I can at least pick up on the hints. :-)
From: observium [mailto:observium-bounces@observium.org] On Behalf Of Adam Armstrong Sent: Thursday, December 05, 2013 3:45 PM To: Observium Network Observation System Subject: Re: [Observium] Graph Data only displays -nan
No, that is correct.
Some people insist on trying to put them in a user cron file with crontab -e, very common error, hence the big red box!
Adam.
Jason Ross <jross@medicalteams.orgmailto:jross@medicalteams.org> wrote: Not sure if you meant cron jobs instead of from jobs, but it seems like you may have. I followed the instructions: Add cron jobs, create a new file /etc/cron.d/observium with the following contents: Important! Please note that the below example includes a username, so will only work in /etc/crontab or /etc/cron.d/observium. It will NOT work in a user crontab edited with crontab -e. 33 */6 * * * root /opt/observium/discovery.php -h all >> /dev/null 2>&1 */5 * * * * root /opt/observium/discovery.php -h new >> /dev/null 2>&1 */5 * * * * root /opt/observium/poller-wrapper.py 1 >> /dev/null 2>&1 So these cron jobs are in a file I created located at /etc/cron.d/Observium. Do I need to move them? Thanks, Jason
From: observium [mailto:observium-bounces@observium.org] On Behalf Of Adam Armstrong Sent: Thursday, December 05, 2013 3:39 PM To: Observium Network Observation System Subject: Re: [Observium] Graph Data only displays -nan
So where did you put the observium from jobs...?
Adam.
Jason Ross <jross@medicalteams.orgmailto:jross@medicalteams.org> wrote: Sorry it’s a screenshot instead of text…don’t have an easy way to grab files off that server yet. Here is the output. [cid:image001.jpg@01CEF1C1.08821CD0]
From: observium [mailto:observium-bounces@observium.org] On Behalf Of Tom Laermans Sent: Thursday, December 05, 2013 12:59 PM To: Observium Network Observation System Subject: Re: [Observium] Graph Data only displays -nan
Please paste the output of this command: cat /etc/crontab
Thanks, Tom
On 05/12/2013 21:40, Jason Ross wrote: First, I must apologize for yet another question about “graphs not working”. However, I have read everything I can find in the mail archives, in forums, and have reinstalled multiple times following the instructions exactly. Each time with the –nan listed for all data points. Verified permissions on the rrd and tmp folders and both match the same user/group as what everything is running as. I eventually resorted to installing and running everything as root to try and resolve permission errors. Once I figure out what’s wrong I’ll go back to std user. Sorry for the long email, but I wanted to include everything I know so far.
Monitoring Host: Ubuntu 13.04 Observium 13.12.4811 Virtual Machine on Hyper-V
Currently Monitored Devices: 3 HP Procurve Switches 1 Ricoh Copier 2 Sonicwall Firewalls
Testing results thus far:
Real-time graphing works for each device.Every other graph is drawn, but has “-nan” for each datapoint. Same for each device.
Prior to installing jpgraph (to get billing to work) alldevices did not list traffic data under the Ports tab.
Post jpgraph install and config, traffic info under Ports tabworks for Ricoh Copier and 1 of 3 HP Procurve switches, but no other devices. Only 0 bps is listed.
Enabled rrdcached in the config file with adding$config['rrdcached'] = "unix:/var/run/rrdcached.sock";.
Ran discovery and polling for everything again and all deviceslist stats for traffic under Ports tab.
Billing still doesn’t capture traffic data on any device.Billing Accurate Graphs gives an error of 25121 – “Empty inputdata array specified for plot. Must have at least one data point.” I believe billing errors may be related to the rest.
I ran discovery and polling in debug mode writing to text files and it appears that the data is being pulled from the device correctly. It also looks like it writes the data into the rrd device file and updates the mysql database without showing any errors. Thus, I’m perplexed as to what it could be and have no direction to look into… Help would be appreciated. Thanks, Jason
observium mailing list
observium@observium.orgmailto:observium@observium.org
http://postman.memetic.org/cgi-bin/mailman/listinfo/observium
observium mailing list observium@observium.orgmailto:observium@observium.org http://postman.memetic.org/cgi-bin/mailman/listinfo/observium
-- Sent from my Android device with K-9 Mail. Please excuse my brevity.
observium mailing list observium@observium.org http://postman.memetic.org/cgi-bin/mailman/listinfo/observium
Which version of Ubuntu?
The install guide is copy&paste idiot proof, pretty much!
Adam.
Jason Ross jross@medicalteams.org wrote:
Yes, virtualized using hyper-v, but nothing else is on it. Started with a fresh image of Ubuntu server and went right into the Observium install instructions.
From: observium [mailto:observium-bounces@observium.org] On Behalf Of Adam Armstrong Sent: Tuesday, December 17, 2013 1:16 PM To: Observium Network Observation System Subject: Re: [Observium] Graph Data only displays -nan
Is this a clean server with nothing else on it? Jason Ross <jross@medicalteams.orgmailto:jross@medicalteams.org> wrote: Ok, so I know my graphing issus are permissions related, and I’ve checked the rrd folder permissions / tried adjusting them with solutions given to other people with graphing problems. I’m still unable to get anything other than “-nan” into the graphs. -All graphs write, but no data is displayed. -Realtime graphs display data -Traffic stats is being displayed in the “Ports” tab for my devices.
Install Info: -During last setup/install I enabled root user and installed everything under root. (Was a last ditch effort and I’ll change / redo after I get this working at least once…) -rrd folder has root:root listed with “ls -la” output. (I tried using www-data:ww-data, Observium:root, etc with no success.) -cron jobs (not using e-tab) had user “root” listed exactly like in the install guide. /etc/cron.d/Observium Currently has no user listed, but it made no difference that I can see.
Today I updated to version 4836 and had “no auth” displayed in the device graphs previews, which I hadn’t ever seen before. Seems like it was something that changed from 4811 to 4836 as I hadn’t made any other changes. However, I still only get –nan in the data fields, which furthers my belief that I’m missing something having to do with folder permissions.
Can someone give a list of folders that need to have specific permissions set? And if you’re feeling REALLY generous, maybe even what the permissions should be with knowing that everything was installed using the root user? I’d really love to move past this and start testing Observium! Thanks, Jason
From: observium [mailto:observium-bounces@observium.org] On Behalf Of Jason Ross Sent: Friday, December 06, 2013 10:25 AM To: Observium Network Observation System Subject: Re: [Observium] Graph Data only displays -nan
Any other ideas or things I can check?
From: observium [mailto:observium-bounces@observium.org] On Behalf Of Jason Ross Sent: Thursday, December 05, 2013 3:48 PM To: Observium Network Observation System Subject: Re: [Observium] Graph Data only displays -nan
Ha! Yeah I can at least pick up on the hints. :-)
From: observium [mailto:observium-bounces@observium.org] On Behalf Of Adam Armstrong Sent: Thursday, December 05, 2013 3:45 PM To: Observium Network Observation System Subject: Re: [Observium] Graph Data only displays -nan
No, that is correct.
Some people insist on trying to put them in a user cron file with crontab -e, very common error, hence the big red box!
Adam.
Jason Ross <jross@medicalteams.orgmailto:jross@medicalteams.org> wrote: Not sure if you meant cron jobs instead of from jobs, but it seems like you may have. I followed the instructions: Add cron jobs, create a new file /etc/cron.d/observium with the following contents: Important! Please note that the below example includes a username, so will only work in /etc/crontab or /etc/cron.d/observium. It will NOT work in a user crontab edited with crontab -e. 33 */6 * * * root /opt/observium/discovery.php -h all >> /dev/null 2>&1 */5 * * * * root /opt/observium/discovery.php -h new >> /dev/null 2>&1 */5 * * * * root /opt/observium/poller-wrapper.py 1 >> /dev/null 2>&1 So these cron jobs are in a file I created located at /etc/cron.d/Observium. Do I need to move them? Thanks, Jason
From: observium [mailto:observium-bounces@observium.org] On Behalf Of Adam Armstrong Sent: Thursday, December 05, 2013 3:39 PM To: Observium Network Observation System Subject: Re: [Observium] Graph Data only displays -nan
So where did you put the observium from jobs...?
Adam.
Jason Ross <jross@medicalteams.orgmailto:jross@medicalteams.org> wrote: Sorry it’s a screenshot instead of text…don’t have an easy way to grab files off that server yet. Here is the output. [cid:image001.jpg@01CEF1C1.08821CD0]
From: observium [mailto:observium-bounces@observium.org] On Behalf Of Tom Laermans Sent: Thursday, December 05, 2013 12:59 PM To: Observium Network Observation System Subject: Re: [Observium] Graph Data only displays -nan
Please paste the output of this command: cat /etc/crontab
Thanks, Tom
On 05/12/2013 21:40, Jason Ross wrote: First, I must apologize for yet another question about “graphs not working”. However, I have read everything I can find in the mail archives, in forums, and have reinstalled multiple times following the instructions exactly. Each time with the –nan listed for all data points. Verified permissions on the rrd and tmp folders and both match the same user/group as what everything is running as. I eventually resorted to installing and running everything as root to try and resolve permission errors. Once I figure out what’s wrong I’ll go back to std user. Sorry for the long email, but I wanted to include everything I know so far.
Monitoring Host: Ubuntu 13.04 Observium 13.12.4811 Virtual Machine on Hyper-V
Currently Monitored Devices: 3 HP Procurve Switches 1 Ricoh Copier 2 Sonicwall Firewalls
Testing results thus far:
Real-time graphing works for each device.Every other graph is drawn, but has “-nan” for each datapoint. Same for each device.
Prior to installing jpgraph (to get billing to work) alldevices did not list traffic data under the Ports tab.
Post jpgraph install and config, traffic info under Ports tabworks for Ricoh Copier and 1 of 3 HP Procurve switches, but no other devices. Only 0 bps is listed.
Enabled rrdcached in the config file with adding$config['rrdcached'] = "unix:/var/run/rrdcached.sock";.
Ran discovery and polling for everything again and all deviceslist stats for traffic under Ports tab.
Billing still doesn’t capture traffic data on any device.Billing Accurate Graphs gives an error of 25121 – “Empty inputdata array specified for plot. Must have at least one data point.” I believe billing errors may be related to the rest.
I ran discovery and polling in debug mode writing to text files and it appears that the data is being pulled from the device correctly. It also looks like it writes the data into the rrd device file and updates the mysql database without showing any errors. Thus, I’m perplexed as to what it could be and have no direction to look into… Help would be appreciated. Thanks, Jason
observium mailing list
observium@observium.orgmailto:observium@observium.org
http://postman.memetic.org/cgi-bin/mailman/listinfo/observium
observium mailing list observium@observium.orgmailto:observium@observium.org http://postman.memetic.org/cgi-bin/mailman/listinfo/observium
-- Sent from my Android device with K-9 Mail. Please excuse my brevity.
observium mailing list observium@observium.org http://postman.memetic.org/cgi-bin/mailman/listinfo/observium
Adam, the Community version is now different. You just have to CHMOD the RRD directory. Remove SNMP if it applies (as per the guide). But the CHMOD 755 on RRD wasn’t in the guide.
-- Sincerely, Joshua Hopper, A+ CE Network Administrator [cid:image001.jpg@01CEFB4A.86311B80] 420 3rd Ave NW Hickory NC 28601 Office: 828-449-1839x2160 | Cell: 828-855-7565
From: observium [mailto:observium-bounces@observium.org] On Behalf Of Adam Armstrong Sent: Tuesday, December 17, 2013 5:03 PM To: Observium Network Observation System Subject: Re: [Observium] Graph Data only displays -nan
Which version of Ubuntu?
The install guide is copy&paste idiot proof, pretty much!
Adam. Jason Ross jross@medicalteams.org wrote: Yes, virtualized using hyper-v, but nothing else is on it. Started with a fresh image of Ubuntu server and went right into the Observium install instructions.
From: observium [mailto:observium-bounces@observium.org] On Behalf Of Adam Armstrong Sent: Tuesday, December 17, 2013 1:16 PM To: Observium Network Observation System Subject: Re: [Observium] Graph Data only displays -nan
Is this a clean server with nothing else on it? Jason Ross <jross@medicalteams.orgmailto:jross@medicalteams.org> wrote: Ok, so I know my graphing issus are permissions related, and I’ve checked the rrd folder permissions / tried adjusting them with solutions given to other people with graphing problems. I’m still unable to get anything other than “-nan” into the graphs. -All graphs write, but no data is displayed. -Realtime graphs display data -Traffic stats is being displayed in the “Ports” tab for my devices.
Install Info: -During last setup/install I enabled root user and installed everything under root. (Was a last ditch effort and I’ll change / redo after I get this working at least once…) -rrd folder has root:root listed with “ls -la” output. (I tried using www-data:ww-data, Observium:root, etc with no success.) -cron jobs (not using e-tab) had user “root” listed exactly like in the install guide. /etc/cron.d/Observium Currently has no user listed, but it made no difference that I can see.
Today I updated to version 4836 and had “no auth” displayed in the device graphs previews, which I hadn’t ever seen before. Seems like it was something that changed from 4811 to 4836 as I hadn’t made any other changes. However, I still only get –nan in the data fields, which furthers my belief that I’m missing something having to do with folder permissions.
Can someone give a list of folders that need to have specific permissions set? And if you’re feeling REALLY generous, maybe even what the permissions should be with knowing that everything was installed using the root user? I’d really love to move past this and start testing Observium! Thanks, Jason
From: observium [mailto:observium-bounces@observium.org] On Behalf Of Jason Ross Sent: Friday, December 06, 2013 10:25 AM To: Observium Network Observation System Subject: Re: [Observium] Graph Data only displays -nan
Any other ideas or things I can check?
From: observium [mailto:observium-bounces@observium.org] On Behalf Of Jason Ross Sent: Thursday, December 05, 2013 3:48 PM To: Observium Network Observation System Subject: Re: [Observium] Graph Data only displays -nan
Ha! Yeah I can at least pick up on the hints. :-)
From: observium [mailto:observium-bounces@observium.org] On Behalf Of Adam Armstrong Sent: Thursday, December 05, 2013 3:45 PM To: Observium Network Observation System Subject: Re: [Observium] Graph Data only displays -nan
No, that is correct.
Some people insist on trying to put them in a user cron file with crontab -e, very common error, hence the big red box!
Adam.
Jason Ross <jross@medicalteams.orgmailto:jross@medicalteams.org> wrote: Not sure if you meant cron jobs instead of from jobs, but it seems like you may have. I followed the instructions: Add cron jobs, create a new file /etc/cron.d/observium with the following contents: Important! Please note that the below example includes a username, so will only work in /etc/crontab or /etc/cron.d/observium. It will NOT work in a user crontab edited with crontab -e. 33 */6 * * * root /opt/observium/discovery.php -h all >> /dev/null 2>&1 */5 * * * * root /opt/observium/discovery.php -h new >> /dev/null 2>&1 */5 * * * * root /opt/observium/poller-wrapper.py 1 >> /dev/null 2>&1 So these cron jobs are in a file I created located at /etc/cron.d/Observium. Do I need to move them? Thanks, Jason
From: observium [mailto:observium-bounces@observium.org] On Behalf Of Adam Armstrong Sent: Thursday, December 05, 2013 3:39 PM To: Observium Network Observation System Subject: Re: [Observium] Graph Data only displays -nan
So where did you put the observium from jobs...?
Adam.
Jason Ross <jross@medicalteams.orgmailto:jross@medicalteams.org> wrote: Sorry it’s a screenshot instead of text…don’t have an easy way to grab files off that server yet. Here is the output. [cid:image001.jpg@01CEF1C1.08821CD0]
From: observium [mailto:observium-bounces@observium.org] On Behalf Of Tom Laermans Sent: Thursday, December 05, 2013 12:59 PM To: Observium Network Observation System Subject: Re: [Observium] Graph Data only displays -nan
Please paste the output of this command: cat /etc/crontab
Thanks, Tom
On 05/12/2013 21:40, Jason Ross wrote: First, I must apologize for yet another question about “graphs not working”. However, I have read everything I can find in the mail archives, in forums, and have reinstalled multiple times following the instructions exactly. Each time with the –nan listed for all data points. Verified permissions on the rrd and tmp folders and both match the same user/group as what everything is running as. I eventually resorted to installing and running everything as root to try and resolve permission errors. Once I figure out what’s wrong I’ll go back to std user. Sorry for the long email, but I wanted to include everything I know so far.
Monitoring Host: Ubuntu 13.04 Observium 13.12.4811 Virtual Machine on Hyper-V
Currently Monitored Devices: 3 HP Procurve Switches 1 Ricoh Copier 2 Sonicwall Firewalls
Testing results thus far:
1. Real-time graphing works for each device.
2. Every other graph is drawn, but has “-nan” for each data point. Same for each device.
3. Prior to installing jpgraph (to get billing to work) all devices did not list traffic data under the Ports tab.
4. Post jpgraph install and config, traffic info under Ports tab works for Ricoh Copier and 1 of 3 HP Procurve switches, but no other devices. Only 0 bps is listed.
5. Enabled rrdcached in the config file with adding $config['rrdcached'] = "unix:/var/run/rrdcached.sock";.
6. Ran discovery and polling for everything again and all devices list stats for traffic under Ports tab.
7. Billing still doesn’t capture traffic data on any device.
8. Billing Accurate Graphs gives an error of 25121 – “Empty input data array specified for plot. Must have at least one data point.” I believe billing errors may be related to the rest.
I ran discovery and polling in debug mode writing to text files and it appears that the data is being pulled from the device correctly. It also looks like it writes the data into the rrd device file and updates the mysql database without showing any errors. Thus, I’m perplexed as to what it could be and have no direction to look into… Help would be appreciated. Thanks, Jason
_______________________________________________
observium mailing list
observium@observium.orgmailto:observium@observium.org
http://postman.memetic.org/cgi-bin/mailman/listinfo/observium
________________________________
observium mailing list observium@observium.orgmailto:observium@observium.org http://postman.memetic.org/cgi-bin/mailman/listinfo/observium
-- Sent from my Android device with K-9 Mail. Please excuse my brevity.
He seems to be using svn :)
Adam.
Josh Hopper joshhopper@protectplus.com wrote:
Adam, the Community version is now different. You just have to CHMOD the RRD directory. Remove SNMP if it applies (as per the guide). But the CHMOD 755 on RRD wasn’t in the guide.
-- Sincerely, Joshua Hopper, A+ CE Network Administrator [cid:image001.jpg@01CEFB4A.86311B80] 420 3rd Ave NW Hickory NC 28601 Office: 828-449-1839x2160 | Cell: 828-855-7565
From: observium [mailto:observium-bounces@observium.org] On Behalf Of Adam Armstrong Sent: Tuesday, December 17, 2013 5:03 PM To: Observium Network Observation System Subject: Re: [Observium] Graph Data only displays -nan
Which version of Ubuntu?
The install guide is copy&paste idiot proof, pretty much!
Adam. Jason Ross jross@medicalteams.org wrote: Yes, virtualized using hyper-v, but nothing else is on it. Started with a fresh image of Ubuntu server and went right into the Observium install instructions.
From: observium [mailto:observium-bounces@observium.org] On Behalf Of Adam Armstrong Sent: Tuesday, December 17, 2013 1:16 PM To: Observium Network Observation System Subject: Re: [Observium] Graph Data only displays -nan
Is this a clean server with nothing else on it? Jason Ross <jross@medicalteams.orgmailto:jross@medicalteams.org> wrote: Ok, so I know my graphing issus are permissions related, and I’ve checked the rrd folder permissions / tried adjusting them with solutions given to other people with graphing problems. I’m still unable to get anything other than “-nan” into the graphs. -All graphs write, but no data is displayed. -Realtime graphs display data -Traffic stats is being displayed in the “Ports” tab for my devices.
Install Info: -During last setup/install I enabled root user and installed everything under root. (Was a last ditch effort and I’ll change / redo after I get this working at least once…) -rrd folder has root:root listed with “ls -la” output. (I tried using www-data:ww-data, Observium:root, etc with no success.) -cron jobs (not using e-tab) had user “root” listed exactly like in the install guide. /etc/cron.d/Observium Currently has no user listed, but it made no difference that I can see.
Today I updated to version 4836 and had “no auth” displayed in the device graphs previews, which I hadn’t ever seen before. Seems like it was something that changed from 4811 to 4836 as I hadn’t made any other changes. However, I still only get –nan in the data fields, which furthers my belief that I’m missing something having to do with folder permissions.
Can someone give a list of folders that need to have specific permissions set? And if you’re feeling REALLY generous, maybe even what the permissions should be with knowing that everything was installed using the root user? I’d really love to move past this and start testing Observium! Thanks, Jason
From: observium [mailto:observium-bounces@observium.org] On Behalf Of Jason Ross Sent: Friday, December 06, 2013 10:25 AM To: Observium Network Observation System Subject: Re: [Observium] Graph Data only displays -nan
Any other ideas or things I can check?
From: observium [mailto:observium-bounces@observium.org] On Behalf Of Jason Ross Sent: Thursday, December 05, 2013 3:48 PM To: Observium Network Observation System Subject: Re: [Observium] Graph Data only displays -nan
Ha! Yeah I can at least pick up on the hints. :-)
From: observium [mailto:observium-bounces@observium.org] On Behalf Of Adam Armstrong Sent: Thursday, December 05, 2013 3:45 PM To: Observium Network Observation System Subject: Re: [Observium] Graph Data only displays -nan
No, that is correct.
Some people insist on trying to put them in a user cron file with crontab -e, very common error, hence the big red box!
Adam.
Jason Ross <jross@medicalteams.orgmailto:jross@medicalteams.org> wrote: Not sure if you meant cron jobs instead of from jobs, but it seems like you may have. I followed the instructions: Add cron jobs, create a new file /etc/cron.d/observium with the following contents: Important! Please note that the below example includes a username, so will only work in /etc/crontab or /etc/cron.d/observium. It will NOT work in a user crontab edited with crontab -e. 33 */6 * * * root /opt/observium/discovery.php -h all >> /dev/null 2>&1 */5 * * * * root /opt/observium/discovery.php -h new >> /dev/null 2>&1 */5 * * * * root /opt/observium/poller-wrapper.py 1 >> /dev/null 2>&1 So these cron jobs are in a file I created located at /etc/cron.d/Observium. Do I need to move them? Thanks, Jason
From: observium [mailto:observium-bounces@observium.org] On Behalf Of Adam Armstrong Sent: Thursday, December 05, 2013 3:39 PM To: Observium Network Observation System Subject: Re: [Observium] Graph Data only displays -nan
So where did you put the observium from jobs...?
Adam.
Jason Ross <jross@medicalteams.orgmailto:jross@medicalteams.org> wrote: Sorry it’s a screenshot instead of text…don’t have an easy way to grab files off that server yet. Here is the output. [cid:image001.jpg@01CEF1C1.08821CD0]
From: observium [mailto:observium-bounces@observium.org] On Behalf Of Tom Laermans Sent: Thursday, December 05, 2013 12:59 PM To: Observium Network Observation System Subject: Re: [Observium] Graph Data only displays -nan
Please paste the output of this command: cat /etc/crontab
Thanks, Tom
On 05/12/2013 21:40, Jason Ross wrote: First, I must apologize for yet another question about “graphs not working”. However, I have read everything I can find in the mail archives, in forums, and have reinstalled multiple times following the instructions exactly. Each time with the –nan listed for all data points. Verified permissions on the rrd and tmp folders and both match the same user/group as what everything is running as. I eventually resorted to installing and running everything as root to try and resolve permission errors. Once I figure out what’s wrong I’ll go back to std user. Sorry for the long email, but I wanted to include everything I know so far.
Monitoring Host: Ubuntu 13.04 Observium 13.12.4811 Virtual Machine on Hyper-V
Currently Monitored Devices: 3 HP Procurve Switches 1 Ricoh Copier 2 Sonicwall Firewalls
Testing results thus far:
Real-time graphing works for each device.Every other graph is drawn, but has “-nan” for each datapoint. Same for each device.
Prior to installing jpgraph (to get billing to work) alldevices did not list traffic data under the Ports tab.
Post jpgraph install and config, traffic info under Ports tabworks for Ricoh Copier and 1 of 3 HP Procurve switches, but no other devices. Only 0 bps is listed.
Enabled rrdcached in the config file with adding$config['rrdcached'] = "unix:/var/run/rrdcached.sock";.
Ran discovery and polling for everything again and all deviceslist stats for traffic under Ports tab.
Billing still doesn’t capture traffic data on any device.Billing Accurate Graphs gives an error of 25121 – “Empty inputdata array specified for plot. Must have at least one data point.” I believe billing errors may be related to the rest.
I ran discovery and polling in debug mode writing to text files and it appears that the data is being pulled from the device correctly. It also looks like it writes the data into the rrd device file and updates the mysql database without showing any errors. Thus, I’m perplexed as to what it could be and have no direction to look into… Help would be appreciated. Thanks, Jason
observium mailing list
observium@observium.orgmailto:observium@observium.org
http://postman.memetic.org/cgi-bin/mailman/listinfo/observium
observium mailing list observium@observium.orgmailto:observium@observium.org http://postman.memetic.org/cgi-bin/mailman/listinfo/observium
-- Sent from my Android device with K-9 Mail. Please excuse my brevity.
observium mailing list observium@observium.org http://postman.memetic.org/cgi-bin/mailman/listinfo/observium
Yes, paid subscription. Current version 4836.
From: observium [mailto:observium-bounces@observium.org] On Behalf Of Adam Armstrong Sent: Tuesday, December 17, 2013 2:09 PM To: Observium Network Observation System Subject: Re: [Observium] Graph Data only displays -nan
He seems to be using svn :)
Adam. Josh Hopper <joshhopper@protectplus.commailto:joshhopper@protectplus.com> wrote: Adam, the Community version is now different. You just have to CHMOD the RRD directory. Remove SNMP if it applies (as per the guide). But the CHMOD 755 on RRD wasn’t in the guide.
-- Sincerely, Joshua Hopper, A+ CE Network Administrator [http://www.protectplus.com/images/ppluslogo.jpg] 420 3rd Ave NW Hickory NC 28601 Office: 828-449-1839x2160 | Cell: 828-855-7565
From: observium [mailto:observium-bounces@observium.org] On Behalf Of Adam Armstrong Sent: Tuesday, December 17, 2013 5:03 PM To: Observium Network Observation System Subject: Re: [Observium] Graph Data only displays -nan
Which version of Ubuntu?
The install guide is copy&paste idiot proof, pretty much!
Adam. Jason Ross <jross@medicalteams.orgmailto:jross@medicalteams.org> wrote: Yes, virtualized using hyper-v, but nothing else is on it. Started with a fresh image of Ubuntu server and went right into the Observium install instructions.
From: observium [mailto:observium-bounces@observium.org] On Behalf Of Adam Armstrong Sent: Tuesday, December 17, 2013 1:16 PM To: Observium Network Observation System Subject: Re: [Observium] Graph Data only displays -nan
Is this a clean server with nothing else on it? Jason Ross <jross@medicalteams.orgmailto:jross@medicalteams.org> wrote: Ok, so I know my graphing issus are permissions related, and I’ve checked the rrd folder permissions / tried adjusting them with solutions given to other people with graphing problems. I’m still unable to get anything other than “-nan” into the graphs. -All graphs write, but no data is displayed. -Realtime graphs display data -Traffic stats is being displayed in the “Ports” tab for my devices.
Install Info: -During last setup/install I enabled root user and installed everything under root. (Was a last ditch effort and I’ll change / redo after I get this working at least once…) -rrd folder has root:root listed with “ls -la” output. (I tried using www-data:ww-data, Observium:root, etc with no success.) -cron jobs (not using e-tab) had user “root” listed exactly like in the install guide. /etc/cron.d/Observium Currently has no user listed, but it made no difference that I can see.
Today I updated to version 4836 and had “no auth” displayed in the device graphs previews, which I hadn’t ever seen before. Seems like it was something that changed from 4811 to 4836 as I hadn’t made any other changes. However, I still only get –nan in the data fields, which furthers my belief that I’m missing something having to do with folder permissions.
< span style="color:#1F497D">Can someone give a list of folders that need to have specific permissions set? And if you’re feeling REALLY generous, maybe even what the permissions should be with knowing that everything was installed using the root user? I’d really love to move past this and start testing Observium! Thanks, Jason
From: observium [mailto:observium-bounces@observium.org] On Behalf Of Jason Ross Sent: Friday, December 06, 2013 10:25 AM To: Observium Network Observation System Subject: Re: [Observium] Graph Data only displays -nan
Any other ideas or things I can check?
From: observium [mailto:observium-bounces@observium.org] On Behalf Of Jason Ross Sent: Thursday, December 05, 2013 3:48 PM To: Observium Network Observation System Subject: Re: [Observium] Graph Data only displays -nan
Ha! Yeah I can at least pick up on the hints. :-)
From: observium [mailto:observium-bounces@observium.org] On Behalf Of Adam Armstrong Sent: Thursday, December 05, 2013 3:45 PM To: Observium Network Observation System Subject: Re: [Observium] Graph Data only displays -nan
No, that is correct.
Some people insist on trying to put them in a user cron file with crontab -e, very common error, hence the big red box!
Adam.
Jason Ross <jross@medicalteams.orgmailto:jross@medicalteams.org> wrote: Not sure if you meant cron jobs instead of from jobs, but it seems like you may have. I followed the instructions: Add cron jobs, create a new file /etc/cron.d/observium with the following contents: Important! Please note that the below example includes a username, so will only work in /etc/crontab or /etc/cron.d/observium. It will NOT work in a user crontab edited with crontab -e. 33 */6 * * * root /opt/observium/discovery.php -h all >> /dev/null 2>&1 */5 * * * * root /opt/observium/discovery.php -h new >> /dev/null 2>&1 */5 * * * * root /opt/observium/poller-wrapper.py 1 >> /dev/null 2>&1 So these cron jobs are in a file I created located at /etc/cron.d/Observium. Do I need to move them? Thanks, Jason
From: observium [mailto:observium-bounces@observium.org] On Behalf Of Adam Armstrong Sent: Thursday, December 05, 2013 3:39 PM To: Observium Network Observation System Subject: Re: [Observium] Graph Data only displays -nan
So where did you put the observium from jobs...?
Adam.
Jason Ross <jross@medicalteams.orgmailto:jross@medicalteams.org> wrote: Sorry it’s a screenshot instead of text…don’t have an easy way to grab file s off that server yet. Here is the output. [cid:image001.jpg@01CEF1C1.08821CD0]
From: observium [mailto:observium-bounces@observium.org] On Behalf Of Tom Laermans Sent: Thursday, December 05, 2013 12:59 PM To: Observium Network Observation System Subject: Re: [Observium] Graph Data only displays -nan
Please paste the output of this command: cat /etc/crontab
Thanks, Tom
On 05/12/2013 21:40, Jason Ross wrote: First, I must apologize for yet another question about “graphs not working”. However, I have read everything I can find in the mail archives, in forums, and have reinstalled multiple times following the instructions exactly. Each time with the –nan listed for all data points. Verified permissions on the rrd and tmp folders and both match the same user/group as what everything is running as. I eventually resorted to installing and running everything as root to try and resolve permission errors. Once I figure out what’s wrong I’ll go back to std user. Sorry for the long email, but I wanted to include everything I know so far.
Monitoring Host: Ubuntu 13.04 Observium 13.12.4811 Virtual Machine on Hyper-V
Currently Monitored Devices: 3 HP Procurve Switches 1 Ricoh Copier 2 Sonicwall Firewalls
Testing results thus far:
1. Real-time graphing works for each device.
2. Every other graph is drawn, but has “-nan” for each data point. Same for each device.
3. Prior to installing jpgraph (to get billing to work) all devices did not list traffic data under the Po rts tab.
4. Post jpgraph install and config, traffic info under Ports tab works for Ricoh Copier and 1 of 3 HP Procurve switches, but no other devices. Only 0 bps is listed.
5. Enabled rrdcached in the config file with adding $config['rrdcached'] = "unix:/var/run/rrdcached.sock";.
6. Ran discovery and polling for everything again and all devices list stats for traffic under Ports tab.
7. Billing still doesn’t capture traffic data on any device.
8. Billing Accurate Graphs gives an error of 25121 – “Empty input data array specified for plot. Must have at least one data point.” I believe billing errors may be relate d to the rest.
I ran discovery and polling in debug mode writing to text files and it appears that the data is being pulled from the device correctly. It also looks like it writes the data into the rrd device file and updates the mysql database without showing any errors. Thus, I’m perplexed as to what it could be and have no direction to look into… Help would be appreciated. Thanks, Jason
_______________________________________________
observium mailing list
observium@observium.orgmailto:observium@observium.org
http://postman.memetic.org/cgi-bin/mailman/listinfo/observium
________________________________
observium mailing list observium@observium.orgmailto:observium@observium.org http://postman.memetic.org/cgi-bin/mailman/listinfo/observium
-- Sent from my Android device with K-9 Mail. Please excuse my brevity.
Doh! My mistake. I’ll use it next quarter. I promise.
-- Sincerely, Joshua Hopper, A+ CE Network Administrator [cid:image001.jpg@01CEFB4C.CAAA5590] 420 3rd Ave NW Hickory NC 28601 Office: 828-449-1839x2160 | Cell: 828-855-7565
From: observium [mailto:observium-bounces@observium.org] On Behalf Of Adam Armstrong Sent: Tuesday, December 17, 2013 5:09 PM To: Observium Network Observation System Subject: Re: [Observium] Graph Data only displays -nan
He seems to be using svn :)
Adam. Josh Hopper <joshhopper@protectplus.commailto:joshhopper@protectplus.com> wrote: Adam, the Community version is now different. You just have to CHMOD the RRD directory. Remove SNMP if it applies (as per the guide). But the CHMOD 755 on RRD wasn’t in the guide.
-- Sincerely, Joshua Hopper, A+ CE Network Administrator [cid:image001.jpg@01CEFB4A.86311B80] 420 3rd Ave NW Hickory NC 28601 Office: 828-449-1839x2160 | Cell: 828-855-7565
From: observium [mailto:observium-bounces@observium.org] On Behalf Of Adam Armstrong Sent: Tuesday, December 17, 2013 5:03 PM To: Observium Network Observation System Subject: Re: [Observium] Graph Data only displays -nan
Which version of Ubuntu?
The install guide is copy&paste idiot proof, pretty much!
Adam. Jason Ross <jross@medicalteams.orgmailto:jross@medicalteams.org> wrote: Yes, virtualized using hyper-v, but nothing else is on it. Started with a fresh image of Ubuntu server and went right into the Observium install instructions.
From: observium [mailto:observium-bounces@observium.org] On Behalf Of Adam Armstrong Sent: Tuesday, December 17, 2013 1:16 PM To: Observium Network Observation System Subject: Re: [Observium] Graph Data only displays -nan
Is this a clean server with nothing else on it? Jason Ross <jross@medicalteams.orgmailto:jross@medicalteams.org> wrote: Ok, so I know my graphing issus are permissions related, and I’ve checked the rrd folder permissions / tried adjusting them with solutions given to other people with graphing problems. I’m still unable to get anything other than “-nan” into the graphs. -All graphs write, but no data is displayed. -Realtime graphs display data -Traffic stats is being displayed in the “Ports” tab for my devices.
Install Info: -During last setup/install I enabled root user and installed everything under root. (Was a last ditch effort and I’ll change / redo after I get this working at least once…) -rrd folder has root:root listed with “ls -la” output. (I tried using www-data:ww-data, Observium:root, etc with no success.) -cron jobs (not using e-tab) had user “root” listed exactly like in the install guide. /etc/cron.d/Observium Currently has no user listed, but it made no difference that I can see.
Today I updated to version 4836 and had “no auth” displayed in the device graphs previews, which I hadn’t ever seen before. Seems like it was something that changed from 4811 to 4836 as I hadn’t made any other changes. However, I still only get –nan in the data fields, which furthers my belief that I’m missing something having to do with folder permissions.
Can someone give a list of folders that need to have specific permissions set? And if you’re feeling REALLY generous, maybe even what the permissions should be with knowing that everything was installed using the root user? I’d really love to move past this and start testing Observium! Thanks, Jason
From: observium [mailto:observium-bounces@observium.org] On Behalf Of Jason Ross Sent: Friday, December 06, 2013 10:25 AM To: Observium Network Observation System Subject: Re: [Observium] Graph Data only displays -nan
Any other ideas or things I can check?
From: observium [mailto:observium-bounces@observium.org] On Behalf Of Jason Ross Sent: Thursday, December 05, 2013 3:48 PM To: Observium Network Observation System Subject: Re: [Observium] Graph Data only displays -nan
Ha! Yeah I can at least pick up on the hints. :-)
From: observium [mailto:observium-bounces@observium.org] On Behalf Of Adam Armstrong Sent: Thursday, December 05, 2013 3:45 PM To: Observium Network Observation System Subject: Re: [Observium] Graph Data only displays -nan
No, that is correct.
Some people insist on trying to put them in a user cron file with crontab -e, very common error, hence the big red box!
Adam.
Jason Ross <jross@medicalteams.orgmailto:jross@medicalteams.org> wrote: Not sure if you meant cron jobs instead of from jobs, but it seems like you may have. I followed the instructions: Add cron jobs, create a new file /etc/cron.d/observium with the following contents: Important! Please note that the below example includes a username, so will only work in /etc/crontab or /etc/cron.d/observium. It will NOT work in a user crontab edited with crontab -e. 33 */6 * * * root /opt/observium/discovery.php -h all >> /dev/null 2>&1 */5 * * * * root /opt/observium/discovery.php -h new >> /dev/null 2>&1 */5 * * * * root /opt/observium/poller-wrapper.py 1 >> /dev/null 2>&1 So these cron jobs are in a file I created located at /etc/cron.d/Observium. Do I need to move them? Thanks, Jason
From: observium [mailto:observium-bounces@observium.org] On Behalf Of Adam Armstrong Sent: Thursday, December 05, 2013 3:39 PM To: Observium Network Observation System Subject: Re: [Observium] Graph Data only displays -nan
So where did you put the observium from jobs...?
Adam.
Jason Ross <jross@medicalteams.orgmailto:jross@medicalteams.org> wrote: Sorry it’s a screenshot instead of text…don’t have an easy way to grab files off that server yet. Here is the output. [cid:image001.jpg@01CEF1C1.08821CD0]
From: observium [mailto:observium-bounces@observium.org] On Behalf Of Tom Laermans Sent: Thursday, December 05, 2013 12:59 PM To: Observium Network Observation System Subject: Re: [Observium] Graph Data only displays -nan
Please paste the output of this command: cat /etc/crontab
Thanks, Tom
On 05/12/2013 21:40, Jason Ross wrote: First, I must apologize for yet another question about “graphs not working”. However, I have read everything I can find in the mail archives, in forums, and have reinstalled multiple times following the instructions exactly. Each time with the –nan listed for all data points. Verified permissions on the rrd and tmp folders and both match the same user/group as what everything is running as. I eventually resorted to installing and running everything as root to try and resolve permission errors. Once I figure out what’s wrong I’ll go back to std user. Sorry for the long email, but I wanted to include everything I know so far.
Monitoring Host: Ubuntu 13.04 Observium 13.12.4811 Virtual Machine on Hyper-V
Currently Monitored Devices: 3 HP Procurve Switches 1 Ricoh Copier 2 Sonicwall Firewalls
Testing results thus far:
1. Real-time graphing works for each device.
2. Every other graph is drawn, but has “-nan” for each data point. Same for each device.
3. Prior to installing jpgraph (to get billing to work) all devices did not list traffic data under the Ports tab.
4. Post jpgraph install and config, traffic info under Ports tab works for Ricoh Copier and 1 of 3 HP Procurve switches, but no other devices. Only 0 bps is listed.
5. Enabled rrdcached in the config file with adding $config['rrdcached'] = "unix:/var/run/rrdcached.sock";.
6. Ran discovery and polling for everything again and all devices list stats for traffic under Ports tab.
7. Billing still doesn’t capture traffic data on any device.
8. Billing Accurate Graphs gives an error of 25121 – “Empty input data array specified for plot. Must have at least one data point.” I believe billing errors may be related to the rest.
I ran discovery and polling in debug mode writing to text files and it appears that the data is being pulled from the device correctly. It also looks like it writes the data into the rrd device file and updates the mysql database without showing any errors. Thus, I’m perplexed as to what it could be and have no direction to look into… Help would be appreciated. Thanks, Jason
_______________________________________________
observium mailing list
observium@observium.orgmailto:observium@observium.org
http://postman.memetic.org/cgi-bin/mailman/listinfo/observium
________________________________
observium mailing list observium@observium.orgmailto:observium@observium.org http://postman.memetic.org/cgi-bin/mailman/listinfo/observium
-- Sent from my Android device with K-9 Mail. Please excuse my brevity.
Well, one last attempt before building again using vmware instead of hyper-v so I can copy/paste the install guide… Here is the output of clicking on “Data” for a device’s port. This has traffic bandwidth info displayed in viewing all ports of the device, but again, only has “-nan” for data.
To me it looks like the data it needs I there, but maybe I’m missing something? I also just removed the mysql database, deleted the rrd directory, re-created rrd, chown’d it to www-data:www-data, and recreated the database per the install page, and copied config.php.default over to config.php again. This should be a fresh start for permissions and graphing that we’ve been discussing correct?
From: observium [mailto:observium-bounces@observium.org] On Behalf Of Josh Hopper Sent: Tuesday, December 17, 2013 2:24 PM To: Observium Network Observation System Subject: Re: [Observium] Graph Data only displays -nan
Doh! My mistake. I’ll use it next quarter. I promise.
-- Sincerely, Joshua Hopper, A+ CE Network Administrator [http://www.protectplus.com/images/ppluslogo.jpg] 420 3rd Ave NW Hickory NC 28601 Office: 828-449-1839x2160 | Cell: 828-855-7565
From: observium [mailto:observium-bounces@observium.org] On Behalf Of Adam Armstrong Sent: Tuesday, December 17, 2013 5:09 PM To: Observium Network Observation System Subject: Re: [Observium] Graph Data only displays -nan
He seems to be using svn :)
Adam. Josh Hopper <joshhopper@protectplus.commailto:joshhopper@protectplus.com> wrote: Adam, the Community version is now different. You just have to CHMOD the RRD directory. Remove SNMP if it applies (as per the guide). But the CHMOD 755 on RRD wasn’t in the guide.
-- Sincerely, Joshua Hopper, A+ CE Network Administrator [http://www.protectplus.com/images/ppluslogo.jpg] 420 3rd Ave NW Hickory NC 28601 Office: 828-449-1839x2160 | Cell: 828-855-7565
From: observium [mailto:observium-bounces@observium.org] On Behalf Of Adam Armstrong Sent: Tuesday, December 17, 2013 5:03 PM To: Observium Network Observation System Subject: Re: [Observium] Graph Data only displays -nan
Which version of Ubuntu?
The install guide is copy&paste idiot proof, pretty much!
Adam. Jason Ross <jross@medicalteams.orgmailto:jross@medicalteams.org> wrote: Yes, virtualized using hyper-v, but nothing else is on it. Started with a fresh image of Ubuntu server and went right into the Observium install instructions.
From: observium [mailto:observium-bounces@observium.org] On Behalf Of Adam Armstrong Sent: Tuesday, December 17, 2013 1:16 PM To: Observium Network Observation System Subject: Re: [Observium] Graph Data only displays -nan
Is this a clean server with nothing else on it? Jason Ross <jross@medicalteams.orgmailto:jross@medicalteams.org> wrote: Ok, so I know my graphing issus are permissions related, and I’ve checked the rrd folder permissions / tried adjusting them with solutions given to other people with graphing problems. I’m still unable to get anything other than “-nan” into the graphs. -All graphs write, but no data is displayed. -Realtime graphs display data -Traffic stats is being displayed in the “Ports” tab for my devices.
Install Info: -During last setup/install I enabled root user and installed everything under root. (Was a last ditch effort and I’ll change / redo after I get this working at least once…) -rrd folder has root:root listed with “ls -la” output. (I tried using www-data:ww-data, Observium:root, etc with no success.) -cron jobs (not using e-tab) had user “root” listed exactly like in the install guide. /etc/cron.d/Observium Currently has no user listed, but it made no difference that I can see.
Today I updated to version 4836 and had “no auth” displayed in the device graphs previews, which I hadn’t ever seen before. Seems like it was something that changed from 4811 to 4836 as I hadn’t made any other changes. However, I still only get –nan in the data fields, which furthers my belief that I’m missing something having to do with folder permissions.
Can someone give a list of folders that need to have specific permissions set? And if you’re feeling REALLY generous, maybe even what the permissions should be with knowing that everything was installed using the root user? I’d really love to move past this and start testing Observium! Thanks, Jason
From: observium [mailto:observium-bounces@observium.org] On Behalf Of Jason Ross Sent: Friday, December 06, 2013 10:25 AM To: Observium Network Observation System Subject: Re: [Observium] Graph Data only displays -nan
Any other ideas or things I can check?
From: observium [mailto:observium-bounces@observium.org] On Behalf Of Jason Ross Sent: Thursday, December 05, 2013 3:48 PM To: Observium Network Observation System Subject: Re: [Observium] Graph Data only displays -nan
Ha! Yeah I can at least pick up on the hints. :-)
From: observium [mailto:observium-bounces@observium.org] On Behalf Of Adam Armstrong Sent: Thursday, December 05, 2013 3:45 PM To: Observium Network Observation System Subject: Re: [Observium] Graph Data only displays -nan
No, that is correct.
Some people insist on trying to put them in a user cron file with crontab -e, very common error, hence the big red box!
Adam.
Jason Ross <jross@medicalteams.orgmailto:jross@medicalteams.org> wrote: Not sure if you meant cron jobs instead of from jobs, but it seems like you may have. I followed the instructions: Add cron jobs, create a new file /etc/cron.d/observium with the following contents: Important! Please note that the below example includes a username, so will only work in /etc/crontab or /etc/cron.d/observium. It will NOT work in a user crontab edited with crontab -e. 33 */6 * * * root /opt/observium/discovery.php -h all >> /dev/null 2>&1 */5 * * * * root /opt/observium/discovery.php -h new >> /dev/null 2>&1 */5 * * * * root /opt/observium/poller-wrapper.py 1 >> /dev/null 2>&1 So these cron jobs are in a file I created located at /etc/cron.d/Observium. Do I need to move them? Thanks, Jason
From: observium [mailto:observium-bounces@observium.org] On Behalf Of Adam Armstrong Sent: Thursday, December 05, 2013 3:39 PM To: Observium Network Observation System Subject: Re: [Observium] Graph Data only displays -nan
So where did you put the observium from jobs...?
Adam.
Jason Ross <jross@medicalteams.orgmailto:jross@medicalteams.org> wrote: Sorry it’s a screenshot instead of text…don’t have an easy way to grab files off that server yet. Here is the output. [cid:image001.jpg@01CEF1C1.08821CD0]
From: observium [mailto:observium-bounces@observium.org] On Behalf Of Tom Laermans Sent: Thursday, December 05, 2013 12:59 PM To: Observium Network Observation System Subject: Re: [Observium] Graph Data only displays -nan
Please paste the output of this command: cat /etc/crontab
Thanks, Tom
On 05/12/2013 21:40, Jason Ross wrote: First, I must apologize for yet another question about “graphs not working”. However, I have read everything I can find in the mail archives, in forums, and have reinstalled multiple times following the instructions exactly. Each time with the –nan listed for all data points. Verified permissions on the rrd and tmp folders and both match the same user/group as what everything is running as. I eventually resorted to installing and running everything as root to try and resolve permission errors. Once I figure out what’s wrong I’ll go back to std user. Sorry for the long email, but I wanted to include everything I know so far.
Monitoring Host: Ubuntu 13.04 Observium 13.12.4811 Virtual Machine on Hyper-V
Currently Monitored Devices: 3 HP Procurve Switches 1 Ricoh Copier 2 Sonicwall Firewalls
Testing results thus far:
1. Real-time graphing works for each device.
2. Every other graph is drawn, but has “-nan” for each data point. Same for each device.
3. Prior to installing jpgraph (to get billing to work) all devices did not list traffic data under the Ports tab.
4. Post jpgraph install and config, traffic info under Ports tab works for Ricoh Copier and 1 of 3 HP Procurve switches, but no other devices. Only 0 bps is listed.
5. Enabled rrdcached in the config file with adding $config['rrdcached'] = "unix:/var/run/rrdcached.sock";.
6. Ran discovery and polling for everything again and all devices list stats for traffic under Ports tab.
7. Billing still doesn’t capture traffic data on any device.
8. Billing Accurate Graphs gives an error of 25121 – “Empty input data array specified for plot. Must have at least one data point.” I believe billing errors may be related to the rest.
I ran discovery and polling in debug mode writing to text files and it appears that the data is being pulled from the device correctly. It also looks like it writes the data into the rrd device file and updates the mysql database without showing any errors. Thus, I’m perplexed as to what it could be and have no direction to look into… Help would be appreciated. Thanks, Jason
_______________________________________________
observium mailing list
observium@observium.orgmailto:observium@observium.org
http://postman.memetic.org/cgi-bin/mailman/listinfo/observium
________________________________
observium mailing list observium@observium.orgmailto:observium@observium.org http://postman.memetic.org/cgi-bin/mailman/listinfo/observium
-- Sent from my Android device with K-9 Mail. Please excuse my brevity.
Whoops…sorry. Forgot to paste it in. array(88 port_id => 3 device_id => 1 port_64bit => 1 port_label => port_descr_type => null port_descr_descr => null port_descr_circuit => null port_descr_speed => null port_descr_notes => null ifDescr => 3 ifName => 3 portName => null ifIndex => 3 ifSpeed => 100000000 ifConnectorPresent => true ifPromiscuousMode => true ifHighSpeed => 100 ifOperStatus => up ifAdminStatus => up ifDuplex => fullDuplex ifMtu => 1514 ifType => ethernetCsmacd ifAlias => ifPhysAddress => 00110ae4e7fd ifHardType => null ifLastChange => 2013-12-17 06:38:12 date-8hr America/Los_Angeles (UTC-8) ifVlan => 1 ifTrunk => dot1Q ifVrf => null ignore => 0 disabled => 0 detailed => 0 deleted => 0 pagpOperationMode => null pagpPortState => null pagpPartnerDeviceId => null pagpPartnerLearnMethod => null pagpPartnerIfIndex => null pagpPartnerGroupIfIndex => null pagpPartnerDeviceName => null pagpEthcOperationMode => null pagpDeviceId => null pagpGroupIfIndex => null ifInUcastPkts => 215457373 ifInUcastPkts_delta => 203755 ifInUcastPkts_rate => 217 ifOutUcastPkts => 304943357 ifOutUcastPkts_delta => 291120 ifOutUcastPkts_rate => 310 ifInErrors => 163 ifInErrors_delta => 0 ifInErrors_rate => 0 ifOutErrors => 0 ifOutErrors_delta => 0 ifOutErrors_rate => 0 ifOctets_rate => 384524 ifUcastPkts_rate => 527 ifErrors_rate => 0 ifInOctets => 28916762299 ifInOctets_delta => 27302870 ifInOctets_rate => 29077 ifOutOctets => 353122057304 ifOutOctets_delta => 333765358 ifOutOctets_rate => 355448 ifInOctets_perc => 0 ifOutOctets_perc => 3 poll_time => 1387321711 poll_period => 939 hostname => pdx-sw-dc human_speed => 100Mbps human_type => Ethernet html_class => human_mac => 00:11:0a:e4:e7:fd label => 3 entity_name => 3 entity_shortname => 3 entity_descr => admin_status => enabled table_tab_colour => #194B7F row_class => in_rate => 232616 out_rate => 2843584 bps_in_style => color: #008C00; bps_out_style => color: #394182; pps_in_style => color: #740074; pps_out_style => color: #FF7400; humanized => true graph_type => port_errors
From: Jason Ross Sent: Tuesday, December 17, 2013 3:21 PM To: 'Observium Network Observation System' Subject: RE: [Observium] Graph Data only displays -nan
Well, one last attempt before building again using vmware instead of hyper-v so I can copy/paste the install guide… Here is the output of clicking on “Data” for a device’s port. This has traffic bandwidth info displayed in viewing all ports of the device, but again, only has “-nan” for data.
To me it looks like the data it needs I there, but maybe I’m missing something? I also just removed the mysql database, deleted the rrd directory, re-created rrd, chown’d it to www-data:www-data, and recreated the database per the install page, and copied config.php.default over to config.php again. This should be a fresh start for permissions and graphing that we’ve been discussing correct?
From: observium [mailto:observium-bounces@observium.org] On Behalf Of Josh Hopper Sent: Tuesday, December 17, 2013 2:24 PM To: Observium Network Observation System Subject: Re: [Observium] Graph Data only displays -nan
Doh! My mistake. I’ll use it next quarter. I promise.
-- Sincerely, Joshua Hopper, A+ CE Network Administrator [http://www.protectplus.com/images/ppluslogo.jpg] 420 3rd Ave NW Hickory NC 28601 Office: 828-449-1839x2160 | Cell: 828-855-7565
From: observium [mailto:observium-bounces@observium.org] On Behalf Of Adam Armstrong Sent: Tuesday, December 17, 2013 5:09 PM To: Observium Network Observation System Subject: Re: [Observium] Graph Data only displays -nan
He seems to be using svn :)
Adam. Josh Hopper <joshhopper@protectplus.commailto:joshhopper@protectplus.com> wrote: Adam, the Community version is now different. You just have to CHMOD the RRD directory. Remove SNMP if it applies (as per the guide). But the CHMOD 755 on RRD wasn’t in the guide.
-- Sincerely, Joshua Hopper, A+ CE Network Administrator [http://www.protectplus.com/images/ppluslogo.jpg] 420 3rd Ave NW Hickory NC 28601 Office: 828-449-1839x2160 | Cell: 828-855-7565
From: observium [mailto:observium-bounces@observium.org] On Behalf Of Adam Armstrong Sent: Tuesday, December 17, 2013 5:03 PM To: Observium Network Observation System Subject: Re: [Observium] Graph Data only displays -nan
Which version of Ubuntu?
The install guide is copy&paste idiot proof, pretty much!
Adam. Jason Ross <jross@medicalteams.orgmailto:jross@medicalteams.org> wrote: Yes, virtualized using hyper-v, but nothing else is on it. Started with a fresh image of Ubuntu server and went right into the Observium install instructions.
From: observium [mailto:observium-bounces@observium.org] On Behalf Of Adam Armstrong Sent: Tuesday, December 17, 2013 1:16 PM To: Observium Network Observation System Subject: Re: [Observium] Graph Data only displays -nan
Is this a clean server with nothing else on it? Jason Ross <jross@medicalteams.orgmailto:jross@medicalteams.org> wrote: Ok, so I know my graphing issus are permissions related, and I’ve checked the rrd folder permissions / tried adjusting them with solutions given to other people with graphing problems. I’m still unable to get anything other than “-nan” into the graphs. -All graphs write, but no data is displayed. -Realtime graphs display data -Traffic stats is being displayed in the “Ports” tab for my devices.
Install Info: -During last setup/install I enabled root user and installed everything under root. (Was a last ditch effort and I’ll change / redo after I get this working at least once…) -rrd folder has root:root listed with “ls -la” output. (I tried using www-data:ww-data, Observium:root, etc with no success.) -cron jobs (not using e-tab) had user “root” listed exactly like in the install guide. /etc/cron.d/Observium Currently has no user listed, but it made no difference that I can see.
Today I updated to version 4836 and had “no auth” displayed in the device graphs previews, which I hadn’t ever seen before. Seems like it was something that changed from 4811 to 4836 as I hadn’t made any other changes. However, I still only get –nan in the data fields, which furthers my belief that I’m missing something having to do with folder permissions.
Can someone give a list of folders that need to have specific permissions set? And if you’re feeling REALLY generous, maybe even what the permissions should be with knowing that everything was installed using the root user? I’d really love to move past this and start testing Observium! Thanks, Jason
From: observium [mailto:observium-bounces@observium.org] On Behalf Of Jason Ross Sent: Friday, December 06, 2013 10:25 AM To: Observium Network Observation System Subject: Re: [Observium] Graph Data only displays -nan
Any other ideas or things I can check?
From: observium [mailto:observium-bounces@observium.org] On Behalf Of Jason Ross Sent: Thursday, December 05, 2013 3:48 PM To: Observium Network Observation System Subject: Re: [Observium] Graph Data only displays -nan
Ha! Yeah I can at least pick up on the hints. :-)
From: observium [mailto:observium-bounces@observium.org] On Behalf Of Adam Armstrong Sent: Thursday, December 05, 2013 3:45 PM To: Observium Network Observation System Subject: Re: [Observium] Graph Data only displays -nan
No, that is correct.
Some people insist on trying to put them in a user cron file with crontab -e, very common error, hence the big red box!
Adam.
Jason Ross <jross@medicalteams.orgmailto:jross@medicalteams.org> wrote: Not sure if you meant cron jobs instead of from jobs, but it seems like you may have. I followed the instructions: Add cron jobs, create a new file /etc/cron.d/observium with the following contents: Important! Please note that the below example includes a username, so will only work in /etc/crontab or /etc/cron.d/observium. It will NOT work in a user crontab edited with crontab -e. 33 */6 * * * root /opt/observium/discovery.php -h all >> /dev/null 2>&1 */5 * * * * root /opt/observium/discovery.php -h new >> /dev/null 2>&1 */5 * * * * root /opt/observium/poller-wrapper.py 1 >> /dev/null 2>&1 So these cron jobs are in a file I created located at /etc/cron.d/Observium. Do I need to move them? Thanks, Jason
From: observium [mailto:observium-bounces@observium.org] On Behalf Of Adam Armstrong Sent: Thursday, December 05, 2013 3:39 PM To: Observium Network Observation System Subject: Re: [Observium] Graph Data only displays -nan
So where did you put the observium from jobs...?
Adam.
Jason Ross <jross@medicalteams.orgmailto:jross@medicalteams.org> wrote: Sorry it’s a screenshot instead of text…don’t have an easy way to grab files off that server yet. Here is the output. [cid:image001.jpg@01CEF1C1.08821CD0]
From: observium [mailto:observium-bounces@observium.org] On Behalf Of Tom Laermans Sent: Thursday, December 05, 2013 12:59 PM To: Observium Network Observation System Subject: Re: [Observium] Graph Data only displays -nan
Please paste the output of this command: cat /etc/crontab
Thanks, Tom
On 05/12/2013 21:40, Jason Ross wrote: First, I must apologize for yet another question about “graphs not working”. However, I have read everything I can find in the mail archives, in forums, and have reinstalled multiple times following the instructions exactly. Each time with the –nan listed for all data points. Verified permissions on the rrd and tmp folders and both match the same user/group as what everything is running as. I eventually resorted to installing and running everything as root to try and resolve permission errors. Once I figure out what’s wrong I’ll go back to std user. Sorry for the long email, but I wanted to include everything I know so far.
Monitoring Host: Ubuntu 13.04 Observium 13.12.4811 Virtual Machine on Hyper-V
Currently Monitored Devices: 3 HP Procurve Switches 1 Ricoh Copier 2 Sonicwall Firewalls
Testing results thus far:
1. Real-time graphing works for each device.
2. Every other graph is drawn, but has “-nan” for each data point. Same for each device.
3. Prior to installing jpgraph (to get billing to work) all devices did not list traffic data under the Ports tab.
4. Post jpgraph install and config, traffic info under Ports tab works for Ricoh Copier and 1 of 3 HP Procurve switches, but no other devices. Only 0 bps is listed.
5. Enabled rrdcached in the config file with adding $config['rrdcached'] = "unix:/var/run/rrdcached.sock";.
6. Ran discovery and polling for everything again and all devices list stats for traffic under Ports tab.
7. Billing still doesn’t capture traffic data on any device.
8. Billing Accurate Graphs gives an error of 25121 – “Empty input data array specified for plot. Must have at least one data point.” I believe billing errors may be related to the rest.
I ran discovery and polling in debug mode writing to text files and it appears that the data is being pulled from the device correctly. It also looks like it writes the data into the rrd device file and updates the mysql database without showing any errors. Thus, I’m perplexed as to what it could be and have no direction to look into… Help would be appreciated. Thanks, Jason
_______________________________________________
observium mailing list
observium@observium.orgmailto:observium@observium.org
http://postman.memetic.org/cgi-bin/mailman/listinfo/observium
________________________________
observium mailing list observium@observium.orgmailto:observium@observium.org http://postman.memetic.org/cgi-bin/mailman/listinfo/observium
-- Sent from my Android device with K-9 Mail. Please excuse my brevity.
Well, it seems to definitely be correctly updating and running the poller.
If your RRDs are being created, then there are no permissions issues (poller runs as root anyways). I really can't see why it's not working, unless your crontab entries are not being run.
If you want to give me access to the server, I can fix and tell everyone what you did wrong! ;P
adam.
On 2013-12-17 23:21, Jason Ross wrote:
Whoops…sorry. Forgot to paste it in.
array(88
port_id => 3
device_id => 1
port_64bit => 1
port_label =>
port_descr_type => null
port_descr_descr => null
port_descr_circuit => null
port_descr_speed => null
port_descr_notes => null
ifDescr => 3
ifName => 3
portName => null
ifIndex => 3
ifSpeed => 100000000
ifConnectorPresent => true
ifPromiscuousMode => true
ifHighSpeed => 100
ifOperStatus => up
ifAdminStatus => up
ifDuplex => fullDuplex
ifMtu => 1514
ifType => ethernetCsmacd
ifAlias =>
ifPhysAddress => 00110ae4e7fd
ifHardType => null
ifLastChange => 2013-12-17 06:38:12
date-8hr America/Los_Angeles (UTC-8)
ifVlan => 1
ifTrunk => dot1Q
ifVrf => null
ignore => 0
disabled => 0
detailed => 0
deleted => 0
pagpOperationMode => null
pagpPortState => null
pagpPartnerDeviceId => null
pagpPartnerLearnMethod => null
pagpPartnerIfIndex => null
pagpPartnerGroupIfIndex => null
pagpPartnerDeviceName => null
pagpEthcOperationMode => null
pagpDeviceId => null
pagpGroupIfIndex => null
ifInUcastPkts => 215457373
ifInUcastPkts_delta => 203755
ifInUcastPkts_rate => 217
ifOutUcastPkts => 304943357
ifOutUcastPkts_delta => 291120
ifOutUcastPkts_rate => 310
ifInErrors => 163
ifInErrors_delta => 0
ifInErrors_rate => 0
ifOutErrors => 0
ifOutErrors_delta => 0
ifOutErrors_rate => 0
ifOctets_rate => 384524
ifUcastPkts_rate => 527
ifErrors_rate => 0
ifInOctets => 28916762299
ifInOctets_delta => 27302870
ifInOctets_rate => 29077
ifOutOctets => 353122057304
ifOutOctets_delta => 333765358
ifOutOctets_rate => 355448
ifInOctets_perc => 0
ifOutOctets_perc => 3
poll_time => 1387321711
poll_period => 939
hostname => pdx-sw-dc
human_speed => 100Mbps
human_type => Ethernet
html_class =>
human_mac => 00:11:0a:e4:e7:fd
label => 3
entity_name => 3
entity_shortname => 3
entity_descr =>
admin_status => enabled
table_tab_colour => #194B7F
row_class =>
in_rate => 232616
out_rate => 2843584
bps_in_style => color: #008C00;
bps_out_style => color: #394182;
pps_in_style => color: #740074;
pps_out_style => color: #FF7400;
humanized => true
graph_type => port_errors
FROM: Jason Ross SENT: Tuesday, December 17, 2013 3:21 PM TO: 'Observium Network Observation System' SUBJECT: RE: [Observium] Graph Data only displays -nan
Well, one last attempt before building again using vmware instead of hyper-v so I can copy/paste the install guide… Here is the output of clicking on “Data” for a device’s port. This has traffic bandwidth info displayed in viewing all ports of the device, but again, only has “-nan” for data.
To me it looks like the data it needs I there, but maybe I’m missing something? I also just removed the mysql database, deleted the rrd directory, re-created rrd, chown’d it to www-data:www-data, and recreated the database per the install page, and copied config.php.default over to config.php again. This should be a fresh start for permissions and graphing that we’ve been discussing correct?
FROM: observium [mailto:observium-bounces@observium.org] ON BEHALF OF Josh Hopper SENT: Tuesday, December 17, 2013 2:24 PM TO: Observium Network Observation System SUBJECT: Re: [Observium] Graph Data only displays -nan
Doh! My mistake. I’ll use it next quarter. I promise.
--
Sincerely,
Joshua Hopper, A+ CE
_Network Administrator_
420 3rd Ave NW Hickory NC 28601
Office: 828-449-1839x2160 | Cell: 828-855-7565
FROM: observium [mailto:observium-bounces@observium.org] ON BEHALF OF Adam Armstrong SENT: Tuesday, December 17, 2013 5:09 PM TO: Observium Network Observation System SUBJECT: Re: [Observium] Graph Data only displays -nan
He seems to be using svn :)
Adam.
Josh Hopper joshhopper@protectplus.com wrote:
Adam, the Community version is now different. You just have to CHMOD the RRD directory.
Remove SNMP if it applies (as per the guide). But the CHMOD 755 on RRD wasn’t in the guide.
--
Sincerely,
Joshua Hopper, A+ CE
_Network Administrator_
420 3rd Ave NW Hickory NC 28601
Office: 828-449-1839x2160 | Cell: 828-855-7565
FROM: observium [mailto:observium-bounces@observium.org] ON BEHALF OF Adam Armstrong SENT: Tuesday, December 17, 2013 5:03 PM TO: Observium Network Observation System SUBJECT: Re: [Observium] Graph Data only displays -nan
Which version of Ubuntu?
The install guide is copy&paste idiot proof, pretty much!
Adam.
Jason Ross jross@medicalteams.org wrote:
Yes, virtualized using hyper-v, but nothing else is on it. Started with a fresh image of Ubuntu server and went right into the Observium install instructions.
FROM: observium [mailto:observium-bounces@observium.org] ON BEHALF OF Adam Armstrong SENT: Tuesday, December 17, 2013 1:16 PM TO: Observium Network Observation System SUBJECT: Re: [Observium] Graph Data only displays -nan
Is this a clean server with nothing else on it?
Jason Ross jross@medicalteams.org wrote:
Ok, so I know my graphing issus are permissions related, and I’ve checked the rrd folder permissions / tried adjusting them with solutions given to other people with graphing problems. I’m still unable to get anything other than “-nan” into the graphs.
-All graphs write, but no data is displayed.
-Realtime graphs display data
-Traffic stats is being displayed in the “Ports” tab for my devices.
Install Info:
-During last setup/install I enabled root user and installed everything under root. (Was a last ditch effort and I’ll change / redo after I get this working at least once…)
-rrd folder has root:root listed with “ls -la” output. (I tried using www-data:ww-data, Observium:root, etc with no success.)
-cron jobs (not using e-tab) had user “root” listed exactly like in the install guide. /etc/cron.d/Observium Currently has no user listed, but it made no difference that I can see.
Today I updated to version 4836 and had “no auth” displayed in the device graphs previews, which I hadn’t ever seen before. Seems like it was something that changed from 4811 to 4836 as I hadn’t made any other changes. However, I still only get –nan in the data fields, which furthers my belief that I’m missing something having to do with folder permissions.
Can someone give a list of folders that need to have specific permissions set? And if you’re feeling REALLY generous, maybe even what the permissions should be with knowing that everything was installed using the root user? I’d really love to move past this and start testing Observium!
Thanks, Jason
FROM: observium [mailto:observium-bounces@observium.org] ON BEHALF OF Jason Ross SENT: Friday, December 06, 2013 10:25 AM TO: Observium Network Observation System SUBJECT: Re: [Observium] Graph Data only displays -nan
Any other ideas or things I can check?
FROM: observium [mailto:observium-bounces@observium.org] ON BEHALF OF Jason Ross SENT: Thursday, December 05, 2013 3:48 PM TO: Observium Network Observation System SUBJECT: Re: [Observium] Graph Data only displays -nan
Ha! Yeah I can at least pick up on the hints. :-)
FROM: observium [mailto:observium-bounces@observium.org] ON BEHALF OF Adam Armstrong SENT: Thursday, December 05, 2013 3:45 PM TO: Observium Network Observation System SUBJECT: Re: [Observium] Graph Data only displays -nan
No, that is correct.
Some people insist on trying to put them in a user cron file with crontab -e, very common error, hence the big red box!
Adam.
Jason Ross jross@medicalteams.org wrote:
Not sure if you meant cron jobs instead of from jobs, but it seems like you may have. I followed the instructions:
Add cron jobs, create a new file /etc/cron.d/observium with the following contents:
IMPORTANT!
Please note that the below example includes a username, so will only work in /etc/crontab or /etc/cron.d/observium. It will NOT work in a user crontab edited with crontab -e.
33 */6 * * * root /opt/observium/discovery.php -h all >> /dev/null 2>&1
*/5 * * * * root /opt/observium/discovery.php -h new >> /dev/null 2>&1
*/5 * * * * root /opt/observium/poller-wrapper.py 1 >> /dev/null 2>&1
So these cron jobs are in a file I created located at /etc/cron.d/Observium. Do I need to move them?
Thanks, Jason
FROM: observium [mailto:observium-bounces@observium.org] ON BEHALF OF Adam Armstrong SENT: Thursday, December 05, 2013 3:39 PM TO: Observium Network Observation System SUBJECT: Re: [Observium] Graph Data only displays -nan
So where did you put the observium from jobs...?
Adam.
Jason Ross jross@medicalteams.org wrote:
Sorry it’s a screenshot instead of text…don’t have an easy way to grab files off that server yet. Here is the output.
FROM: observium [mailto:observium-bounces@observium.org] ON BEHALF OF Tom Laermans SENT: Thursday, December 05, 2013 12:59 PM TO: Observium Network Observation System SUBJECT: Re: [Observium] Graph Data only displays -nan
Please paste the output of this command: cat /etc/crontab
Thanks, Tom
On 05/12/2013 21:40, Jason Ross wrote:
First, I must apologize for yet another question about “graphs not working”. However, I have read everything I can find in the mail archives, in forums, and have reinstalled multiple times following the instructions exactly. Each time with the –nan listed for all data points. Verified permissions on the rrd and tmp folders and both match the same user/group as what everything is running as. I eventually resorted to installing and running everything as root to try and resolve permission errors. Once I figure out what’s wrong I’ll go back to std user. Sorry for the long email, but I wanted to include everything I know so far.
Monitoring Host:
Ubuntu 13.04
Observium 13.12.4811
Virtual Machine on Hyper-V
Currently Monitored Devices:
3 HP Procurve Switches
1 Ricoh Copier
2 Sonicwall Firewalls
Testing results thus far:
Real-time graphing works for each device.
Every other graph is drawn, but has “-nan” for each data point. Same
for each device.
- Prior to installing jpgraph (to get billing to work) all devices did
not list traffic data under the Ports tab.
- Post jpgraph install and config, traffic info under Ports tab works
for Ricoh Copier and 1 of 3 HP Procurve switches, but no other devices. Only 0 bps is listed.
- Enabled rrdcached in the config file with adding
$config['rrdcached'] = "unix:/var/run/rrdcached.sock";.
- Ran discovery and polling for everything again and all devices list
stats for traffic under Ports tab.
Billing still doesn’t capture traffic data on any device.
Billing Accurate Graphs gives an error of 25121 – “Empty input data
array specified for plot. Must have at least one data point.”
I believe billing errors may be related to the rest.
I ran discovery and polling in debug mode writing to text files and it appears that the data is being pulled from the device correctly. It also looks like it writes the data into the rrd device file and updates the mysql database without showing any errors. Thus, I’m perplexed as to what it could be and have no direction to look into… Help would be appreciated.
Thanks, Jason
observium mailing list
observium@observium.org
http://postman.memetic.org/cgi-bin/mailman/listinfo/observium [1]
observium mailing list observium@observium.org http://postman.memetic.org/cgi-bin/mailman/listinfo/observium [1]
-- Sent from my Android device with K-9 Mail. Please excuse my brevity.
Links:
[1] http://postman.memetic.org/cgi-bin/mailman/listinfo/observium
observium mailing list observium@observium.org http://postman.memetic.org/cgi-bin/mailman/listinfo/observium
Deal! :-) Well at least I'm not the only one that is stumpted... I'll recreate again and see what happens. Thanks Adam, Jason
-----Original Message----- From: observium [mailto:observium-bounces@observium.org] On Behalf Of Adam Armstrong Sent: Tuesday, December 17, 2013 3:30 PM To: Observium Network Observation System Subject: Re: [Observium] Graph Data only displays -nan
Well, it seems to definitely be correctly updating and running the poller.
If your RRDs are being created, then there are no permissions issues (poller runs as root anyways). I really can't see why it's not working, unless your crontab entries are not being run.
If you want to give me access to the server, I can fix and tell everyone what you did wrong! ;P
adam.
On 2013-12-17 23:21, Jason Ross wrote:
Whoops…sorry. Forgot to paste it in.
array(88
port_id => 3
device_id => 1
port_64bit => 1
port_label =>
port_descr_type => null
port_descr_descr => null
port_descr_circuit => null
port_descr_speed => null
port_descr_notes => null
ifDescr => 3
ifName => 3
portName => null
ifIndex => 3
ifSpeed => 100000000
ifConnectorPresent => true
ifPromiscuousMode => true
ifHighSpeed => 100
ifOperStatus => up
ifAdminStatus => up
ifDuplex => fullDuplex
ifMtu => 1514
ifType => ethernetCsmacd
ifAlias =>
ifPhysAddress => 00110ae4e7fd
ifHardType => null
ifLastChange => 2013-12-17 06:38:12
date-8hr America/Los_Angeles (UTC-8)
ifVlan => 1
ifTrunk => dot1Q
ifVrf => null
ignore => 0
disabled => 0
detailed => 0
deleted => 0
pagpOperationMode => null
pagpPortState => null
pagpPartnerDeviceId => null
pagpPartnerLearnMethod => null
pagpPartnerIfIndex => null
pagpPartnerGroupIfIndex => null
pagpPartnerDeviceName => null
pagpEthcOperationMode => null
pagpDeviceId => null
pagpGroupIfIndex => null
ifInUcastPkts => 215457373
ifInUcastPkts_delta => 203755
ifInUcastPkts_rate => 217
ifOutUcastPkts => 304943357
ifOutUcastPkts_delta => 291120
ifOutUcastPkts_rate => 310
ifInErrors => 163
ifInErrors_delta => 0
ifInErrors_rate => 0
ifOutErrors => 0
ifOutErrors_delta => 0
ifOutErrors_rate => 0
ifOctets_rate => 384524
ifUcastPkts_rate => 527
ifErrors_rate => 0
ifInOctets => 28916762299
ifInOctets_delta => 27302870
ifInOctets_rate => 29077
ifOutOctets => 353122057304
ifOutOctets_delta => 333765358
ifOutOctets_rate => 355448
ifInOctets_perc => 0
ifOutOctets_perc => 3
poll_time => 1387321711
poll_period => 939
hostname => pdx-sw-dc
human_speed => 100Mbps
human_type => Ethernet
html_class =>
human_mac => 00:11:0a:e4:e7:fd
label => 3
entity_name => 3
entity_shortname => 3
entity_descr =>
admin_status => enabled
table_tab_colour => #194B7F
row_class =>
in_rate => 232616
out_rate => 2843584
bps_in_style => color: #008C00;
bps_out_style => color: #394182;
pps_in_style => color: #740074;
pps_out_style => color: #FF7400;
humanized => true
graph_type => port_errors
FROM: Jason Ross SENT: Tuesday, December 17, 2013 3:21 PM TO: 'Observium Network Observation System' SUBJECT: RE: [Observium] Graph Data only displays -nan
Well, one last attempt before building again using vmware instead of hyper-v so I can copy/paste the install guide… Here is the output of clicking on “Data” for a device’s port. This has traffic bandwidth info displayed in viewing all ports of the device, but again, only has “-nan” for data.
To me it looks like the data it needs I there, but maybe I’m missing something? I also just removed the mysql database, deleted the rrd directory, re-created rrd, chown’d it to www-data:www-data, and recreated the database per the install page, and copied config.php.default over to config.php again. This should be a fresh start for permissions and graphing that we’ve been discussing correct?
FROM: observium [mailto:observium-bounces@observium.org] ON BEHALF OF Josh Hopper SENT: Tuesday, December 17, 2013 2:24 PM TO: Observium Network Observation System SUBJECT: Re: [Observium] Graph Data only displays -nan
Doh! My mistake. I’ll use it next quarter. I promise.
--
Sincerely,
Joshua Hopper, A+ CE
_Network Administrator_
420 3rd Ave NW Hickory NC 28601
Office: 828-449-1839x2160 | Cell: 828-855-7565
FROM: observium [mailto:observium-bounces@observium.org] ON BEHALF OF Adam Armstrong SENT: Tuesday, December 17, 2013 5:09 PM TO: Observium Network Observation System SUBJECT: Re: [Observium] Graph Data only displays -nan
He seems to be using svn :)
Adam.
Josh Hopper joshhopper@protectplus.com wrote:
Adam, the Community version is now different. You just have to CHMOD the RRD directory.
Remove SNMP if it applies (as per the guide). But the CHMOD 755 on RRD wasn’t in the guide.
--
Sincerely,
Joshua Hopper, A+ CE
_Network Administrator_
420 3rd Ave NW Hickory NC 28601
Office: 828-449-1839x2160 | Cell: 828-855-7565
FROM: observium [mailto:observium-bounces@observium.org] ON BEHALF OF Adam Armstrong SENT: Tuesday, December 17, 2013 5:03 PM TO: Observium Network Observation System SUBJECT: Re: [Observium] Graph Data only displays -nan
Which version of Ubuntu?
The install guide is copy&paste idiot proof, pretty much!
Adam.
Jason Ross jross@medicalteams.org wrote:
Yes, virtualized using hyper-v, but nothing else is on it. Started with a fresh image of Ubuntu server and went right into the Observium install instructions.
FROM: observium [mailto:observium-bounces@observium.org] ON BEHALF OF Adam Armstrong SENT: Tuesday, December 17, 2013 1:16 PM TO: Observium Network Observation System SUBJECT: Re: [Observium] Graph Data only displays -nan
Is this a clean server with nothing else on it?
Jason Ross jross@medicalteams.org wrote:
Ok, so I know my graphing issus are permissions related, and I’ve checked the rrd folder permissions / tried adjusting them with solutions given to other people with graphing problems. I’m still unable to get anything other than “-nan” into the graphs.
-All graphs write, but no data is displayed.
-Realtime graphs display data
-Traffic stats is being displayed in the “Ports” tab for my devices.
Install Info:
-During last setup/install I enabled root user and installed everything under root. (Was a last ditch effort and I’ll change / redo after I get this working at least once…)
-rrd folder has root:root listed with “ls -la” output. (I tried using www-data:ww-data, Observium:root, etc with no success.)
-cron jobs (not using e-tab) had user “root” listed exactly like in the install guide. /etc/cron.d/Observium Currently has no user listed, but it made no difference that I can see.
Today I updated to version 4836 and had “no auth” displayed in the device graphs previews, which I hadn’t ever seen before. Seems like it was something that changed from 4811 to 4836 as I hadn’t made any other changes. However, I still only get –nan in the data fields, which furthers my belief that I’m missing something having to do with folder permissions.
Can someone give a list of folders that need to have specific permissions set? And if you’re feeling REALLY generous, maybe even what the permissions should be with knowing that everything was installed using the root user? I’d really love to move past this and start testing Observium!
Thanks, Jason
FROM: observium [mailto:observium-bounces@observium.org] ON BEHALF OF Jason Ross SENT: Friday, December 06, 2013 10:25 AM TO: Observium Network Observation System SUBJECT: Re: [Observium] Graph Data only displays -nan
Any other ideas or things I can check?
FROM: observium [mailto:observium-bounces@observium.org] ON BEHALF OF Jason Ross SENT: Thursday, December 05, 2013 3:48 PM TO: Observium Network Observation System SUBJECT: Re: [Observium] Graph Data only displays -nan
Ha! Yeah I can at least pick up on the hints. :-)
FROM: observium [mailto:observium-bounces@observium.org] ON BEHALF OF Adam Armstrong SENT: Thursday, December 05, 2013 3:45 PM TO: Observium Network Observation System SUBJECT: Re: [Observium] Graph Data only displays -nan
No, that is correct.
Some people insist on trying to put them in a user cron file with crontab -e, very common error, hence the big red box!
Adam.
Jason Ross jross@medicalteams.org wrote:
Not sure if you meant cron jobs instead of from jobs, but it seems like you may have. I followed the instructions:
Add cron jobs, create a new file /etc/cron.d/observium with the following contents:
IMPORTANT!
Please note that the below example includes a username, so will only work in /etc/crontab or /etc/cron.d/observium. It will NOT work in a user crontab edited with crontab -e.
33 */6 * * * root /opt/observium/discovery.php -h all >> /dev/null 2>&1
*/5 * * * * root /opt/observium/discovery.php -h new >> /dev/null 2>&1
*/5 * * * * root /opt/observium/poller-wrapper.py 1 >> /dev/null 2>&1
So these cron jobs are in a file I created located at /etc/cron.d/Observium. Do I need to move them?
Thanks, Jason
FROM: observium [mailto:observium-bounces@observium.org] ON BEHALF OF Adam Armstrong SENT: Thursday, December 05, 2013 3:39 PM TO: Observium Network Observation System SUBJECT: Re: [Observium] Graph Data only displays -nan
So where did you put the observium from jobs...?
Adam.
Jason Ross jross@medicalteams.org wrote:
Sorry it’s a screenshot instead of text…don’t have an easy way to grab files off that server yet. Here is the output.
FROM: observium [mailto:observium-bounces@observium.org] ON BEHALF OF Tom Laermans SENT: Thursday, December 05, 2013 12:59 PM TO: Observium Network Observation System SUBJECT: Re: [Observium] Graph Data only displays -nan
Please paste the output of this command: cat /etc/crontab
Thanks, Tom
On 05/12/2013 21:40, Jason Ross wrote:
First, I must apologize for yet another question about “graphs not working”. However, I have read everything I can find in the mail archives, in forums, and have reinstalled multiple times following the instructions exactly. Each time with the –nan listed for all data points. Verified permissions on the rrd and tmp folders and both match the same user/group as what everything is running as. I eventually resorted to installing and running everything as root to try and resolve permission errors. Once I figure out what’s wrong I’ll go back to std user. Sorry for the long email, but I wanted to include everything I know so far.
Monitoring Host:
Ubuntu 13.04
Observium 13.12.4811
Virtual Machine on Hyper-V
Currently Monitored Devices:
3 HP Procurve Switches
1 Ricoh Copier
2 Sonicwall Firewalls
Testing results thus far:
Real-time graphing works for each device.
Every other graph is drawn, but has “-nan” for each data point.
Same for each device.
- Prior to installing jpgraph (to get billing to work) all devices
did not list traffic data under the Ports tab.
- Post jpgraph install and config, traffic info under Ports tab works
for Ricoh Copier and 1 of 3 HP Procurve switches, but no other devices. Only 0 bps is listed.
- Enabled rrdcached in the config file with adding
$config['rrdcached'] = "unix:/var/run/rrdcached.sock";.
- Ran discovery and polling for everything again and all devices list
stats for traffic under Ports tab.
Billing still doesn’t capture traffic data on any device.
Billing Accurate Graphs gives an error of 25121 – “Empty input data
array specified for plot. Must have at least one data point.”
I believe billing errors may be related to the rest.
I ran discovery and polling in debug mode writing to text files and it appears that the data is being pulled from the device correctly. It also looks like it writes the data into the rrd device file and updates the mysql database without showing any errors. Thus, I’m perplexed as to what it could be and have no direction to look into… Help would be appreciated.
Thanks, Jason
observium mailing list
observium@observium.org
http://postman.memetic.org/cgi-bin/mailman/listinfo/observium [1]
observium mailing list observium@observium.org http://postman.memetic.org/cgi-bin/mailman/listinfo/observium [1]
-- Sent from my Android device with K-9 Mail. Please excuse my brevity.
Links:
[1] http://postman.memetic.org/cgi-bin/mailman/listinfo/observium
observium mailing list observium@observium.org http://postman.memetic.org/cgi-bin/mailman/listinfo/observium
_______________________________________________ observium mailing list observium@observium.org http://postman.memetic.org/cgi-bin/mailman/listinfo/observium
Adam, So while I've been building another server, I noticed that after I add a new device to observum via the web gui, it is displayed in the devices, but after 30 minutes, it still hasn't been polled or discovered. Would this indicate that my cron jobs aren't running as they should be? Last question about this, I promise.
Thanks, Jason
-----Original Message----- From: observium [mailto:observium-bounces@observium.org] On Behalf Of Adam Armstrong Sent: Tuesday, December 17, 2013 3:30 PM To: Observium Network Observation System Subject: Re: [Observium] Graph Data only displays -nan
Well, it seems to definitely be correctly updating and running the poller.
If your RRDs are being created, then there are no permissions issues (poller runs as root anyways). I really can't see why it's not working, unless your crontab entries are not being run.
If you want to give me access to the server, I can fix and tell everyone what you did wrong! ;P
adam.
On 2013-12-17 23:21, Jason Ross wrote:
Whoops…sorry. Forgot to paste it in.
array(88
port_id => 3
device_id => 1
port_64bit => 1
port_label =>
port_descr_type => null
port_descr_descr => null
port_descr_circuit => null
port_descr_speed => null
port_descr_notes => null
ifDescr => 3
ifName => 3
portName => null
ifIndex => 3
ifSpeed => 100000000
ifConnectorPresent => true
ifPromiscuousMode => true
ifHighSpeed => 100
ifOperStatus => up
ifAdminStatus => up
ifDuplex => fullDuplex
ifMtu => 1514
ifType => ethernetCsmacd
ifAlias =>
ifPhysAddress => 00110ae4e7fd
ifHardType => null
ifLastChange => 2013-12-17 06:38:12
date-8hr America/Los_Angeles (UTC-8)
ifVlan => 1
ifTrunk => dot1Q
ifVrf => null
ignore => 0
disabled => 0
detailed => 0
deleted => 0
pagpOperationMode => null
pagpPortState => null
pagpPartnerDeviceId => null
pagpPartnerLearnMethod => null
pagpPartnerIfIndex => null
pagpPartnerGroupIfIndex => null
pagpPartnerDeviceName => null
pagpEthcOperationMode => null
pagpDeviceId => null
pagpGroupIfIndex => null
ifInUcastPkts => 215457373
ifInUcastPkts_delta => 203755
ifInUcastPkts_rate => 217
ifOutUcastPkts => 304943357
ifOutUcastPkts_delta => 291120
ifOutUcastPkts_rate => 310
ifInErrors => 163
ifInErrors_delta => 0
ifInErrors_rate => 0
ifOutErrors => 0
ifOutErrors_delta => 0
ifOutErrors_rate => 0
ifOctets_rate => 384524
ifUcastPkts_rate => 527
ifErrors_rate => 0
ifInOctets => 28916762299
ifInOctets_delta => 27302870
ifInOctets_rate => 29077
ifOutOctets => 353122057304
ifOutOctets_delta => 333765358
ifOutOctets_rate => 355448
ifInOctets_perc => 0
ifOutOctets_perc => 3
poll_time => 1387321711
poll_period => 939
hostname => pdx-sw-dc
human_speed => 100Mbps
human_type => Ethernet
html_class =>
human_mac => 00:11:0a:e4:e7:fd
label => 3
entity_name => 3
entity_shortname => 3
entity_descr =>
admin_status => enabled
table_tab_colour => #194B7F
row_class =>
in_rate => 232616
out_rate => 2843584
bps_in_style => color: #008C00;
bps_out_style => color: #394182;
pps_in_style => color: #740074;
pps_out_style => color: #FF7400;
humanized => true
graph_type => port_errors
FROM: Jason Ross SENT: Tuesday, December 17, 2013 3:21 PM TO: 'Observium Network Observation System' SUBJECT: RE: [Observium] Graph Data only displays -nan
Well, one last attempt before building again using vmware instead of hyper-v so I can copy/paste the install guide… Here is the output of clicking on “Data” for a device’s port. This has traffic bandwidth info displayed in viewing all ports of the device, but again, only has “-nan” for data.
To me it looks like the data it needs I there, but maybe I’m missing something? I also just removed the mysql database, deleted the rrd directory, re-created rrd, chown’d it to www-data:www-data, and recreated the database per the install page, and copied config.php.default over to config.php again. This should be a fresh start for permissions and graphing that we’ve been discussing correct?
FROM: observium [mailto:observium-bounces@observium.org] ON BEHALF OF Josh Hopper SENT: Tuesday, December 17, 2013 2:24 PM TO: Observium Network Observation System SUBJECT: Re: [Observium] Graph Data only displays -nan
Doh! My mistake. I’ll use it next quarter. I promise.
--
Sincerely,
Joshua Hopper, A+ CE
_Network Administrator_
420 3rd Ave NW Hickory NC 28601
Office: 828-449-1839x2160 | Cell: 828-855-7565
FROM: observium [mailto:observium-bounces@observium.org] ON BEHALF OF Adam Armstrong SENT: Tuesday, December 17, 2013 5:09 PM TO: Observium Network Observation System SUBJECT: Re: [Observium] Graph Data only displays -nan
He seems to be using svn :)
Adam.
Josh Hopper joshhopper@protectplus.com wrote:
Adam, the Community version is now different. You just have to CHMOD the RRD directory.
Remove SNMP if it applies (as per the guide). But the CHMOD 755 on RRD wasn’t in the guide.
--
Sincerely,
Joshua Hopper, A+ CE
_Network Administrator_
420 3rd Ave NW Hickory NC 28601
Office: 828-449-1839x2160 | Cell: 828-855-7565
FROM: observium [mailto:observium-bounces@observium.org] ON BEHALF OF Adam Armstrong SENT: Tuesday, December 17, 2013 5:03 PM TO: Observium Network Observation System SUBJECT: Re: [Observium] Graph Data only displays -nan
Which version of Ubuntu?
The install guide is copy&paste idiot proof, pretty much!
Adam.
Jason Ross jross@medicalteams.org wrote:
Yes, virtualized using hyper-v, but nothing else is on it. Started with a fresh image of Ubuntu server and went right into the Observium install instructions.
FROM: observium [mailto:observium-bounces@observium.org] ON BEHALF OF Adam Armstrong SENT: Tuesday, December 17, 2013 1:16 PM TO: Observium Network Observation System SUBJECT: Re: [Observium] Graph Data only displays -nan
Is this a clean server with nothing else on it?
Jason Ross jross@medicalteams.org wrote:
Ok, so I know my graphing issus are permissions related, and I’ve checked the rrd folder permissions / tried adjusting them with solutions given to other people with graphing problems. I’m still unable to get anything other than “-nan” into the graphs.
-All graphs write, but no data is displayed.
-Realtime graphs display data
-Traffic stats is being displayed in the “Ports” tab for my devices.
Install Info:
-During last setup/install I enabled root user and installed everything under root. (Was a last ditch effort and I’ll change / redo after I get this working at least once…)
-rrd folder has root:root listed with “ls -la” output. (I tried using www-data:ww-data, Observium:root, etc with no success.)
-cron jobs (not using e-tab) had user “root” listed exactly like in the install guide. /etc/cron.d/Observium Currently has no user listed, but it made no difference that I can see.
Today I updated to version 4836 and had “no auth” displayed in the device graphs previews, which I hadn’t ever seen before. Seems like it was something that changed from 4811 to 4836 as I hadn’t made any other changes. However, I still only get –nan in the data fields, which furthers my belief that I’m missing something having to do with folder permissions.
Can someone give a list of folders that need to have specific permissions set? And if you’re feeling REALLY generous, maybe even what the permissions should be with knowing that everything was installed using the root user? I’d really love to move past this and start testing Observium!
Thanks, Jason
FROM: observium [mailto:observium-bounces@observium.org] ON BEHALF OF Jason Ross SENT: Friday, December 06, 2013 10:25 AM TO: Observium Network Observation System SUBJECT: Re: [Observium] Graph Data only displays -nan
Any other ideas or things I can check?
FROM: observium [mailto:observium-bounces@observium.org] ON BEHALF OF Jason Ross SENT: Thursday, December 05, 2013 3:48 PM TO: Observium Network Observation System SUBJECT: Re: [Observium] Graph Data only displays -nan
Ha! Yeah I can at least pick up on the hints. :-)
FROM: observium [mailto:observium-bounces@observium.org] ON BEHALF OF Adam Armstrong SENT: Thursday, December 05, 2013 3:45 PM TO: Observium Network Observation System SUBJECT: Re: [Observium] Graph Data only displays -nan
No, that is correct.
Some people insist on trying to put them in a user cron file with crontab -e, very common error, hence the big red box!
Adam.
Jason Ross jross@medicalteams.org wrote:
Not sure if you meant cron jobs instead of from jobs, but it seems like you may have. I followed the instructions:
Add cron jobs, create a new file /etc/cron.d/observium with the following contents:
IMPORTANT!
Please note that the below example includes a username, so will only work in /etc/crontab or /etc/cron.d/observium. It will NOT work in a user crontab edited with crontab -e.
33 */6 * * * root /opt/observium/discovery.php -h all >> /dev/null 2>&1
*/5 * * * * root /opt/observium/discovery.php -h new >> /dev/null 2>&1
*/5 * * * * root /opt/observium/poller-wrapper.py 1 >> /dev/null 2>&1
So these cron jobs are in a file I created located at /etc/cron.d/Observium. Do I need to move them?
Thanks, Jason
FROM: observium [mailto:observium-bounces@observium.org] ON BEHALF OF Adam Armstrong SENT: Thursday, December 05, 2013 3:39 PM TO: Observium Network Observation System SUBJECT: Re: [Observium] Graph Data only displays -nan
So where did you put the observium from jobs...?
Adam.
Jason Ross jross@medicalteams.org wrote:
Sorry it’s a screenshot instead of text…don’t have an easy way to grab files off that server yet. Here is the output.
FROM: observium [mailto:observium-bounces@observium.org] ON BEHALF OF Tom Laermans SENT: Thursday, December 05, 2013 12:59 PM TO: Observium Network Observation System SUBJECT: Re: [Observium] Graph Data only displays -nan
Please paste the output of this command: cat /etc/crontab
Thanks, Tom
On 05/12/2013 21:40, Jason Ross wrote:
First, I must apologize for yet another question about “graphs not working”. However, I have read everything I can find in the mail archives, in forums, and have reinstalled multiple times following the instructions exactly. Each time with the –nan listed for all data points. Verified permissions on the rrd and tmp folders and both match the same user/group as what everything is running as. I eventually resorted to installing and running everything as root to try and resolve permission errors. Once I figure out what’s wrong I’ll go back to std user. Sorry for the long email, but I wanted to include everything I know so far.
Monitoring Host:
Ubuntu 13.04
Observium 13.12.4811
Virtual Machine on Hyper-V
Currently Monitored Devices:
3 HP Procurve Switches
1 Ricoh Copier
2 Sonicwall Firewalls
Testing results thus far:
Real-time graphing works for each device.
Every other graph is drawn, but has “-nan” for each data point.
Same for each device.
- Prior to installing jpgraph (to get billing to work) all devices
did not list traffic data under the Ports tab.
- Post jpgraph install and config, traffic info under Ports tab works
for Ricoh Copier and 1 of 3 HP Procurve switches, but no other devices. Only 0 bps is listed.
- Enabled rrdcached in the config file with adding
$config['rrdcached'] = "unix:/var/run/rrdcached.sock";.
- Ran discovery and polling for everything again and all devices list
stats for traffic under Ports tab.
Billing still doesn’t capture traffic data on any device.
Billing Accurate Graphs gives an error of 25121 – “Empty input data
array specified for plot. Must have at least one data point.”
I believe billing errors may be related to the rest.
I ran discovery and polling in debug mode writing to text files and it appears that the data is being pulled from the device correctly. It also looks like it writes the data into the rrd device file and updates the mysql database without showing any errors. Thus, I’m perplexed as to what it could be and have no direction to look into… Help would be appreciated.
Thanks, Jason
observium mailing list
observium@observium.org
http://postman.memetic.org/cgi-bin/mailman/listinfo/observium [1]
observium mailing list observium@observium.org http://postman.memetic.org/cgi-bin/mailman/listinfo/observium [1]
-- Sent from my Android device with K-9 Mail. Please excuse my brevity.
Links:
[1] http://postman.memetic.org/cgi-bin/mailman/listinfo/observium
observium mailing list observium@observium.org http://postman.memetic.org/cgi-bin/mailman/listinfo/observium
_______________________________________________ observium mailing list observium@observium.org http://postman.memetic.org/cgi-bin/mailman/listinfo/observium
That is indeed what it would suggest!
Jason Ross jross@medicalteams.org wrote:
Adam, So while I've been building another server, I noticed that after I add a new device to observum via the web gui, it is displayed in the devices, but after 30 minutes, it still hasn't been polled or discovered. Would this indicate that my cron jobs aren't running as they should be? Last question about this, I promise.
Thanks, Jason
-----Original Message----- From: observium [mailto:observium-bounces@observium.org] On Behalf Of Adam Armstrong Sent: Tuesday, December 17, 2013 3:30 PM To: Observium Network Observation System Subject: Re: [Observium] Graph Data only displays -nan
Well, it seems to definitely be correctly updating and running the poller.
If your RRDs are being created, then there are no permissions issues (poller runs as root anyways). I really can't see why it's not working, unless your crontab entries are not being run.
If you want to give me access to the server, I can fix and tell everyone what you did wrong! ;P
adam.
On 2013-12-17 23:21, Jason Ross wrote:
Whoops…sorry. Forgot to paste it in.
array(88
port_id => 3
device_id => 1
port_64bit => 1
port_label =>
port_descr_type => null
port_descr_descr => null
port_descr_circuit => null
port_descr_speed => null
port_descr_notes => null
ifDescr => 3
ifName => 3
portName => null
ifIndex => 3
ifSpeed => 100000000
ifConnectorPresent => true
ifPromiscuousMode => true
ifHighSpeed => 100
ifOperStatus => up
ifAdminStatus => up
ifDuplex => fullDuplex
ifMtu => 1514
ifType => ethernetCsmacd
ifAlias =>
ifPhysAddress => 00110ae4e7fd
ifHardType => null
ifLastChange => 2013-12-17 06:38:12
date-8hr America/Los_Angeles (UTC-8)
ifVlan => 1
ifTrunk => dot1Q
ifVrf => null
ignore => 0
disabled => 0
detailed => 0
deleted => 0
pagpOperationMode => null
pagpPortState => null
pagpPartnerDeviceId => null
pagpPartnerLearnMethod => null
pagpPartnerIfIndex => null
pagpPartnerGroupIfIndex => null
pagpPartnerDeviceName => null
pagpEthcOperationMode => null
pagpDeviceId => null
pagpGroupIfIndex => null
ifInUcastPkts => 215457373
ifInUcastPkts_delta => 203755
ifInUcastPkts_rate => 217
ifOutUcastPkts => 304943357
ifOutUcastPkts_delta => 291120
ifOutUcastPkts_rate => 310
ifInErrors => 163
ifInErrors_delta => 0
ifInErrors_rate => 0
ifOutErrors => 0
ifOutErrors_delta => 0
ifOutErrors_rate => 0
ifOctets_rate => 384524
ifUcastPkts_rate => 527
ifErrors_rate => 0
ifInOctets => 28916762299
ifInOctets_delta => 27302870
ifInOctets_rate => 29077
ifOutOctets => 353122057304
ifOutOctets_delta => 333765358
ifOutOctets_rate => 355448
ifInOctets_perc => 0
ifOutOctets_perc => 3
poll_time => 1387321711
poll_period => 939
hostname => pdx-sw-dc
human_speed => 100Mbps
human_type => Ethernet
html_class =>
human_mac => 00:11:0a:e4:e7:fd
label => 3
entity_name => 3
entity_shortname => 3
entity_descr =>
admin_status => enabled
table_tab_colour => #194B7F
row_class =>
in_rate => 232616
out_rate => 2843584
bps_in_style => color: #008C00;
bps_out_style => color: #394182;
pps_in_style => color: #740074;
pps_out_style => color: #FF7400;
humanized => true
graph_type => port_errors
FROM: Jason Ross SENT: Tuesday, December 17, 2013 3:21 PM TO: 'Observium Network Observation System' SUBJECT: RE: [Observium] Graph Data only displays -nan
Well, one last attempt before building again using vmware instead of hyper-v so I can copy/paste the install guide… Here is the output of clicking on “Data” for a device’s port. This has traffic bandwidth info displayed in viewing all ports of the device, but again, only
has
“-nan” for data.
To me it looks like the data it needs I there, but maybe I’m missing something? I also just removed the mysql database, deleted the rrd directory, re-created rrd, chown’d it to www-data:www-data, and recreated the database per the install page, and copied config.php.default over to config.php again. This should be a fresh start for permissions and graphing that we’ve been discussing
correct?
FROM: observium [mailto:observium-bounces@observium.org] ON BEHALF OF
Josh Hopper SENT: Tuesday, December 17, 2013 2:24 PM TO: Observium Network Observation System SUBJECT: Re: [Observium] Graph Data only displays -nan
Doh! My mistake. I’ll use it next quarter. I promise.
--
Sincerely,
Joshua Hopper, A+ CE
_Network Administrator_
420 3rd Ave NW Hickory NC 28601
Office: 828-449-1839x2160 | Cell: 828-855-7565
FROM: observium [mailto:observium-bounces@observium.org] ON BEHALF OF
Adam Armstrong SENT: Tuesday, December 17, 2013 5:09 PM TO: Observium Network Observation System SUBJECT: Re: [Observium] Graph Data only displays -nan
He seems to be using svn :)
Adam.
Josh Hopper joshhopper@protectplus.com wrote:
Adam, the Community version is now different. You just have to CHMOD the RRD directory.
Remove SNMP if it applies (as per the guide). But the CHMOD 755 on
RRD
wasn’t in the guide.
--
Sincerely,
Joshua Hopper, A+ CE
_Network Administrator_
420 3rd Ave NW Hickory NC 28601
Office: 828-449-1839x2160 | Cell: 828-855-7565
FROM: observium [mailto:observium-bounces@observium.org] ON BEHALF OF
Adam Armstrong SENT: Tuesday, December 17, 2013 5:03 PM TO: Observium Network Observation System SUBJECT: Re: [Observium] Graph Data only displays -nan
Which version of Ubuntu?
The install guide is copy&paste idiot proof, pretty much!
Adam.
Jason Ross jross@medicalteams.org wrote:
Yes, virtualized using hyper-v, but nothing else is on it. Started with a fresh image of Ubuntu server and went right into the Observium
install instructions.
FROM: observium [mailto:observium-bounces@observium.org] ON BEHALF OF
Adam Armstrong SENT: Tuesday, December 17, 2013 1:16 PM TO: Observium Network Observation System SUBJECT: Re: [Observium] Graph Data only displays -nan
Is this a clean server with nothing else on it?
Jason Ross jross@medicalteams.org wrote:
Ok, so I know my graphing issus are permissions related, and I’ve checked the rrd folder permissions / tried adjusting them with solutions given to other people with graphing problems. I’m still unable to get anything other than “-nan” into the graphs.
-All graphs write, but no data is displayed.
-Realtime graphs display data
-Traffic stats is being displayed in the “Ports” tab for my devices.
Install Info:
-During last setup/install I enabled root user and installed everything under root. (Was a last ditch effort and I’ll change /
redo
after I get this working at least once…)
-rrd folder has root:root listed with “ls -la” output. (I tried using
www-data:ww-data, Observium:root, etc with no success.)
-cron jobs (not using e-tab) had user “root” listed exactly like in the install guide. /etc/cron.d/Observium Currently has no user
listed,
but it made no difference that I can see.
Today I updated to version 4836 and had “no auth” displayed in the device graphs previews, which I hadn’t ever seen before. Seems like
it
was something that changed from 4811 to 4836 as I hadn’t made any other changes. However, I still only get –nan in the data fields, which furthers my belief that I’m missing something having to do with
folder permissions.
Can someone give a list of folders that need to have specific permissions set? And if you’re feeling REALLY generous, maybe even what the permissions should be with knowing that everything was installed using the root user? I’d really love to move past this and start testing Observium!
Thanks, Jason
FROM: observium [mailto:observium-bounces@observium.org] ON BEHALF OF
Jason Ross SENT: Friday, December 06, 2013 10:25 AM TO: Observium Network Observation System SUBJECT: Re: [Observium] Graph Data only displays -nan
Any other ideas or things I can check?
FROM: observium [mailto:observium-bounces@observium.org] ON BEHALF OF
Jason Ross SENT: Thursday, December 05, 2013 3:48 PM TO: Observium Network Observation System SUBJECT: Re: [Observium] Graph Data only displays -nan
Ha! Yeah I can at least pick up on the hints. :-)
FROM: observium [mailto:observium-bounces@observium.org] ON BEHALF OF
Adam Armstrong SENT: Thursday, December 05, 2013 3:45 PM TO: Observium Network Observation System SUBJECT: Re: [Observium] Graph Data only displays -nan
No, that is correct.
Some people insist on trying to put them in a user cron file with crontab -e, very common error, hence the big red box!
Adam.
Jason Ross jross@medicalteams.org wrote:
Not sure if you meant cron jobs instead of from jobs, but it seems like you may have. I followed the instructions:
Add cron jobs, create a new file /etc/cron.d/observium with the following contents:
IMPORTANT!
Please note that the below example includes a username, so will only work in /etc/crontab or /etc/cron.d/observium. It will NOT work in a user crontab edited with crontab -e.
33 */6 * * * root /opt/observium/discovery.php -h all >> /dev/null 2>&1
*/5 * * * * root /opt/observium/discovery.php -h new >> /dev/null
2>&1
*/5 * * * * root /opt/observium/poller-wrapper.py 1 >> /dev/null 2>&1
So these cron jobs are in a file I created located at /etc/cron.d/Observium. Do I need to move them?
Thanks, Jason
FROM: observium [mailto:observium-bounces@observium.org] ON BEHALF OF
Adam Armstrong SENT: Thursday, December 05, 2013 3:39 PM TO: Observium Network Observation System SUBJECT: Re: [Observium] Graph Data only displays -nan
So where did you put the observium from jobs...?
Adam.
Jason Ross jross@medicalteams.org wrote:
Sorry it’s a screenshot instead of text…don’t have an easy way to
grab
files off that server yet. Here is the output.
FROM: observium [mailto:observium-bounces@observium.org] ON BEHALF OF
Tom Laermans SENT: Thursday, December 05, 2013 12:59 PM TO: Observium Network Observation System SUBJECT: Re: [Observium] Graph Data only displays -nan
Please paste the output of this command: cat /etc/crontab
Thanks, Tom
On 05/12/2013 21:40, Jason Ross wrote:
First, I must apologize for yet another question about “graphs not working”. However, I have read everything I can find in the mail archives, in forums, and have reinstalled multiple times following
the
instructions exactly. Each time with the –nan listed for all data points. Verified permissions on the rrd and tmp folders and both
match
the same user/group as what everything is running as. I eventually resorted to installing and running everything as root to try and resolve permission errors. Once I figure out what’s wrong I’ll go
back
to std user. Sorry for the long email, but I wanted to include everything I know so far.
Monitoring Host:
Ubuntu 13.04
Observium 13.12.4811
Virtual Machine on Hyper-V
Currently Monitored Devices:
3 HP Procurve Switches
1 Ricoh Copier
2 Sonicwall Firewalls
Testing results thus far:
Real-time graphing works for each device.
Every other graph is drawn, but has “-nan” for each data point.
Same for each device.
- Prior to installing jpgraph (to get billing to work) all devices
did not list traffic data under the Ports tab.
- Post jpgraph install and config, traffic info under Ports tab
works
for Ricoh Copier and 1 of 3 HP Procurve switches, but no other
devices.
Only 0 bps is listed.
- Enabled rrdcached in the config file with adding
$config['rrdcached'] = "unix:/var/run/rrdcached.sock";.
- Ran discovery and polling for everything again and all devices
list
stats for traffic under Ports tab.
Billing still doesn’t capture traffic data on any device.
Billing Accurate Graphs gives an error of 25121 – “Empty input
data
array specified for plot. Must have at least one data point.”
I believe billing errors may be related to the rest.
I ran discovery and polling in debug mode writing to text files and
it
appears that the data is being pulled from the device correctly. It also looks like it writes the data into the rrd device file and updates the mysql database without showing any errors. Thus, I’m perplexed as to what it could be and have no direction to look into… Help would be appreciated.
Thanks, Jason
observium mailing list
observium@observium.org
http://postman.memetic.org/cgi-bin/mailman/listinfo/observium [1]
observium mailing list observium@observium.org http://postman.memetic.org/cgi-bin/mailman/listinfo/observium [1]
-- Sent from my Android device with K-9 Mail. Please excuse my brevity.
Links:
[1] http://postman.memetic.org/cgi-bin/mailman/listinfo/observium
observium mailing list observium@observium.org http://postman.memetic.org/cgi-bin/mailman/listinfo/observium
observium mailing list observium@observium.org http://postman.memetic.org/cgi-bin/mailman/listinfo/observium _______________________________________________ observium mailing list observium@observium.org http://postman.memetic.org/cgi-bin/mailman/listinfo/observium
So if I created the file /etc/cron.d/Observium and entered the cron jobs as in the instructions, why wouldn’t they be running?
From: observium [mailto:observium-bounces@observium.org] On Behalf Of Adam Armstrong Sent: Tuesday, December 17, 2013 4:50 PM To: Observium Network Observation System Subject: Re: [Observium] Graph Data only displays -nan
That is indeed what it would suggest! Jason Ross <jross@medicalteams.orgmailto:jross@medicalteams.org> wrote:
Adam, So while I've been building another server, I noticed that after I add a new device to observum via the web gui, it is displayed in the devices, but after 30 minutes, it still hasn't been polled or discovered. Would this indicate that my cron jobs aren't running as they should be? Last question about this, I promise.
Thanks, Jason
-----Original Message----- From: observium [mailto:observium-bounces@observium.org] On Behalf Of Adam Armstrong Sent: Tuesday, December 17, 2013 3:30 PM To: Observium Network Observation System Subject: Re: [Observium] Graph Data only displays -nan
Well, it seems to definitely be correctly updating and running the poller.
If your RRDs are being created, then there are no permissions issues (poller runs as root anyways). I really can't see why it's not working, unless your crontab entries are not being run.
If you want to give me access to t
he
server, I can fix and tell everyone what you did wrong! ;P
adam.
On 2013-12-17 23:21, Jason Ross wrote:
Whoops…sorry. Forgot to paste it in.
array(88
port_id => 3
device_id => 1
port_64bit => 1
port_label =>
port_descr_type => null
port_descr_descr => null
port_descr_circuit => null
port_descr_speed => null
port_descr_notes => null
ifDescr => 3
ifName => 3
portName => null
ifIndex => 3
ifSpeed => 100000000
ifConnectorPresent => true
ifPromiscuousMode => true
ifHighSpeed => 100
ifOperStatus => up
ifAdminStatus => up
ifDuplex => fullDuplex
ifMtu => 1514
ifType => ethernetCsmacd
ifAlias =>
ifPhysAddress => 00110ae4e7fd
ifHardType => null
ifLastChange => 2013-12-17 06:38:12
date-8hr America/Los_Angeles (UTC-8)
ifVlan => 1
ifTrunk => dot1Q
ifVrf => null
ignore => 0
disabled => 0
detailed => 0
deleted => 0
pagpOperationMode => null
pagpPortState => null
pagpPartnerDeviceId => null
pagpPartnerLearnMethod => null
pagpPartnerIfIndex => null
pagpPartnerGroupIfIndex => null
pagpPartnerDeviceName => null
pagpEthcOperationMode => null
pagpDeviceId => null
pagpGroupIfIndex => null
ifInUcastPkts => 2154573
73
ifInUcastPkts_delta => 203755
ifInUcastPkts_rate => 217
ifOutUcastPkts => 304943357
ifOutUcastPkts_delta => 291120
ifOutUcastPkts_rate => 310
ifInErrors => 163
ifInErrors_delta => 0
ifInErrors_rate => 0
ifOutErrors => 0
ifOutErrors_delta => 0
ifOutErrors_rate => 0
ifOctets_rate => 384524
ifUcastPkts_rate => 527
ifErrors_rate => 0
ifInOctets => 28916762299
ifInOctets_delta => 27302870
ifInOctets_rate => 29077
ifOutOctets => 353122057304
ifOutOctets_delta => 333765358
ifOutOctets_rate => 355448
ifInOctets_perc => 0
ifOutOctets_perc => 3
poll_time => 1387321711
poll_period => 939
hostname =&g
t;
pdx-sw-dc
human_speed => 100Mbps
human_type => Ethernet
html_class =>
human_mac => 00:11:0a:e4:e7:fd
label => 3
entity_name => 3
entity_shortname => 3
entity_descr =>
admin_status => enabled
table_tab_colour => #194B7F
row_class =>
in_rate => 232616
out_rate => 2843584
bps_in_style => color: #008C00;
bps_out_style => color: #394182;
pps_in_style => color: #740074;
pps_out_style => color: #FF7400;
humanized => true
graph_type => port_errors
FROM: Jason Ross SENT: Tuesday, December 17, 2013 3:21 PM TO: 'Observium Network Observation System' SUBJECT: RE: [Observium] Graph Data only displays -nan
Well, one last attempt before building aga
in
using vmware instead of hyper-v so I can copy/paste the install guide… Here is the output of clicking on “Data” for a device’s port. This has traffic bandwidth info displayed in viewing all ports of the device, but again, only has “-nan” for data.
To me it looks like the data it needs I there, but maybe I’m missing something? I also just removed the mysql database, deleted the rrd directory, re-created rrd, chown’d it to www-data:www-data, and recreated the database per the install page, and copied config.php.default over to config.php again. This should be a fresh start for permissions and graphing that we’ve been discussing correct?
FROM: observium [mailto:observium-bounces@observium.org] ON BEHALF OF Josh Hopper SENT: Tuesday, December 17, 2013 2:24 PM TO: Observium Network Observation System SUBJECT: Re: [Observium] Graph Data only dis
plays
-nan
Doh! My mistake. I’ll use it next quarter. I promise.
--
Sincerely,
Joshua Hopper, A+ CE
_Network Administrator_
420 3rd Ave NW Hickory NC 28601
Office: 828-449-1839x2160 | Cell: 828-855-7565
FROM: observium [mailto:observium-bounces@observium.org] ON BEHALF OF Adam Armstrong SENT: Tuesday, December 17, 2013 5:09 PM TO: Observium Network Observation System SUBJECT: Re: [Observium] Graph Data only displays -nan
He seems to be using svn :)
Adam.
Josh Hopper <joshhopper@protectplus.commailto:joshhopper@protectplus.com> wrote:
Adam, the Community version is now different. You just have to CHMOD the RRD directory.
Remove SNMP if it applies (as per the guide). But the CHMOD 755 on RRD wasn’t in the guide.
--
Sincerely,
Joshua Hopper, A+ CE
_Net
work
Administrator_
420 3rd Ave NW Hickory NC 28601
Office: 828-449-1839x2160 | Cell: 828-855-7565
FROM: observium [mailto:observium-bounces@observium.org] ON BEHALF OF Adam Armstrong SENT: Tuesday, December 17, 2013 5:03 PM TO: Observium Network Observation System SUBJECT: Re: [Observium] Graph Data only displays -nan
Which version of Ubuntu?
The install guide is copy&paste idiot proof, pretty much!
Adam.
Jason Ross <jross@medicalteams.orgmailto:jross@medicalteams.org> wrote:
Yes, virtualized using hyper-v, but nothing else is on it. Started with a fresh image of Ubuntu server and went right into the Observium install instructions.
FROM: observium [mailto:observium-bounces@observium.org] ON BEHALF OF Adam Armstrong SENT: Tuesday, December 17, 2013 1:16 PM TO: Observium Network Observation System SUBJECT: Re: [Observium]
Graph
Data only displays -nan
Is this a clean server with nothing else on it?
Jason Ross <jross@medicalteams.orgmailto:jross@medicalteams.org> wrote:
Ok, so I know my graphing issus are permissions related, and I’ve checked the rrd folder permissions / tried adjusting them with solutions given to other people with graphing problems. I’m still unable to get anything other than “-nan” into the graphs.
-All graphs write, but no data is displayed.
-Realtime graphs display data
-Traffic stats is being displayed in the “Ports” tab for my devices.
Install Info:
-During last setup/install I enabled root user and installed everything under root. (Was a last ditch effort and I’ll change / redo after I get this working at least once…)
-rrd folder has root:root listed with “ls -la” output. (I tried using www-data:ww-data, Observium:root, et
c with
no success.)
-cron jobs (not using e-tab) had user “root” listed exactly like in the install guide. /etc/cron.d/Observium Currently has no user listed, but it made no difference that I can see.
Today I updated to version 4836 and had “no auth” displayed in the device graphs previews, which I hadn’t ever seen before. Seems like it was something that changed from 4811 to 4836 as I hadn’t made any other changes. However, I still only get –nan in the data fields, which furthers my belief that I’m missing something having to do with folder permissions.
Can someone give a list of folders that need to have specific permissions set? And if you’re feeling REALLY generous, maybe even what the permissions should be with knowing that everything was installed using the root user? I’d really love to move past this and start testing Observium!
Thanks, Jason
FROM: observium [mailto:observium-bounces@observium.org] ON BEHALF OF Jason Ross SENT: Friday, December 06, 2013 10:25 AM TO: Observium Network Observation System SUBJECT: Re: [Observium] Graph Data only displays -nan
Any other ideas or things I can check?
FROM: observium [mailto:observium-bounces@observium.org] ON BEHALF OF Jason Ross SENT: Thursday, December 05, 2013 3:48 PM TO: Observium Network Observation System SUBJECT: Re: [Observium] Graph Data only displays -nan
Ha! Yeah I can at least pick up on the hints. :-)
FROM: observium [mailto:observium-bounces@observium.org] ON BEHALF OF Adam Armstrong SENT: Thursday, December 05, 2013 3:45 PM TO: Observium Network Observation System SUBJECT: Re: [Observium] Graph Data only displays -nan
No, that is correct.
Some people insist on trying to pu
t them
in a user cron file with crontab -e, very common error, hence the big red box!
Adam.
Jason Ross <jross@medicalteams.orgmailto:jross@medicalteams.org> wrote:
Not sure if you meant cron jobs instead of from jobs, but it seems like you may have. I followed the instructions:
Add cron jobs, create a new file /etc/cron.d/observium with the following contents:
IMPORTANT!
Please note that the below example includes a username, so will only work in /etc/crontab or /etc/cron.d/observium. It will NOT work in a user crontab edited with crontab -e.
33 */6 * * * root /opt/observium/discovery.php -h all >> /dev/null 2>&1
*/5 * * * * root /opt/observium/discovery.php -h new >> /dev/null 2>&1
*/5 * * * * root /opt/observium/poller-wrapper.pyhttp://poller-wrapper.py 1 >> /dev/null 2>&1
So these
cron
jobs are in a file I created located at /etc/cron.d/Observium. Do I need to move them?
Thanks, Jason
FROM: observium [mailto:observium-bounces@observium.org] ON BEHALF OF Adam Armstrong SENT: Thursday, December 05, 2013 3:39 PM TO: Observium Network Observation System SUBJECT: Re: [Observium] Graph Data only displays -nan
So where did you put the observium from jobs...?
Adam.
Jason Ross <jross@medicalteams.orgmailto:jross@medicalteams.org> wrote:
Sorry it’s a screenshot instead of text…don’t have an easy way to grab files off that server yet. Here is the output.
FROM: observium [mailto:observium-bounces@observium.org] ON BEHALF OF Tom Laermans SENT: Thursday, December 05, 2013 12:59 PM TO: Observium Network Observation System SUBJECT: Re: [Observium] Graph Data only displays -nan
Please paste the output of this command: c
at
/etc/crontab
Thanks, Tom
On 05/12/2013 21:40, Jason Ross wrote:
First, I must apologize for yet another question about “graphs not working”. However, I have read everything I can find in the mail archives, in forums, and have reinstalled multiple times following the instructions exactly. Each time with the –nan listed for all data points. Verified permissions on the rrd and tmp folders and both match the same user/group as what everything is running as. I eventually resorted to installing and running everything as root to try and resolve permission errors. Once I figure out what’s wrong I’ll go back to std user. Sorry for the long email, but I wanted to include everything I know so far.
Monitoring Host:
Ubuntu 13.04
Observium 13.12.4811
Virtual Machine on Hyper-V
Currently Monitored Devices:
3 HP Procurve Switches
1 Ricoh Copier
2 Sonicwall Firewalls
Testing results thus far:
1. Real-time graphing works for each device.
2. Every other graph is drawn, but has “-nan” for each data point. Same for each device.
3. Prior to installing jpgraph (to get billing to work) all devices did not list traffic data under the Ports tab.
4. Post jpgraph install and config, traffic info under Ports tab works for Ricoh Copier and 1 of 3 HP Procurve switches, but no other devices. Only 0 bps is listed.
5. Enabled rrdcached in the config file with adding $config['rrdcached'] = "unix:/var/run/rrdcached.sock";.
6. Ran discovery and polling for everything again and all devices list stats for traffic under Ports tab.
7. Billing still doesn’t capture traffic data on any device.
8. Billing Accurate Gr
aphs
gives an error of 25121 – “Empty input data array specified for plot. Must have at least one data point.”
I believe billing errors may be related to the rest.
I ran discovery and polling in debug mode writing to text files and it appears that the data is being pulled from the device correctly. It also looks like it writes the data into the rrd device file and updates the mysql database without showing any errors. Thus, I’m perplexed as to what it could be and have no direction to look into… Help would be appreciated.
Thanks, Jason
________________________________
observium mailing list
observium@observium.orgmailto:observium@observium.org
http://postman.memetic.org/cgi-bin/mailman/listinfo/observium [1]
-------------------------
observium mailing list observium@observium.orgmailto:observium@observium.org http://postman.memetic.org/cgi-bin/mailman/listinfo/observium [1]
-- Sent from my Android device with K-9 Mail. Please excuse my brevity.
Links: ------ [1] http://postman.memetic.org/cgi-bin/mailman/listinfo/observium
________________________________
observium mailing list observium@observium.orgmailto:observium@observium.org http://postman.memetic.org/cgi-bin/mailman/listinfo/observium
________________________________
observium mailing list observium@observium.orgmailto:observium@observium.org http://postman.memetic.org/cgi-bin/mailman/listinfo/observium
________________________________
observium mailing list observium@observium.orgmailto:observium@observium.org http://postman.memetic.org/cgi-bin/mailman/listinfo/observium
-- Sent from my Android device with K-9 Mail. Please excuse my brevity.

I had to do chmod +x on the poller py and the discovery php files and they have been running for almost a week now On Dec 17, 2013 6:21 PM, "Jason Ross" jross@medicalteams.org wrote:
So if I created the file /etc/cron.d/Observium and entered the cron jobs as in the instructions, why wouldn’t they be running?
*From:* observium [mailto:observium-bounces@observium.org] *On Behalf Of *Adam Armstrong *Sent:* Tuesday, December 17, 2013 4:50 PM *To:* Observium Network Observation System *Subject:* Re: [Observium] Graph Data only displays -nan
That is indeed what it would suggest!
Jason Ross jross@medicalteams.org wrote:
Adam, So while I've been building another server, I noticed that after I add a new device to observum via the web gui, it is displayed in the devices, but after 30 minutes, it still hasn't been polled or discovered. Would this indicate that my cron jobs aren't running as they should be? Last question about this, I promise.
Thanks, Jason
-----Original Message----- From: observium [mailto:observium-bounces@observium.org observium-bounces@observium.org] On Behalf Of Adam Armstrong Sent: Tuesday, December 17, 2013 3:30 PM To: Observium Network Observation System Subject: Re: [Observium] Graph Data only displays -nan
Well, it seems to definitely be correctly updating and running the poller.
If your RRDs are being created, then there are no permissions issues (poller runs as root anyways). I really can't see why it's not working, unless your crontab entries are not being run.
If you want to give me access to t
he
server, I can fix and tell everyone what you did wrong! ;P
adam.
On 2013-12-17 23:21, Jason Ross wrote:
Whoops…sorry. Forgot to paste it in.
array(88
port_id => 3
device_id => 1
port_64bit => 1
port_label =>
port_descr_type => null
port_descr_descr => null
port_descr_circuit => null
port_descr_speed => null
port_descr_notes => null
ifDescr => 3
ifName => 3
portName => null
ifIndex => 3
ifSpeed => 100000000
ifConnectorPresent => true
ifPromiscuousMode => true
ifHighSpeed => 100
ifOperStatus => up
ifAdminStatus => up
ifDuplex => fullDuplex
ifMtu => 1514
ifType => ethernetCsmacd
ifAlias =>
ifPhysAddress => 00110ae4e7fd
ifHardType => null
ifLastChange => 2013-12-17 06:38:12
date-8hr America/Los_Angeles (UTC-8)
ifVlan => 1
ifTrunk => dot1Q
ifVrf => null
ignore => 0
disabled => 0
detailed => 0
deleted => 0
pagpOperationMode => null
pagpPortState => null
pagpPartnerDeviceId => null
pagpPartnerLearnMethod => null
pagpPartnerIfIndex => null
pagpPartnerGroupIfIndex => null
pagpPartnerDeviceName => null
pagpEthcOperationMode => null
pagpDeviceId => null
pagpGroupIfIndex => null
ifInUcastPkts => 2154573
73
ifInUcastPkts_delta => 203755
ifInUcastPkts_rate => 217
ifOutUcastPkts => 304943357
ifOutUcastPkts_delta => 291120
ifOutUcastPkts_rate => 310
ifInErrors => 163
ifInErrors_delta => 0
ifInErrors_rate => 0
ifOutErrors => 0
ifOutErrors_delta => 0
ifOutErrors_rate => 0
ifOctets_rate => 384524
ifUcastPkts_rate => 527
ifErrors_rate => 0
ifInOctets => 28916762299
ifInOctets_delta => 27302870
ifInOctets_rate => 29077
ifOutOctets => 353122057304
ifOutOctets_delta => 333765358
ifOutOctets_rate => 355448
ifInOctets_perc => 0
ifOutOctets_perc => 3
poll_time => 1387321711
poll_period => 939
hostname =&g
t;
pdx-sw-dc
human_speed => 100Mbps
human_type => Ethernet
html_class =>
human_mac => 00:11:0a:e4:e7:fd
label => 3
entity_name => 3
entity_shortname => 3
entity_descr =>
admin_status => enabled
table_tab_colour => #194B7F
row_class =>
in_rate => 232616
out_rate => 2843584
bps_in_style => color: #008C00;
bps_out_style => color: #394182;
pps_in_style => color: #740074;
pps_out_style => color: #FF7400;
humanized => true
graph_type => port_errors
FROM: Jason Ross SENT: Tuesday, December 17, 2013 3:21 PM TO: 'Observium Network Observation System' SUBJECT: RE: [Observium] Graph Data only displays -nan
Well, one last attempt before building aga
in
using vmware instead of hyper-v so I can copy/paste the install guide… Here is the output of clicking on “Data” for a device’s port. This has traffic bandwidth info displayed in viewing all ports of the device, but again, only has “-nan” for data.
To me it looks like the data it needs I there, but maybe I’m missing something? I also just removed the mysql database, deleted the rrd directory, re-created rrd, chown’d it to www-data:www-data, and recreated the database per the install page, and copied config.php.default over to config.php again. This should be a fresh start for permissions and graphing that we’ve been discussing correct?
FROM: observium [mailto:observium-bounces@observium.org observium-bounces@observium.org] ON BEHALF OF Josh Hopper SENT: Tuesday, December 17, 2013 2:24 PM TO: Observium Network Observation System SUBJECT: Re: [Observium] Graph Data only dis
plays
-nan
Doh! My mistake. I’ll use it next quarter. I promise.
--
Sincerely,
Joshua Hopper, A+ CE
_Network Administrator_
420 3rd Ave NW Hickory NC 28601
Office: 828-449-1839x2160 | Cell: 828-855-7565
FROM: observium [mailto:observium-bounces@observium.org observium-bounces@observium.org] ON BEHALF OF Adam Armstrong SENT: Tuesday, December 17, 2013 5:09 PM TO: Observium Network Observation System SUBJECT: Re: [Observium] Graph Data only displays -nan
He seems to be using svn :)
Adam.
Josh Hopper joshhopper@protectplus.com wrote:
Adam, the Community version is now different. You just have to CHMOD the RRD directory.
Remove SNMP if it applies (as per the guide). But the CHMOD 755 on RRD wasn’t in the guide.
--
Sincerely,
Joshua Hopper, A+ CE
_Net
work
Administrator_
420 3rd Ave NW Hickory NC 28601
Office: 828-449-1839x2160 | Cell: 828-855-7565
FROM: observium [mailto:observium-bounces@observium.org observium-bounces@observium.org] ON BEHALF OF Adam Armstrong SENT: Tuesday, December 17, 2013 5:03 PM TO: Observium Network Observation System SUBJECT: Re: [Observium] Graph Data only displays -nan
Which version of Ubuntu?
The install guide is copy&paste idiot proof, pretty much!
Adam.
Jason Ross jross@medicalteams.org wrote:
Yes, virtualized using hyper-v, but nothing else is on it. Started with a fresh image of Ubuntu server and went right into the Observium install instructions.
FROM: observium [mailto:observium-bounces@observium.org observium-bounces@observium.org] ON BEHALF OF Adam Armstrong SENT: Tuesday, December 17, 2013 1:16 PM TO: Observium Network Observation System SUBJECT: Re: [Observium]
Graph
Data only displays -nan
Is this a clean server with nothing else on it?
Jason Ross jross@medicalteams.org wrote:
Ok, so I know my graphing issus are permissions related, and I’ve checked the rrd folder permissions / tried adjusting them with solutions given to other people with graphing problems. I’m still unable to get anything other than “-nan” into the graphs.
-All graphs write, but no data is displayed.
-Realtime graphs display data
-Traffic stats is being displayed in the “Ports” tab for my devices.
Install Info:
-During last setup/install I enabled root user and installed everything under root. (Was a last ditch effort and I’ll change / redo after I get this working at least once…)
-rrd folder has root:root listed with “ls -la” output. (I tried using www-data:ww-data, Observium:root, et
c with
no success.)
-cron jobs (not using e-tab) had user “root” listed exactly like in the install guide. /etc/cron.d/Observium Currently has no user listed, but it made no difference that I can see.
Today I updated to version 4836 and had “no auth” displayed in the device graphs previews, which I hadn’t ever seen before. Seems like it was something that changed from 4811 to 4836 as I hadn’t made any other changes. However, I still only get –nan in the data fields, which furthers my belief that I’m missing something having to do with folder permissions.
Can someone give a list of folders that need to have specific permissions set? And if you’re feeling REALLY generous, maybe even what the permissions should be with knowing that everything was installed using the root user? I’d really love to move past this and start testing Observium!
Thanks, Jason
FROM: observium [mailto:observium-bounces@observium.org observium-bounces@observium.org] ON BEHALF OF Jason Ross SENT: Friday, December 06, 2013 10:25 AM TO: Observium Network Observation System SUBJECT: Re: [Observium] Graph Data only displays -nan
Any other ideas or things I can check?
FROM: observium [mailto:observium-bounces@observium.org observium-bounces@observium.org] ON BEHALF OF Jason Ross SENT: Thursday, December 05, 2013 3:48 PM TO: Observium Network Observation System SUBJECT: Re: [Observium] Graph Data only displays -nan
Ha! Yeah I can at least pick up on the hints. :-)
FROM: observium [mailto:observium-bounces@observium.org observium-bounces@observium.org] ON BEHALF OF Adam Armstrong SENT: Thursday, December 05, 2013 3:45 PM TO: Observium Network Observation System SUBJECT: Re: [Observium] Graph Data only displays -nan
No, that is correct.
Some people insist on trying to pu
t them
in a user cron file with crontab -e, very common error, hence the big red box!
Adam.
Jason Ross jross@medicalteams.org wrote:
Not sure if you meant cron jobs instead of from jobs, but it seems like you may have. I followed the instructions:
Add cron jobs, create a new file /etc/cron.d/observium with the following contents:
IMPORTANT!
Please note that the below example includes a username, so will only work in /etc/crontab or /etc/cron.d/observium. It will NOT work in a user crontab edited with crontab -e.
33 */6 * * * root /opt/observium/discovery.php -h all >> /dev/null 2>&1
*/5 * * * * root /opt/observium/discovery.php -h new >> /dev/null 2>&1
*/5 * * * * root /opt/observium/poller-wrapper.py 1 >> /dev/null 2>&1
So these
cron
jobs are in a file I created located at /etc/cron.d/Observium. Do I need to move them?
Thanks, Jason
FROM: observium [mailto:observium-bounces@observium.org observium-bounces@observium.org] ON BEHALF OF Adam Armstrong SENT: Thursday, December 05, 2013 3:39 PM TO: Observium Network Observation System SUBJECT: Re: [Observium] Graph Data only displays -nan
So where did you put the observium from jobs...?
Adam.
Jason Ross jross@medicalteams.org wrote:
Sorry it’s a screenshot instead of text…don’t have an easy way to grab files off that server yet. Here is the output.
FROM: observium [mailto:observium-bounces@observium.org observium-bounces@observium.org] ON BEHALF OF Tom Laermans SENT: Thursday, December 05, 2013 12:59 PM TO: Observium Network Observation System SUBJECT: Re: [Observium] Graph Data only displays -nan
Please paste the output of this command: c
at
/etc/crontab
Thanks, Tom
On 05/12/2013 21:40, Jason Ross wrote:
First, I must apologize for yet another question about “graphs not working”. However, I have read everything I can find in the mail archives, in forums, and have reinstalled multiple times following the instructions exactly. Each time with the –nan listed for all data points. Verified permissions on the rrd and tmp folders and both match the same user/group as what everything is running as. I eventually resorted to installing and running everything as root to try and resolve permission errors. Once I figure out what’s wrong I’ll go back to std user. Sorry for the long email, but I wanted to include everything I know so far.
Monitoring Host:
Ubuntu 13.04
Observium 13.12.4811
Virtual Machine on Hyper-V
Currently Monitored Devices:
3 HP Procurve Switches
1 Ricoh Copier
2 Sonicwall Firewalls
Testing results thus far:
Real-time graphing works for each device.
Every other graph is drawn, but has “-nan” for each data point.
Same for each device.
- Prior to installing jpgraph (to get billing to work) all devices
did not list traffic data under the Ports tab.
- Post jpgraph install and config, traffic info under Ports tab works
for Ricoh Copier and 1 of 3 HP Procurve switches, but no other devices. Only 0 bps is listed.
- Enabled rrdcached in the config file with adding
$config['rrdcached'] = "unix:/var/run/rrdcached.sock";.
- Ran discovery and polling for everything again and all devices list
stats for traffic under Ports tab.
Billing still doesn’t capture traffic data on any device.
Billing Accurate Gr
aphs
gives an error of 25121 – “Empty input data array specified for plot. Must have at least one data point.”
I believe billing errors may be related to the rest.
I ran discovery and polling in debug mode writing to text files and it appears that the data is being pulled from the device correctly. It also looks like it writes the data into the rrd device file and updates the mysql database without showing any errors. Thus, I’m perplexed as to what it could be and have no direction to look into… Help would be appreciated.
Thanks, Jason
observium mailing list
observium@observium.org
http://postman.memetic.org/cgi-bin/mailman/listinfo/observium [1]
observium mailing list observium@observium.org http://postman.memetic.org/cgi-bin/mailman/listinfo/observium [1]
-- Sent from my Android device with K-9 Mail. Please excuse my brevity.
Links:
[1] http://postman.memetic.org/cgi-bin/mailman/listinfo/observium
observium mailing list observium@observium.org http://postman.memetic.org/cgi-bin/mailman/listinfo/observium
observium mailing list observium@observium.org http://postman.memetic.org/cgi-bin/mailman/listinfo/observium
observium mailing list observium@observium.org http://postman.memetic.org/cgi-bin/mailman/listinfo/observium
-- Sent from my Android device with K-9 Mail. Please excuse my brevity.
observium mailing list observium@observium.org http://postman.memetic.org/cgi-bin/mailman/listinfo/observium
Mark, Poller py files?
From: observium [mailto:observium-bounces@observium.org] On Behalf Of Mark Sent: Tuesday, December 17, 2013 5:47 PM To: Observium Network Observation System Subject: Re: [Observium] Graph Data only displays -nan
I had to do chmod +x on the poller py and the discovery php files and they have been running for almost a week now On Dec 17, 2013 6:21 PM, "Jason Ross" <jross@medicalteams.orgmailto:jross@medicalteams.org> wrote: So if I created the file /etc/cron.d/Observium and entered the cron jobs as in the instructions, why wouldn't they be running?
From: observium [mailto:observium-bounces@observium.orgmailto:observium-bounces@observium.org] On Behalf Of Adam Armstrong Sent: Tuesday, December 17, 2013 4:50 PM To: Observium Network Observation System Subject: Re: [Observium] Graph Data only displays -nan
That is indeed what it would suggest! Jason Ross <jross@medicalteams.orgmailto:jross@medicalteams.org> wrote:
Adam, So while I've been building another server, I noticed that after I add a new device to observum via the web gui, it is displayed in the devices, but after 30 minutes, it still hasn't been polled or discovered. Would this indicate that my cron jobs aren't running as they should be? Last question about this, I promise.
Thanks, Jason
-----Original Message----- From: observium [mailto:observium-bounces@observium.org] On Behalf Of Adam Armstrong Sent: Tuesday, December 17, 2013 3:30 PM
To: Observium Network Observation System Subject: Re: [Observium] Graph Data only displays -nan
Well, it seems to definitely be correctly updating and running the poller.
If your RRDs are being created, then there are no permissions issues (poller runs as root anyways). I really can't see why it's not working, unless your crontab entries are not being run.
If you want to give me access to t
he
server, I can fix and tell everyone what you did wrong! ;P
adam.
On 2013-12-17 23:21, Jason Ross wrote:
Whoops...sorry. Forgot to paste it in.
array(88
port_id => 3
device_id => 1
port_64bit => 1
port_label =>
port_descr_type => null
port_descr_descr => null
port_descr_circuit => null
port_descr_speed => null
port_descr_notes => null
ifDescr => 3
ifName => 3
portName => null
ifIndex => 3
ifSpeed => 100000000
ifConnectorPresent => true
ifPromiscuousMode => true
ifHighSpeed => 100
ifOperStatus => up
ifAdminStatus => up
ifDuplex => fullDuplex
ifMtu => 1514
ifType => ethernetCsmacd
ifAlias =>
ifPhysAddress => 00110ae4e7fd
ifHardType => null
ifLastChange => 2013-12-17 06:38:12
date-8hr America/Los_Angeles (UTC-8)
ifVlan => 1
ifTrunk => dot1Q
ifVrf => null
ignore => 0
disabled => 0
detailed => 0
deleted => 0
pagpOperationMode => null
pagpPortState => null
pagpPartnerDeviceId => null
pagpPartnerLearnMethod => null
pagpPartnerIfIndex => null
pagpPartnerGroupIfIndex => null
pagpPartnerDeviceName => null
pagpEthcOperationMode => null
pagpDeviceId => null
pagpGroupIfIndex => null
ifInUcastPkts => 2154573
73
ifInUcastPkts_delta => 203755
ifInUcastPkts_rate => 217
ifOutUcastPkts => 304943357
ifOutUcastPkts_delta => 291120
ifOutUcastPkts_rate => 310
ifInErrors => 163
ifInErrors_delta => 0
ifInErrors_rate => 0
ifOutErrors => 0
ifOutErrors_delta => 0
ifOutErrors_rate => 0
ifOctets_rate => 384524
ifUcastPkts_rate => 527
ifErrors_rate => 0
ifInOctets => 28916762299
ifInOctets_delta => 27302870
ifInOctets_rate => 29077
ifOutOctets => 353122057304
ifOutOctets_delta => 333765358
ifOutOctets_rate => 355448
ifInOctets_perc => 0
ifOutOctets_perc => 3
poll_time => 1387321711
poll_period => 939
hostname =&g
t;
pdx-sw-dc
human_speed => 100Mbps
human_type => Ethernet
html_class =>
human_mac => 00:11:0a:e4:e7:fd
label => 3
entity_name => 3
entity_shortname => 3
entity_descr =>
admin_status => enabled
table_tab_colour => #194B7F
row_class =>
in_rate => 232616
out_rate => 2843584
bps_in_style => color: #008C00;
bps_out_style => color: #394182;
pps_in_style => color: #740074;
pps_out_style => color: #FF7400;
humanized => true
graph_type => port_errors
FROM: Jason Ross
SENT: Tuesday, December 17, 2013 3:21 PM TO: 'Observium Network Observation System' SUBJECT: RE: [Observium] Graph Data only displays -nan
Well, one last attempt before building aga
in
using vmware instead of hyper-v so I can copy/paste the install guide... Here is the output of clicking on "Data" for a device's port. This has traffic bandwidth info displayed in viewing all ports of the device, but again, only has
"-nan" for data.
To me it looks like the data it needs I there, but maybe I'm missing something? I also just removed the mysql database, deleted the rrd directory, re-created rrd, chown'd it to www-data:www-data, and
recreated the database per the install page, and copied config.php.default over to config.php again. This should be a fresh start for permissions and graphing that we've been discussing correct?
FROM: observium [mailto:observium-bounces@observium.org] ON BEHALF OF
Josh Hopper SENT: Tuesday, December 17, 2013 2:24 PM TO: Observium Network Observation System SUBJECT: Re: [Observium] Graph Data only dis
plays
-nan
Doh! My mistake. I'll use it next quarter. I promise.
--
Sincerely,
Joshua Hopper, A+ CE
_Network Administrator_
420 3rd Ave NW Hickory NC 28601
Office: 828-449-1839x2160tel:828-449-1839x2160 | Cell: 828-855-7565tel:828-855-7565
FROM: observium [mailto:observium-bounces@observium.org] ON BEHALF OF Adam Armstrong SENT: Tuesday, December 17, 2013 5:09 PM TO: Observium Network Observation System
SUBJECT: Re: [Observium] Graph Data only displays -nan
He seems to be using svn :)
Adam.
Josh Hopper <joshhopper@protectplus.commailto:joshhopper@protectplus.com> wrote:
Adam, the Community version is now different. You just have to CHMOD the RRD directory.
Remove SNMP if it applies (as per the guide). But the CHMOD 755 on RRD wasn't in the guide.
--
Sincerely,
Joshua Hopper, A+ CE
_Net
work
Administrator_
420 3rd Ave NW Hickory NC 28601
Office: 828-449-1839x2160tel:828-449-1839x2160 | Cell: 828-855-7565tel:828-855-7565
FROM: observium [mailto:observium-bounces@observium.org] ON BEHALF OF Adam Armstrong SENT: Tuesday, December 17, 2013 5:03 PM TO: Observium Network Observation System
SUBJECT: Re: [Observium] Graph Data only displays -nan
Which version of Ubuntu?
The install guide is copy&paste idiot proof, pretty much!
Adam.
Jason Ross <jross@medicalteams.orgmailto:jross@medicalteams.org> wrote:
Yes, virtualized using hyper-v, but nothing else is on it. Started with a fresh image of Ubuntu server and went right into the Observium install instructions.
FROM: observium [mailto:observium-bounces@observium.org] ON BEHALF OF
Adam Armstrong SENT: Tuesday, December 17, 2013 1:16 PM TO: Observium Network Observation System SUBJECT: Re: [Observium]
Graph
Data only displays -nan
Is this a clean server with nothing else on it?
Jason Ross <jross@medicalteams.orgmailto:jross@medicalteams.org> wrote:
Ok, so I know my graphing issus are permissions related, and I've
checked the rrd folder permissions / tried adjusting them with solutions given to other people with graphing problems. I'm still unable to get anything other than "-nan" into the graphs.
-All graphs write, but no data is displayed.
-Realtime graphs display data
-Traffic stats is being displayed in the "Ports" tab for my devices.
Install Info:
-During last setup/install I enabled root user and installed everything under root. (Was a last ditch effort and I'll change / redo
after I get this working at least once...)
-rrd folder has root:root listed with "ls -la" output. (I tried using www-data:ww-data, Observium:root, et
c with
no success.)
-cron jobs (not using e-tab) had user "root" listed exactly like in the install guide. /etc/cron.d/Observium Currently has no user listed, but it made no difference that I can see.
Today I updated to version 4836 and had "no auth" displayed in the device graphs previews, which I hadn't ever seen before. Seems like it was something that changed from 4811 to 4836 as I hadn't made any
other changes. However, I still only get -nan in the data fields, which furthers my belief that I'm missing something having to do with folder permissions.
Can someone give a list of folders that need to have specific
permissions set? And if you're feeling REALLY generous, maybe even what the permissions should be with knowing that everything was installed using the root user? I'd really love to move past this and start testing Observium!
Thanks, Jason
FROM: observium [mailto:observium-bounces@observium.org] ON BEHALF OF Jason Ross SENT: Friday, December 06, 2013 10:25 AM
TO: Observium Network Observation System SUBJECT: Re: [Observium] Graph Data only displays -nan
Any other ideas or things I can check?
FROM: observium [mailto:observium-bounces@observium.org] ON BEHALF OF
Jason Ross SENT: Thursday, December 05, 2013 3:48 PM TO: Observium Network Observation System SUBJECT: Re: [Observium] Graph Data only displays -nan
Ha! Yeah I can at least pick up on the hints. :-)
FROM: observium [mailto:observium-bounces@observium.org] ON BEHALF OF Adam Armstrong SENT: Thursday, December 05, 2013 3:45 PM TO: Observium Network Observation System
SUBJECT: Re: [Observium] Graph Data only displays -nan
No, that is correct.
Some people insist on trying to pu
t them
in a user cron file with crontab -e, very common error, hence the big red box!
Adam.
Jason Ross <jross@medicalteams.orgmailto:jross@medicalteams.org> wrote:
Not sure if you meant cron jobs instead of from jobs, but it seems like you may have. I followed the instructions:
Add cron jobs, create a new file /etc/cron.d/observium with the following contents:
IMPORTANT!
Please note that the below example includes a username, so will only work in /etc/crontab or /etc/cron.d/observium. It will NOT work in a user crontab edited with crontab -e.
33 */6 * * * root /opt/observium/discovery.php -h all >> /dev/null
2>&1
*/5 * * * * root /opt/observium/discovery.php -h new >> /dev/null 2>&1
*/5 * * * * root /opt/observium/poller-wrapper.pyhttp://poller-wrapper.py 1 >> /dev/null 2>&1
So these
cron
jobs are in a file I created located at /etc/cron.d/Observium. Do I need to move them?
Thanks, Jason
FROM: observium [mailto:observium-bounces@observium.org] ON BEHALF OF
Adam Armstrong SENT: Thursday, December 05, 2013 3:39 PM TO: Observium Network Observation System SUBJECT: Re: [Observium] Graph Data only displays -nan
So where did you put the observium from jobs...?
Adam.
Jason Ross <jross@medicalteams.orgmailto:jross@medicalteams.org> wrote:
Sorry it's a screenshot instead of text...don't have an easy way to grab files off that server yet. Here is the output.
FROM: observium [mailto:observium-bounces@observium.org] ON BEHALF OF Tom Laermans SENT: Thursday, December 05, 2013 12:59 PM TO: Observium Network Observation System
SUBJECT: Re: [Observium] Graph Data only displays -nan
Please paste the output of this command: c
at
/etc/crontab
Thanks, Tom
On 05/12/2013 21:40, Jason Ross wrote:
First, I must apologize for yet another question about "graphs not working". However, I have read everything I can find in the mail
archives, in forums, and have reinstalled multiple times following the instructions exactly. Each time with the -nan listed for all data points. Verified permissions on the rrd and tmp folders and both match
the same user/group as what everything is running as. I eventually resorted to installing and running everything as root to try and resolve permission errors. Once I figure out what's wrong I'll go back to std user. Sorry for the long email, but I wanted to include
everything I know so far.
Monitoring Host:
Ubuntu 13.04
Observium 13.12.4811
Virtual Machine on Hyper-V
Currently Monitored Devices:
3 HP Procurve Switches
1 Ricoh Copier
2 Sonicwall Firewalls
Testing results thus far:
1. Real-time graphing works for each device.
2. Every other graph is drawn, but has "-nan" for each data point. Same for each device.
3. Prior to installing jpgraph (to get billing to work) all devices did not list traffic data under the Ports tab.
4. Post jpgraph install and config, traffic info under Ports tab works for Ricoh Copier and 1 of 3 HP Procurve switches, but no other devices.
Only 0 bps is listed.
5. Enabled rrdcached in the config file with adding $config['rrdcached'] = "unix:/var/run/rrdcached.sock";.
6. Ran discovery and polling for everything again and all devices list
stats for traffic under Ports tab.
7. Billing still doesn't capture traffic data on any device.
8. Billing Accurate Gr
aphs
gives an error of 25121 - "Empty input data array specified for plot. Must have at least one data point."
I believe billing errors may be related to the rest.
I ran discovery and polling in debug mode writing to text files and it
appears that the data is being pulled from the device correctly. It also looks like it writes the data into the rrd device file and updates the mysql database without showing any errors. Thus, I'm perplexed as to what it could be and have no direction to look into...
Help would be appreciated.
Thanks, Jason
________________________________
observium mailing list
observium@observium.orgmailto:observium@observium.org
http://postman.memetic.org/cgi-bin/mailman/listinfo/observium [1]
-------------------------
observium mailing list observium@observium.orgmailto:observium@observium.org http://postman.memetic.org/cgi-bin/mailman/listinfo/observium [1]
-- Sent from my Android device with K-9 Mail. Please excuse my brevity.
Links: ------ [1] http://postman.memetic.org/cgi-bin/mailman/listinfo/observium
________________________________
observium mailing list observium@observium.orgmailto:observium@observium.org http://postman.memetic.org/cgi-bin/mailman/listinfo/observium
________________________________
observium mailing list observium@observium.orgmailto:observium@observium.org http://postman.memetic.org/cgi-bin/mailman/listinfo/observium
________________________________
observium mailing list observium@observium.orgmailto:observium@observium.org http://postman.memetic.org/cgi-bin/mailman/listinfo/observium
-- Sent from my Android device with K-9 Mail. Please excuse my brevity.
_______________________________________________ observium mailing list observium@observium.orgmailto:observium@observium.org http://postman.memetic.org/cgi-bin/mailman/listinfo/observium
In /opt/observium On Dec 17, 2013 7:00 PM, "Jason Ross" jross@medicalteams.org wrote:
Mark,
Poller py files?
*From:* observium [mailto:observium-bounces@observium.org] *On Behalf Of * Mark *Sent:* Tuesday, December 17, 2013 5:47 PM *To:* Observium Network Observation System *Subject:* Re: [Observium] Graph Data only displays -nan
I had to do chmod +x on the poller py and the discovery php files and they have been running for almost a week now
On Dec 17, 2013 6:21 PM, "Jason Ross" jross@medicalteams.org wrote:
So if I created the file /etc/cron.d/Observium and entered the cron jobs as in the instructions, why wouldn’t they be running?
*From:* observium [mailto:observium-bounces@observium.org] *On Behalf Of *Adam Armstrong *Sent:* Tuesday, December 17, 2013 4:50 PM *To:* Observium Network Observation System *Subject:* Re: [Observium] Graph Data only displays -nan
That is indeed what it would suggest!
Jason Ross jross@medicalteams.org wrote:
Adam, So while I've been building another server, I noticed that after I add a new device to observum via the web gui, it is displayed in the devices, but after 30 minutes, it still hasn't been polled or discovered. Would this indicate that my cron jobs aren't running as they should be? Last question about this, I promise.
Thanks, Jason
-----Original Message----- From: observium [mailto:observium-bounces@observium.org observium-bounces@observium.org] On Behalf Of Adam Armstrong Sent: Tuesday, December 17, 2013 3:30 PM
To: Observium Network Observation System Subject: Re: [Observium] Graph Data only displays -nan
Well, it seems to definitely be correctly updating and running the poller.
If your RRDs are being created, then there are no permissions issues (poller runs as root anyways). I really can't see why it's not working, unless your crontab entries are not being run.
If you want to give me access to t
he
server, I can fix and tell everyone what you did wrong! ;P
adam.
On 2013-12-17 23:21, Jason Ross wrote:
Whoops…sorry. Forgot to paste it in.
array(88
port_id => 3
device_id => 1
port_64bit => 1
port_label =>
port_descr_type => null
port_descr_descr => null
port_descr_circuit => null
port_descr_speed => null
port_descr_notes => null
ifDescr => 3
ifName => 3
portName => null
ifIndex => 3
ifSpeed => 100000000
ifConnectorPresent => true
ifPromiscuousMode => true
ifHighSpeed => 100
ifOperStatus => up
ifAdminStatus => up
ifDuplex => fullDuplex
ifMtu => 1514
ifType => ethernetCsmacd
ifAlias =>
ifPhysAddress => 00110ae4e7fd
ifHardType => null
ifLastChange => 2013-12-17 06:38:12
date-8hr America/Los_Angeles (UTC-8)
ifVlan => 1
ifTrunk => dot1Q
ifVrf => null
ignore => 0
disabled => 0
detailed => 0
deleted => 0
pagpOperationMode => null
pagpPortState => null
pagpPartnerDeviceId => null
pagpPartnerLearnMethod => null
pagpPartnerIfIndex => null
pagpPartnerGroupIfIndex => null
pagpPartnerDeviceName => null
pagpEthcOperationMode => null
pagpDeviceId => null
pagpGroupIfIndex => null
ifInUcastPkts => 2154573
73
ifInUcastPkts_delta => 203755
ifInUcastPkts_rate => 217
ifOutUcastPkts => 304943357
ifOutUcastPkts_delta => 291120
ifOutUcastPkts_rate => 310
ifInErrors => 163
ifInErrors_delta => 0
ifInErrors_rate => 0
ifOutErrors => 0
ifOutErrors_delta => 0
ifOutErrors_rate => 0
ifOctets_rate => 384524
ifUcastPkts_rate => 527
ifErrors_rate => 0
ifInOctets => 28916762299
ifInOctets_delta => 27302870
ifInOctets_rate => 29077
ifOutOctets => 353122057304
ifOutOctets_delta => 333765358
ifOutOctets_rate => 355448
ifInOctets_perc => 0
ifOutOctets_perc => 3
poll_time => 1387321711
poll_period => 939
hostname =&g
t;
pdx-sw-dc
human_speed => 100Mbps
human_type => Ethernet
html_class =>
human_mac => 00:11:0a:e4:e7:fd
label => 3
entity_name => 3
entity_shortname => 3
entity_descr =>
admin_status => enabled
table_tab_colour => #194B7F
row_class =>
in_rate => 232616
out_rate => 2843584
bps_in_style => color: #008C00;
bps_out_style => color: #394182;
pps_in_style => color: #740074;
pps_out_style => color: #FF7400;
humanized => true
graph_type => port_errors
FROM: Jason Ross
SENT: Tuesday, December 17, 2013 3:21 PM TO: 'Observium Network Observation System' SUBJECT: RE: [Observium] Graph Data only displays -nan
Well, one last attempt before building aga
in
using vmware instead of hyper-v so I can copy/paste the install guide… Here is the output of clicking on “Data” for a device’s port. This has traffic bandwidth info displayed in viewing all ports of the device, but again, only has
“-nan” for data.
To me it looks like the data it needs I there, but maybe I’m missing something? I also just removed the mysql database, deleted the rrd directory, re-created rrd, chown’d it to www-data:www-data, and
recreated the database per the install page, and copied config.php.default over to config.php again. This should be a fresh start for permissions and graphing that we’ve been discussing correct?
FROM: observium [mailto:observium-bounces@observium.org observium-bounces@observium.org] ON BEHALF OF
Josh Hopper SENT: Tuesday, December 17, 2013 2:24 PM TO: Observium Network Observation System SUBJECT: Re: [Observium] Graph Data only dis
plays
-nan
Doh! My mistake. I’ll use it next quarter. I promise.
--
Sincerely,
Joshua Hopper, A+ CE
_Network Administrator_
420 3rd Ave NW Hickory NC 28601
Office: 828-449-1839x2160 | Cell: 828-855-7565
FROM: observium [mailto:observium-bounces@observium.org observium-bounces@observium.org] ON BEHALF OF Adam Armstrong SENT: Tuesday, December 17, 2013 5:09 PM TO: Observium Network Observation System
SUBJECT: Re: [Observium] Graph Data only displays -nan
He seems to be using svn :)
Adam.
Josh Hopper joshhopper@protectplus.com wrote:
Adam, the Community version is now different. You just have to CHMOD the RRD directory.
Remove SNMP if it applies (as per the guide). But the CHMOD 755 on RRD wasn’t in the guide.
--
Sincerely,
Joshua Hopper, A+ CE
_Net
work
Administrator_
420 3rd Ave NW Hickory NC 28601
Office: 828-449-1839x2160 | Cell: 828-855-7565
FROM: observium [mailto:observium-bounces@observium.org observium-bounces@observium.org] ON BEHALF OF Adam Armstrong SENT: Tuesday, December 17, 2013 5:03 PM TO: Observium Network Observation System
SUBJECT: Re: [Observium] Graph Data only displays -nan
Which version of Ubuntu?
The install guide is copy&paste idiot proof, pretty much!
Adam.
Jason Ross jross@medicalteams.org wrote:
Yes, virtualized using hyper-v, but nothing else is on it. Started with a fresh image of Ubuntu server and went right into the Observium install instructions.
FROM: observium [mailto:observium-bounces@observium.org observium-bounces@observium.org] ON BEHALF OF
Adam Armstrong SENT: Tuesday, December 17, 2013 1:16 PM TO: Observium Network Observation System SUBJECT: Re: [Observium]
Graph
Data only displays -nan
Is this a clean server with nothing else on it?
Jason Ross jross@medicalteams.org wrote:
Ok, so I know my graphing issus are permissions related, and I’ve
checked the rrd folder permissions / tried adjusting them with solutions given to other people with graphing problems. I’m still unable to get anything other than “-nan” into the graphs.
-All graphs write, but no data is displayed.
-Realtime graphs display data
-Traffic stats is being displayed in the “Ports” tab for my devices.
Install Info:
-During last setup/install I enabled root user and installed everything under root. (Was a last ditch effort and I’ll change / redo
after I get this working at least once…)
-rrd folder has root:root listed with “ls -la” output. (I tried using www-data:ww-data, Observium:root, et
c with
no success.)
-cron jobs (not using e-tab) had user “root” listed exactly like in the install guide. /etc/cron.d/Observium Currently has no user listed, but it made no difference that I can see.
Today I updated to version 4836 and had “no auth” displayed in the device graphs previews, which I hadn’t ever seen before. Seems like it was something that changed from 4811 to 4836 as I hadn’t made any
other changes. However, I still only get –nan in the data fields, which furthers my belief that I’m missing something having to do with folder permissions.
Can someone give a list of folders that need to have specific
permissions set? And if you’re feeling REALLY generous, maybe even what the permissions should be with knowing that everything was installed using the root user? I’d really love to move past this and start testing Observium!
Thanks, Jason
FROM: observium [mailto:observium-bounces@observium.org observium-bounces@observium.org] ON BEHALF OF Jason Ross SENT: Friday, December 06, 2013 10:25 AM
TO: Observium Network Observation System SUBJECT: Re: [Observium] Graph Data only displays -nan
Any other ideas or things I can check?
FROM: observium [mailto:observium-bounces@observium.org observium-bounces@observium.org] ON BEHALF OF
Jason Ross SENT: Thursday, December 05, 2013 3:48 PM TO: Observium Network Observation System SUBJECT: Re: [Observium] Graph Data only displays -nan
Ha! Yeah I can at least pick up on the hints. :-)
FROM: observium [mailto:observium-bounces@observium.org observium-bounces@observium.org] ON BEHALF OF Adam Armstrong SENT: Thursday, December 05, 2013 3:45 PM TO: Observium Network Observation System
SUBJECT: Re: [Observium] Graph Data only displays -nan
No, that is correct.
Some people insist on trying to pu
t them
in a user cron file with crontab -e, very common error, hence the big red box!
Adam.
Jason Ross jross@medicalteams.org wrote:
Not sure if you meant cron jobs instead of from jobs, but it seems like you may have. I followed the instructions:
Add cron jobs, create a new file /etc/cron.d/observium with the following contents:
IMPORTANT!
Please note that the below example includes a username, so will only work in /etc/crontab or /etc/cron.d/observium. It will NOT work in a user crontab edited with crontab -e.
33 */6 * * * root /opt/observium/discovery.php -h all >> /dev/null
2>&1
*/5 * * * * root /opt/observium/discovery.php -h new >> /dev/null 2>&1
*/5 * * * * root /opt/observium/poller-wrapper.py 1 >> /dev/null 2>&1
So these
cron
jobs are in a file I created located at /etc/cron.d/Observium. Do I need to move them?
Thanks, Jason
FROM: observium [mailto:observium-bounces@observium.org observium-bounces@observium.org] ON BEHALF OF
Adam Armstrong SENT: Thursday, December 05, 2013 3:39 PM TO: Observium Network Observation System SUBJECT: Re: [Observium] Graph Data only displays -nan
So where did you put the observium from jobs...?
Adam.
Jason Ross jross@medicalteams.org wrote:
Sorry it’s a screenshot instead of text…don’t have an easy way to grab files off that server yet. Here is the output.
FROM: observium [mailto:observium-bounces@observium.org observium-bounces@observium.org] ON BEHALF OF Tom Laermans SENT: Thursday, December 05, 2013 12:59 PM TO: Observium Network Observation System
SUBJECT: Re: [Observium] Graph Data only displays -nan
Please paste the output of this command: c
at
/etc/crontab
Thanks, Tom
On 05/12/2013 21:40, Jason Ross wrote:
First, I must apologize for yet another question about “graphs not working”. However, I have read everything I can find in the mail
archives, in forums, and have reinstalled multiple times following the instructions exactly. Each time with the –nan listed for all data points. Verified permissions on the rrd and tmp folders and both match
the same user/group as what everything is running as. I eventually resorted to installing and running everything as root to try and resolve permission errors. Once I figure out what’s wrong I’ll go back to std user. Sorry for the long email, but I wanted to include
everything I know so far.
Monitoring Host:
Ubuntu 13.04
Observium 13.12.4811
Virtual Machine on Hyper-V
Currently Monitored Devices:
3 HP Procurve Switches
1 Ricoh Copier
2 Sonicwall Firewalls
Testing results thus far:
Real-time graphing works for each device.
Every other graph is drawn, but has “-nan” for each data point.
Same for each device.
- Prior to installing jpgraph (to get billing to work) all devices
did not list traffic data under the Ports tab.
- Post jpgraph install and config, traffic info under Ports tab works
for Ricoh Copier and 1 of 3 HP Procurve switches, but no other devices.
Only 0 bps is listed.
- Enabled rrdcached in the config file with adding
$config['rrdcached'] = "unix:/var/run/rrdcached.sock";.
- Ran discovery and polling for everything again and all devices list
stats for traffic under Ports tab.
Billing still doesn’t capture traffic data on any device.
Billing Accurate Gr
aphs
gives an error of 25121 – “Empty input data array specified for plot. Must have at least one data point.”
I believe billing errors may be related to the rest.
I ran discovery and polling in debug mode writing to text files and it
appears that the data is being pulled from the device correctly. It also looks like it writes the data into the rrd device file and updates the mysql database without showing any errors. Thus, I’m perplexed as to what it could be and have no direction to look into…
Help would be appreciated.
Thanks, Jason
observium mailing list
observium@observium.org
http://postman.memetic.org/cgi-bin/mailman/listinfo/observium [1]
observium mailing list observium@observium.org http://postman.memetic.org/cgi-bin/mailman/listinfo/observium [1]
-- Sent from my Android device with K-9 Mail. Please excuse my brevity.
Links:
[1] http://postman.memetic.org/cgi-bin/mailman/listinfo/observium
observium mailing list observium@observium.org http://postman.memetic.org/cgi-bin/mailman/listinfo/observium
observium mailing list observium@observium.org http://postman.memetic.org/cgi-bin/mailman/listinfo/observium
observium mailing list observium@observium.org http://postman.memetic.org/cgi-bin/mailman/listinfo/observium
-- Sent from my Android device with K-9 Mail. Please excuse my brevity.
observium mailing list observium@observium.org http://postman.memetic.org/cgi-bin/mailman/listinfo/observium
observium mailing list observium@observium.org http://postman.memetic.org/cgi-bin/mailman/listinfo/observium
Its poller.php and discovery.php
cd /opt/observium ls
Its there.
Since the split from free to liscensed you have to chmod some files to get it to work. I'm not sure why. :/
-- Sincerely, Joshua Hopper, A+ CE Network Administrator [cid:image001.jpg@01CEFB7F.7F379310] 420 3rd Ave NW Hickory NC 28601 Office: 828-449-1839x2160 | Cell: 828-855-7565
From: observium [mailto:observium-bounces@observium.org] On Behalf Of Mark Sent: Tuesday, December 17, 2013 9:03 PM To: Observium Network Observation System Subject: Re: [Observium] Graph Data only displays -nan
In /opt/observium On Dec 17, 2013 7:00 PM, "Jason Ross" <jross@medicalteams.orgmailto:jross@medicalteams.org> wrote: Mark, Poller py files?
From: observium [mailto:observium-bounces@observium.orgmailto:observium-bounces@observium.org] On Behalf Of Mark Sent: Tuesday, December 17, 2013 5:47 PM To: Observium Network Observation System Subject: Re: [Observium] Graph Data only displays -nan
I had to do chmod +x on the poller py and the discovery php files and they have been running for almost a week now On Dec 17, 2013 6:21 PM, "Jason Ross" <jross@medicalteams.orgmailto:jross@medicalteams.org> wrote: So if I created the file /etc/cron.d/Observium and entered the cron jobs as in the instructions, why wouldn't they be running?
From: observium [mailto:observium-bounces@observium.orgmailto:observium-bounces@observium.org] On Behalf Of Adam Armstrong Sent: Tuesday, December 17, 2013 4:50 PM To: Observium Network Observation System Subject: Re: [Observium] Graph Data only displays -nan
That is indeed what it would suggest! Jason Ross <jross@medicalteams.orgmailto:jross@medicalteams.org> wrote:
Adam, So while I've been building another server, I noticed that after I add a new device to observum via the web gui, it is displayed in the devices, but after 30 minutes, it still hasn't been polled or discovered. Would this indicate that my cron jobs aren't running as they should be? Last question about this, I promise.
Thanks, Jason
-----Original Message----- From: observium [mailto:observium-bounces@observium.org] On Behalf Of Adam Armstrong
Sent: Tuesday, December 17, 2013 3:30 PM
To: Observium Network Observation System Subject: Re: [Observium] Graph Data only displays -nan
Well, it seems to definitely be correctly updating and running the poller.
If your RRDs are being created, then there are no permissions issues (poller runs as root anyways). I really can't see why it's not working, unless your crontab entries are not being run.
If you want to give me access to t
he
server, I can fix and tell everyone what you did wrong! ;P
adam.
On 2013-12-17 23:21, Jason Ross wrote:
Whoops...sorry. Forgot to paste it in.
array(88
port_id => 3
device_id => 1
port_64bit => 1
port_label =>
port_descr_type => null
port_descr_descr => null
port_descr_circuit => null
port_descr_speed => null
port_descr_notes => null
ifDescr => 3
ifName => 3
portName => null
ifIndex => 3
ifSpeed => 100000000
ifConnectorPresent => true
ifPromiscuousMode => true
ifHighSpeed => 100
ifOperStatus => up
ifAdminStatus => up
ifDuplex => fullDuplex
ifMtu => 1514
ifType => ethernetCsmacd
ifAlias =>
ifPhysAddress => 00110ae4e7fd
ifHardType => null
ifLastChange => 2013-12-17 06:38:12
date-8hr America/Los_Angeles (UTC-8)
ifVlan => 1
ifTrunk => dot1Q
ifVrf => null
ignore => 0
disabled => 0
detailed => 0
deleted => 0
pagpOperationMode => null
pagpPortState => null
pagpPartnerDeviceId => null
pagpPartnerLearnMethod => null
pagpPartnerIfIndex => null
pagpPartnerGroupIfIndex => null
pagpPartnerDeviceName => null
pagpEthcOperationMode => null
pagpDeviceId => null
pagpGroupIfIndex => null
ifInUcastPkts => 2154573
73
ifInUcastPkts_delta => 203755
ifInUcastPkts_rate => 217
ifOutUcastPkts => 304943357
ifOutUcastPkts_delta => 291120
ifOutUcastPkts_rate => 310
ifInErrors => 163
ifInErrors_delta => 0
ifInErrors_rate => 0
ifOutErrors => 0
ifOutErrors_delta => 0
ifOutErrors_rate => 0
ifOctets_rate => 384524
ifUcastPkts_rate => 527
ifErrors_rate => 0
ifInOctets => 28916762299
ifInOctets_delta => 27302870
ifInOctets_rate => 29077
ifOutOctets => 353122057304
ifOutOctets_delta => 333765358
ifOutOctets_rate => 355448
ifInOctets_perc => 0
ifOutOctets_perc => 3
poll_time => 1387321711
poll_period => 939
hostname =&g
t;
pdx-sw-dc
human_speed => 100Mbps
human_type => Ethernet
html_class =>
human_mac => 00:11:0a:e4:e7:fd
label => 3
entity_name => 3
entity_shortname => 3
entity_descr =>
admin_status => enabled
table_tab_colour => #194B7F
row_class =>
in_rate => 232616
out_rate => 2843584
bps_in_style => color: #008C00;
bps_out_style => color: #394182;
pps_in_style => color: #740074;
pps_out_style => color: #FF7400;
humanized => true
graph_type => port_errors
FROM: Jason Ross
SENT: Tuesday, December 17, 2013 3:21 PM TO: 'Observium Network Observation System' SUBJECT: RE: [Observium] Graph Data only displays -nan
Well, one last attempt before building aga
in
using vmware instead of hyper-v so I can copy/paste the install guide... Here is the output of clicking on "Data" for a device's port. This has traffic bandwidth info displayed in viewing all ports of the device, but again, only has
"-nan" for data.
To me it looks like the data it needs I there, but maybe I'm missing something? I also just removed the mysql database, deleted the rrd directory, re-created rrd, chown'd it to www-data:www-data, and
recreated the database per the install page, and copied config.php.default over to config.php again. This should be a fresh start for permissions and graphing that we've been discussing correct?
FROM: observium [mailto:observium-bounces@observium.org] ON BEHALF OF
Josh Hopper SENT: Tuesday, December 17, 2013 2:24 PM TO: Observium Network Observation System SUBJECT: Re: [Observium] Graph Data only dis
plays
-nan
Doh! My mistake. I'll use it next quarter. I promise.
--
Sincerely,
Joshua Hopper, A+ CE
_Network Administrator_
420 3rd Ave NW Hickory NC 28601
Office: 828-449-1839x2160tel:828-449-1839x2160 | Cell: 828-855-7565tel:828-855-7565
FROM: observium [mailto:observium-bounces@observium.org] ON BEHALF OF Adam Armstrong SENT: Tuesday, December 17, 2013 5:09 PM TO: Observium Network Observation System
SUBJECT: Re: [Observium] Graph Data only displays -nan
He seems to be using svn :)
Adam.
Josh Hopper <joshhopper@protectplus.commailto:joshhopper@protectplus.com> wrote:
Adam, the Community version is now different. You just have to CHMOD the RRD directory.
Remove SNMP if it applies (as per the guide). But the CHMOD 755 on RRD wasn't in the guide.
--
Sincerely,
Joshua Hopper, A+ CE
_Net
work
Administrator_
420 3rd Ave NW Hickory NC 28601
Office: 828-449-1839x2160tel:828-449-1839x2160 | Cell: 828-855-7565tel:828-855-7565
FROM: observium [mailto:observium-bounces@observium.org] ON BEHALF OF Adam Armstrong SENT: Tuesday, December 17, 2013 5:03 PM TO: Observium Network Observation System
SUBJECT: Re: [Observium] Graph Data only displays -nan
Which version of Ubuntu?
The install guide is copy&paste idiot proof, pretty much!
Adam.
Jason Ross <jross@medicalteams.orgmailto:jross@medicalteams.org> wrote:
Yes, virtualized using hyper-v, but nothing else is on it. Started with a fresh image of Ubuntu server and went right into the Observium install instructions.
FROM: observium [mailto:observium-bounces@observium.org] ON BEHALF OF
Adam Armstrong SENT: Tuesday, December 17, 2013 1:16 PM TO: Observium Network Observation System SUBJECT: Re: [Observium]
Graph
Data only displays -nan
Is this a clean server with nothing else on it?
Jason Ross <jross@medicalteams.orgmailto:jross@medicalteams.org> wrote:
Ok, so I know my graphing issus are permissions related, and I've
checked the rrd folder permissions / tried adjusting them with solutions given to other people with graphing problems. I'm still unable to get anything other than "-nan" into the graphs.
-All graphs write, but no data is displayed.
-Realtime graphs display data
-Traffic stats is being displayed in the "Ports" tab for my devices.
Install Info:
-During last setup/install I enabled root user and installed everything under root. (Was a last ditch effort and I'll change / redo
after I get this working at least once...)
-rrd folder has root:root listed with "ls -la" output. (I tried using www-data:ww-data, Observium:root, et
c with
no success.)
-cron jobs (not using e-tab) had user "root" listed exactly like in the install guide. /etc/cron.d/Observium Currently has no user listed, but it made no difference that I can see.
Today I updated to version 4836 and had "no auth" displayed in the device graphs previews, which I hadn't ever seen before. Seems like it was something that changed from 4811 to 4836 as I hadn't made any
other changes. However, I still only get -nan in the data fields, which furthers my belief that I'm missing something having to do with folder permissions.
Can someone give a list of folders that need to have specific
permissions set? And if you're feeling REALLY generous, maybe even what the permissions should be with knowing that everything was installed using the root user? I'd really love to move past this and
start testing Observium!
Thanks, Jason
FROM: observium [mailto:observium-bounces@observium.org] ON BEHALF OF Jason Ross SENT: Friday, December 06, 2013 10:25 AM
TO: Observium Network Observation System SUBJECT: Re: [Observium] Graph Data only displays -nan
Any other ideas or things I can check?
FROM: observium [mailto:observium-bounces@observium.org] ON BEHALF OF
Jason Ross SENT: Thursday, December 05, 2013 3:48 PM TO: Observium Network Observation System SUBJECT: Re: [Observium] Graph Data only displays -nan
Ha! Yeah I can at least pick up on the hints. :-)
FROM: observium [mailto:observium-bounces@observium.org] ON BEHALF OF Adam Armstrong SENT: Thursday, December 05, 2013 3:45 PM TO: Observium Network Observation System
SUBJECT: Re: [Observium] Graph Data only displays -nan
No, that is correct.
Some people insist on trying to pu
t them
in a user cron file with crontab -e, very common error, hence the big red box!
Adam.
Jason Ross <jross@medicalteams.orgmailto:jross@medicalteams.org> wrote:
Not sure if you meant cron jobs instead of from jobs, but it seems like you may have. I followed the instructions:
Add cron jobs, create a new file /etc/cron.d/observium with the following contents:
IMPORTANT!
Please note that the below example includes a username, so will only work in /etc/crontab or /etc/cron.d/observium. It will NOT work in a user crontab edited with crontab -e.
33 */6 * * * root /opt/observium/discovery.php -h all >> /dev/null
2>&1
*/5 * * * * root /opt/observium/discovery.php -h new >> /dev/null 2>&1
*/5 * * * * root /opt/observium/poller-wrapper.pyhttp://poller-wrapper.py 1 >> /dev/null 2>&1
So these
cron
jobs are in a file I created located at /etc/cron.d/Observium. Do I need to move them?
Thanks, Jason
FROM: observium [mailto:observium-bounces@observium.org] ON BEHALF OF
Adam Armstrong SENT: Thursday, December 05, 2013 3:39 PM TO: Observium Network Observation System SUBJECT: Re: [Observium] Graph Data only displays -nan
So where did you put the observium from jobs...?
Adam.
Jason Ross <jross@medicalteams.orgmailto:jross@medicalteams.org> wrote:
Sorry it's a screenshot instead of text...don't have an easy way to grab files off that server yet. Here is the output.
FROM: observium [mailto:observium-bounces@observium.org] ON BEHALF OF Tom Laermans SENT: Thursday, December 05, 2013 12:59 PM TO: Observium Network Observation System
SUBJECT: Re: [Observium] Graph Data only displays -nan
Please paste the output of this command: c
at
/etc/crontab
Thanks, Tom
On 05/12/2013 21:40, Jason Ross wrote:
First, I must apologize for yet another question about "graphs not working". However, I have read everything I can find in the mail
archives, in forums, and have reinstalled multiple times following the instructions exactly. Each time with the -nan listed for all data points. Verified permissions on the rrd and tmp folders and both match
the same user/group as what everything is running as. I eventually resorted to installing and running everything as root to try and resolve permission errors. Once I figure out what's wrong I'll go back
to std user. Sorry for the long email, but I wanted to include
everything I know so far.
Monitoring Host:
Ubuntu 13.04
Observium 13.12.4811
Virtual Machine on Hyper-V
Currently Monitored Devices:
3 HP Procurve Switches
1 Ricoh Copier
2 Sonicwall Firewalls
Testing results thus far:
1. Real-time graphing works for each device.
2. Every other graph is drawn, but has "-nan" for each data point. Same for each device.
3. Prior to installing jpgraph (to get billing to work) all devices did not list traffic data under the Ports tab.
4. Post jpgraph install and config, traffic info under Ports tab works for Ricoh Copier and 1 of 3 HP Procurve switches, but no other devices.
Only 0 bps is listed.
5. Enabled rrdcached in the config file with adding $config['rrdcached'] = "unix:/var/run/rrdcached.sock";.
6. Ran discovery and polling for everything again and all devices list
stats for traffic under Ports tab.
7. Billing still doesn't capture traffic data on any device.
8. Billing Accurate Gr
aphs
gives an error of 25121 - "Empty input data array specified for plot. Must have at least one data point."
I believe billing errors may be related to the rest.
I ran discovery and polling in debug mode writing to text files and it
appears that the data is being pulled from the device correctly. It also looks like it writes the data into the rrd device file and updates the mysql database without showing any errors. Thus, I'm perplexed as to what it could be and have no direction to look into...
Help would be appreciated.
Thanks, Jason
________________________________
observium mailing list
observium@observium.orgmailto:observium@observium.org
http://postman.memetic.org/cgi-bin/mailman/listinfo/observium [1]
-------------------------
observium mailing list observium@observium.orgmailto:observium@observium.org http://postman.memetic.org/cgi-bin/mailman/listinfo/observium [1]
-- Sent from my Android device with K-9 Mail. Please excuse my brevity.
Links: ------ [1] http://postman.memetic.org/cgi-bin/mailman/listinfo/observium
________________________________
observium mailing list observium@observium.orgmailto:observium@observium.org http://postman.memetic.org/cgi-bin/mailman/listinfo/observium
________________________________
observium mailing list observium@observium.orgmailto:observium@observium.org http://postman.memetic.org/cgi-bin/mailman/listinfo/observium
________________________________
observium mailing list observium@observium.orgmailto:observium@observium.org http://postman.memetic.org/cgi-bin/mailman/listinfo/observium
-- Sent from my Android device with K-9 Mail. Please excuse my brevity.
_______________________________________________ observium mailing list observium@observium.orgmailto:observium@observium.org http://postman.memetic.org/cgi-bin/mailman/listinfo/observium
_______________________________________________ observium mailing list observium@observium.orgmailto:observium@observium.org http://postman.memetic.org/cgi-bin/mailman/listinfo/observium
Yeah, I knew of the files, I just didn't know if poller py files meant the poller-wrapper.py file or if it was some other file...
Success! Chmod +x on the poller.php, discovery.php, and poller-wrapper.py files fixed it. All graphs, except FTB Table Usage, are working correctly. Finally! Thanks everyone for your help...and patience. Maybe someone can add this fix under the FAQ "My graphs don't work" or something? It would have save me hours and you guys a thousand questions. Anyway, thanks again. Jason
From: observium [mailto:observium-bounces@observium.org] On Behalf Of Josh Hopper Sent: Tuesday, December 17, 2013 8:27 PM To: Observium Network Observation System Subject: Re: [Observium] Graph Data only displays -nan
Its poller.php and discovery.php
cd /opt/observium ls
Its there.
Since the split from free to liscensed you have to chmod some files to get it to work. I'm not sure why. :/
-- Sincerely, Joshua Hopper, A+ CE Network Administrator [http://www.protectplus.com/images/ppluslogo.jpg] 420 3rd Ave NW Hickory NC 28601 Office: 828-449-1839x2160 | Cell: 828-855-7565
From: observium [mailto:observium-bounces@observium.org] On Behalf Of Mark Sent: Tuesday, December 17, 2013 9:03 PM To: Observium Network Observation System Subject: Re: [Observium] Graph Data only displays -nan
In /opt/observium On Dec 17, 2013 7:00 PM, "Jason Ross" <jross@medicalteams.orgmailto:jross@medicalteams.org> wrote: Mark, Poller py files?
From: observium [mailto:observium-bounces@observium.orgmailto:observium-bounces@observium.org] On Behalf Of Mark Sent: Tuesday, December 17, 2013 5:47 PM To: Observium Network Observation System Subject: Re: [Observium] Graph Data only displays -nan
I had to do chmod +x on the poller py and the discovery php files and they have been running for almost a week now On Dec 17, 2013 6:21 PM, "Jason Ross" <jross@medicalteams.orgmailto:jross@medicalteams.org> wrote: So if I created the file /etc/cron.d/Observium and entered the cron jobs as in the instructions, why wouldn't they be running?
From: observium [mailto:observium-bounces@observium.orgmailto:observium-bounces@observium.org] On Behalf Of Adam Armstrong Sent: Tuesday, December 17, 2013 4:50 PM To: Observium Network Observation System Subject: Re: [Observium] Graph Data only displays -nan
That is indeed what it would suggest! Jason Ross <jross@medicalteams.orgmailto:jross@medicalteams.org> wrote:
Adam, So while I've been building another server, I noticed that after I add a new device to observum via the web gui, it is displayed in the devices, but after 30 minutes, it still hasn't been polled or discovered. Would this indicate that my cron jobs aren't running as they should be? Last question about this, I promise.
Thanks, Jason
-----Original Message----- From: observium [mailto:observium-bounces@observium.org] On Behalf Of Adam Armstrong
Sent: Tuesday, December 17, 2013 3:30 PM
To: Observium Network Observation System Subject: Re: [Observium] Graph Data only displays -nan
Well, it seems to definitely be correctly updating and running the poller.
If your RRDs are being created, then there are no permissions issues (poller runs as root anyways). I really can't see why it's not working, unless your crontab entries are not being run.
If you want to give me access to t
he
server, I can fix and tell everyone what you did wrong! ;P
adam.
On 2013-12-17 23:21, Jason Ross wrote:
Whoops...sorry. Forgot to paste it in.
array(88
port_id => 3
device_id => 1
port_64bit => 1
port_label =>
port_descr_type => null
port_descr_descr => null
port_descr_circuit => null
port_descr_speed => null
port_descr_notes => null
ifDescr => 3
ifName => 3
portName => null
ifIndex => 3
ifSpeed => 100000000
ifConnectorPresent => true
ifPromiscuousMode => true
ifHighSpeed => 100
ifOperStatus => up
ifAdminStatus => up
ifDuplex => fullDuplex
ifMtu => 1514
ifType => ethernetCsmacd
ifAlias =>
ifPhysAddress => 00110ae4e7fd
ifHardType => null
ifLastChange => 2013-12-17 06:38:12
date-8hr America/Los_Angeles (UTC-8)
ifVlan => 1
ifTrunk => dot1Q
ifVrf => null
ignore => 0
disabled => 0
detailed => 0
deleted => 0
pagpOperationMode => null
pagpPortState => null
pagpPartnerDeviceId => null
pagpPartnerLearnMethod => null
pagpPartnerIfIndex => null
pagpPartnerGroupIfIndex => null
pagpPartnerDeviceName => null
pagpEthcOperationMode => null
pagpDeviceId => null
pagpGroupIfIndex => null
ifInUcastPkts => 2154573
73
ifInUcastPkts_delta => 203755
ifInUcastPkts_rate => 217
ifOutUcastPkts => 304943357
ifOutUcastPkts_delta => 291120
ifOutUcastPkts_rate => 310
ifInErrors => 163
ifInErrors_delta => 0
ifInErrors_rate => 0
ifOutErrors => 0
ifOutErrors_delta => 0
ifOutErrors_rate => 0
ifOctets_rate => 384524
ifUcastPkts_rate => 527
ifErrors_rate => 0
ifInOctets => 28916762299
ifInOctets_delta => 27302870
ifInOctets_rate => 29077
ifOutOctets => 353122057304
ifOutOctets_delta => 333765358
ifOutOctets_rate => 355448
ifInOctets_perc => 0
ifOutOctets_perc => 3
poll_time => 1387321711
poll_period => 939
hostname =&g
t;
pdx-sw-dc
human_speed => 100Mbps
human_type => Ethernet
html_class =>
human_mac => 00:11:0a:e4:e7:fd
label => 3
entity_name => 3
entity_shortname => 3
entity_descr =>
admin_status => enabled
table_tab_colour => #194B7F
row_class =>
in_rate => 232616
out_rate => 2843584
bps_in_style => color: #008C00;
bps_out_style => color: #394182;
pps_in_style => color: #740074;
pps_out_style => color: #FF7400;
humanized => true
graph_type => port_errors
FROM: Jason Ross
SENT: Tuesday, December 17, 2013 3:21 PM TO: 'Observium Network Observation System' SUBJECT: RE: [Observium] Graph Data only displays -nan
Well, one last attempt before building aga
in
using vmware instead of hyper-v so I can copy/paste the install guide... Here is the output of clicking on "Data" for a device's port. This has traffic bandwidth info displayed in viewing all ports of the device, but again, only has
"-nan" for data.
To me it looks like the data it needs I there, but maybe I'm missing something? I also just removed the mysql database, deleted the rrd directory, re-created rrd, chown'd it to www-data:www-data, and
recreated the database per the install page, and copied config.php.default over to config.php again. This should be a fresh start for permissions and graphing that we've been discussing correct?
FROM: observium [mailto:observium-bounces@observium.org] ON BEHALF OF
Josh Hopper SENT: Tuesday, December 17, 2013 2:24 PM TO: Observium Network Observation System SUBJECT: Re: [Observium] Graph Data only dis
plays
-nan
Doh! My mistake. I'll use it next quarter. I promise.
--
Sincerely,
Joshua Hopper, A+ CE
_Network Administrator_
420 3rd Ave NW Hickory NC 28601
Office: 828-449-1839x2160tel:828-449-1839x2160 | Cell: 828-855-7565tel:828-855-7565
FROM: observium [mailto:observium-bounces@observium.org] ON BEHALF OF Adam Armstrong SENT: Tuesday, December 17, 2013 5:09 PM TO: Observium Network Observation System
SUBJECT: Re: [Observium] Graph Data only displays -nan
He seems to be using svn :)
Adam.
Josh Hopper <joshhopper@protectplus.commailto:joshhopper@protectplus.com> wrote:
Adam, the Community version is now different. You just have to CHMOD the RRD directory.
Remove SNMP if it applies (as per the guide). But the CHMOD 755 on RRD wasn't in the guide.
--
Sincerely,
Joshua Hopper, A+ CE
_Net
work
Administrator_
420 3rd Ave NW Hickory NC 28601
Office: 828-449-1839x2160tel:828-449-1839x2160 | Cell: 828-855-7565tel:828-855-7565
FROM: observium [mailto:observium-bounces@observium.org] ON BEHALF OF Adam Armstrong SENT: Tuesday, December 17, 2013 5:03 PM TO: Observium Network Observation System
SUBJECT: Re: [Observium] Graph Data only displays -nan
Which version of Ubuntu?
The install guide is copy&paste idiot proof, pretty much!
Adam.
Jason Ross <jross@medicalteams.orgmailto:jross@medicalteams.org> wrote:
Yes, virtualized using hyper-v, but nothing else is on it. Started with a fresh image of Ubuntu server and went right into the Observium install instructions.
FROM: observium [mailto:observium-bounces@observium.org] ON BEHALF OF
Adam Armstrong SENT: Tuesday, December 17, 2013 1:16 PM TO: Observium Network Observation System SUBJECT: Re: [Observium]
Graph
Data only displays -nan
Is this a clean server with nothing else on it?
Jason Ross <jross@medicalteams.orgmailto:jross@medicalteams.org> wrote:
Ok, so I know my graphing issus are permissions related, and I've
checked the rrd folder permissions / tried adjusting them with solutions given to other people with graphing problems. I'm still unable to get anything other than "-nan" into the graphs.
-All graphs write, but no data is displayed.
-Realtime graphs display data
-Traffic stats is being displayed in the "Ports" tab for my devices.
Install Info:
-During last setup/install I enabled root user and installed everything under root. (Was a last ditch effort and I'll change / redo
after I get this working at least once...)
-rrd folder has root:root listed with "ls -la" output. (I tried using www-data:ww-data, Observium:root, et
c with
no success.)
-cron jobs (not using e-tab) had user "root" listed exactly like in the install guide. /etc/cron.d/Observium Currently has no user listed, but it made no difference that I can see.
Today I updated to version 4836 and had "no auth" displayed in the device graphs previews, which I hadn't ever seen before. Seems like it was something that changed from 4811 to 4836 as I hadn't made any
other changes. However, I still only get -nan in the data fields, which furthers my belief that I'm missing something having to do with folder permissions.
Can someone give a list of folders that need to have specific
permissions set? And if you're feeling REALLY generous, maybe even what the permissions should be with knowing that everything was installed using the root user? I'd really love to move past this and
start testing Observium!
Thanks, Jason
FROM: observium [mailto:observium-bounces@observium.org] ON BEHALF OF Jason Ross SENT: Friday, December 06, 2013 10:25 AM
TO: Observium Network Observation System SUBJECT: Re: [Observium] Graph Data only displays -nan
Any other ideas or things I can check?
FROM: observium [mailto:observium-bounces@observium.org] ON BEHALF OF
Jason Ross SENT: Thursday, December 05, 2013 3:48 PM TO: Observium Network Observation System SUBJECT: Re: [Observium] Graph Data only displays -nan
Ha! Yeah I can at least pick up on the hints. :-)
FROM: observium [mailto:observium-bounces@observium.org] ON BEHALF OF Adam Armstrong SENT: Thursday, December 05, 2013 3:45 PM TO: Observium Network Observation System
SUBJECT: Re: [Observium] Graph Data only displays -nan
No, that is correct.
Some people insist on trying to pu
t them
in a user cron file with crontab -e, very common error, hence the big red box!
Adam.
Jason Ross <jross@medicalteams.orgmailto:jross@medicalteams.org> wrote:
Not sure if you meant cron jobs instead of from jobs, but it seems like you may have. I followed the instructions:
Add cron jobs, create a new file /etc/cron.d/observium with the following contents:
IMPORTANT!
Please note that the below example includes a username, so will only work in /etc/crontab or /etc/cron.d/observium. It will NOT work in a user crontab edited with crontab -e.
33 */6 * * * root /opt/observium/discovery.php -h all >> /dev/null
2>&1
*/5 * * * * root /opt/observium/discovery.php -h new >> /dev/null 2>&1
*/5 * * * * root /opt/observium/poller-wrapper.pyhttp://poller-wrapper.py 1 >> /dev/null 2>&1
So these
cron
jobs are in a file I created located at /etc/cron.d/Observium. Do I need to move them?
Thanks, Jason
FROM: observium [mailto:observium-bounces@observium.org] ON BEHALF OF
Adam Armstrong SENT: Thursday, December 05, 2013 3:39 PM TO: Observium Network Observation System SUBJECT: Re: [Observium] Graph Data only displays -nan
So where did you put the observium from jobs...?
Adam.
Jason Ross <jross@medicalteams.orgmailto:jross@medicalteams.org> wrote:
Sorry it's a screenshot instead of text...don't have an easy way to grab files off that server yet. Here is the output.
FROM: observium [mailto:observium-bounces@observium.org] ON BEHALF OF Tom Laermans SENT: Thursday, December 05, 2013 12:59 PM TO: Observium Network Observation System
SUBJECT: Re: [Observium] Graph Data only displays -nan
Please paste the output of this command: c
at
/etc/crontab
Thanks, Tom
On 05/12/2013 21:40, Jason Ross wrote:
First, I must apologize for yet another question about "graphs not working". However, I have read everything I can find in the mail
archives, in forums, and have reinstalled multiple times following the instructions exactly. Each time with the -nan listed for all data points. Verified permissions on the rrd and tmp folders and both match
the same user/group as what everything is running as. I eventually resorted to installing and running everything as root to try and resolve permission errors. Once I figure out what's wrong I'll go back
to std user. Sorry for the long email, but I wanted to include
everything I know so far.
Monitoring Host:
Ubuntu 13.04
Observium 13.12.4811
Virtual Machine on Hyper-V
Currently Monitored Devices:
3 HP Procurve Switches
1 Ricoh Copier
2 Sonicwall Firewalls
Testing results thus far:
1. Real-time graphing works for each device.
2. Every other graph is drawn, but has "-nan" for each data point. Same for each device.
3. Prior to installing jpgraph (to get billing to work) all devices did not list traffic data under the Ports tab.
4. Post jpgraph install and config, traffic info under Ports tab works for Ricoh Copier and 1 of 3 HP Procurve switches, but no other devices.
Only 0 bps is listed.
5. Enabled rrdcached in the config file with adding $config['rrdcached'] = "unix:/var/run/rrdcached.sock";.
6. Ran discovery and polling for everything again and all devices list
stats for traffic under Ports tab.
7. Billing still doesn't capture traffic data on any device.
8. Billing Accurate Gr
aphs
gives an error of 25121 - "Empty input data array specified for plot. Must have at least one data point."
I believe billing errors may be related to the rest.
I ran discovery and polling in debug mode writing to text files and it
appears that the data is being pulled from the device correctly. It also looks like it writes the data into the rrd device file and updates the mysql database without showing any errors. Thus, I'm perplexed as to what it could be and have no direction to look into...
Help would be appreciated.
Thanks, Jason
________________________________
observium mailing list
observium@observium.orgmailto:observium@observium.org
http://postman.memetic.org/cgi-bin/mailman/listinfo/observium [1]
-------------------------
observium mailing list observium@observium.orgmailto:observium@observium.org http://postman.memetic.org/cgi-bin/mailman/listinfo/observium [1]
-- Sent from my Android device with K-9 Mail. Please excuse my brevity.
Links: ------ [1] http://postman.memetic.org/cgi-bin/mailman/listinfo/observium
________________________________
observium mailing list observium@observium.orgmailto:observium@observium.org http://postman.memetic.org/cgi-bin/mailman/listinfo/observium
________________________________
observium mailing list observium@observium.orgmailto:observium@observium.org http://postman.memetic.org/cgi-bin/mailman/listinfo/observium
________________________________
observium mailing list observium@observium.orgmailto:observium@observium.org http://postman.memetic.org/cgi-bin/mailman/listinfo/observium
-- Sent from my Android device with K-9 Mail. Please excuse my brevity.
_______________________________________________ observium mailing list observium@observium.orgmailto:observium@observium.org http://postman.memetic.org/cgi-bin/mailman/listinfo/observium
_______________________________________________ observium mailing list observium@observium.orgmailto:observium@observium.org http://postman.memetic.org/cgi-bin/mailman/listinfo/observium
You should /not/ have to chmod these files, they are delivered by SVN with the executable bit set.
Are you sure you didn't chmod 644 the entire observium directory or something?
Adam.
Jason Ross jross@medicalteams.org wrote:
Yeah, I knew of the files, I just didn't know if poller py files meant the poller-wrapper.py file or if it was some other file...
Success! Chmod +x on the poller.php, discovery.php, and poller-wrapper.py files fixed it. All graphs, except FTB Table Usage, are working correctly. Finally! Thanks everyone for your help...and patience. Maybe someone can add this fix under the FAQ "My graphs don't work" or something? It would have save me hours and you guys a thousand questions. Anyway, thanks again. Jason
From: observium [mailto:observium-bounces@observium.org] On Behalf Of Josh Hopper Sent: Tuesday, December 17, 2013 8:27 PM To: Observium Network Observation System Subject: Re: [Observium] Graph Data only displays -nan
Its poller.php and discovery.php
cd /opt/observium ls
Its there.
Since the split from free to liscensed you have to chmod some files to get it to work. I'm not sure why. :/
-- Sincerely, Joshua Hopper, A+ CE Network Administrator [http://www.protectplus.com/images/ppluslogo.jpg] 420 3rd Ave NW Hickory NC 28601 Office: 828-449-1839x2160 | Cell: 828-855-7565
From: observium [mailto:observium-bounces@observium.org] On Behalf Of Mark Sent: Tuesday, December 17, 2013 9:03 PM To: Observium Network Observation System Subject: Re: [Observium] Graph Data only displays -nan
In /opt/observium On Dec 17, 2013 7:00 PM, "Jason Ross" <jross@medicalteams.orgmailto:jross@medicalteams.org> wrote: Mark, Poller py files?
From: observium [mailto:observium-bounces@observium.orgmailto:observium-bounces@observium.org] On Behalf Of Mark Sent: Tuesday, December 17, 2013 5:47 PM To: Observium Network Observation System Subject: Re: [Observium] Graph Data only displays -nan
I had to do chmod +x on the poller py and the discovery php files and they have been running for almost a week now On Dec 17, 2013 6:21 PM, "Jason Ross" <jross@medicalteams.orgmailto:jross@medicalteams.org> wrote: So if I created the file /etc/cron.d/Observium and entered the cron jobs as in the instructions, why wouldn't they be running?
From: observium [mailto:observium-bounces@observium.orgmailto:observium-bounces@observium.org] On Behalf Of Adam Armstrong Sent: Tuesday, December 17, 2013 4:50 PM To: Observium Network Observation System Subject: Re: [Observium] Graph Data only displays -nan
That is indeed what it would suggest! Jason Ross <jross@medicalteams.orgmailto:jross@medicalteams.org> wrote:
Adam, So while I've been building another server, I noticed that after I add a new device to observum via the web gui, it is displayed in the devices, but after 30 minutes, it still hasn't been polled or discovered. Would this indicate that my cron jobs aren't running as they should be? Last question about this, I promise.
Thanks, Jason
-----Original Message----- From: observium [mailto:observium-bounces@observium.org] On Behalf Of Adam Armstrong
Sent: Tuesday, December 17, 2013 3:30 PM
To: Observium Network Observation System Subject: Re: [Observium] Graph Data only displays -nan
Well, it seems to definitely be correctly updating and running the poller.
If your RRDs are being created, then there are no permissions issues (poller runs as root anyways). I really can't see why it's not working, unless your crontab entries are not being run.
If you want to give me access to t
he
server, I can fix and tell everyone what you did wrong! ;P
adam.
On 2013-12-17 23:21, Jason Ross wrote:
Whoops...sorry. Forgot to paste it in.
array(88
port_id => 3
device_id => 1
port_64bit => 1
port_label =>
port_descr_type => null
port_descr_descr => null
port_descr_circuit => null
port_descr_speed => null
port_descr_notes => null
ifDescr => 3
ifName => 3
portName => null
ifIndex => 3
ifSpeed => 100000000
ifConnectorPresent => true
ifPromiscuousMode => true
ifHighSpeed => 100
ifOperStatus => up
ifAdminStatus => up
ifDuplex => fullDuplex
ifMtu => 1514
ifType => ethernetCsmacd
ifAlias =>
ifPhysAddress => 00110ae4e7fd
ifHardType => null
ifLastChange => 2013-12-17 06:38:12
date-8hr America/Los_Angeles (UTC-8)
ifVlan => 1
ifTrunk => dot1Q
ifVrf => null
ignore => 0
disabled => 0
detailed => 0
deleted => 0
pagpOperationMode => null
pagpPortState => null
pagpPartnerDeviceId => null
pagpPartnerLearnMethod => null
pagpPartnerIfIndex => null
pagpPartnerGroupIfIndex => null
pagpPartnerDeviceName => null
pagpEthcOperationMode => null
pagpDeviceId => null
pagpGroupIfIndex => null
ifInUcastPkts => 2154573
73
ifInUcastPkts_delta => 203755
ifInUcastPkts_rate => 217
ifOutUcastPkts => 304943357
ifOutUcastPkts_delta => 291120
ifOutUcastPkts_rate => 310
ifInErrors => 163
ifInErrors_delta => 0
ifInErrors_rate => 0
ifOutErrors => 0
ifOutErrors_delta => 0
ifOutErrors_rate => 0
ifOctets_rate => 384524
ifUcastPkts_rate => 527
ifErrors_rate => 0
ifInOctets => 28916762299
ifInOctets_delta => 27302870
ifInOctets_rate => 29077
ifOutOctets => 353122057304
ifOutOctets_delta => 333765358
ifOutOctets_rate => 355448
ifInOctets_perc => 0
ifOutOctets_perc => 3
poll_time => 1387321711
poll_period => 939
hostname =&g
t;
pdx-sw-dc
human_speed => 100Mbps
human_type => Ethernet
html_class =>
human_mac => 00:11:0a:e4:e7:fd
label => 3
entity_name => 3
entity_shortname => 3
entity_descr =>
admin_status => enabled
table_tab_colour => #194B7F
row_class =>
in_rate => 232616
out_rate => 2843584
bps_in_style => color: #008C00;
bps_out_style => color: #394182;
pps_in_style => color: #740074;
pps_out_style => color: #FF7400;
humanized => true
graph_type => port_errors
FROM: Jason Ross
SENT: Tuesday, December 17, 2013 3:21 PM TO: 'Observium Network Observation System' SUBJECT: RE: [Observium] Graph Data only displays -nan
Well, one last attempt before building aga
in
using vmware instead of hyper-v so I can copy/paste the install guide... Here is the output of clicking on "Data" for a device's port. This has traffic bandwidth info displayed in viewing all ports of the device, but again, only has
"-nan" for data.
To me it looks like the data it needs I there, but maybe I'm missing something? I also just removed the mysql database, deleted the rrd directory, re-created rrd, chown'd it to www-data:www-data, and
recreated the database per the install page, and copied config.php.default over to config.php again. This should be a fresh start for permissions and graphing that we've been discussing correct?
FROM: observium [mailto:observium-bounces@observium.org] ON BEHALF OF
Josh Hopper SENT: Tuesday, December 17, 2013 2:24 PM TO: Observium Network Observation System SUBJECT: Re: [Observium] Graph Data only dis
plays
-nan
Doh! My mistake. I'll use it next quarter. I promise.
--
Sincerely,
Joshua Hopper, A+ CE
_Network Administrator_
420 3rd Ave NW Hickory NC 28601
Office: 828-449-1839x2160tel:828-449-1839x2160 | Cell: 828-855-7565tel:828-855-7565
FROM: observium [mailto:observium-bounces@observium.org] ON BEHALF OF Adam Armstrong SENT: Tuesday, December 17, 2013 5:09 PM TO: Observium Network Observation System
SUBJECT: Re: [Observium] Graph Data only displays -nan
He seems to be using svn :)
Adam.
Josh Hopper <joshhopper@protectplus.commailto:joshhopper@protectplus.com> wrote:
Adam, the Community version is now different. You just have to CHMOD the RRD directory.
Remove SNMP if it applies (as per the guide). But the CHMOD 755 on RRD wasn't in the guide.
--
Sincerely,
Joshua Hopper, A+ CE
_Net
work
Administrator_
420 3rd Ave NW Hickory NC 28601
Office: 828-449-1839x2160tel:828-449-1839x2160 | Cell: 828-855-7565tel:828-855-7565
FROM: observium [mailto:observium-bounces@observium.org] ON BEHALF OF Adam Armstrong SENT: Tuesday, December 17, 2013 5:03 PM TO: Observium Network Observation System
SUBJECT: Re: [Observium] Graph Data only displays -nan
Which version of Ubuntu?
The install guide is copy&paste idiot proof, pretty much!
Adam.
Jason Ross <jross@medicalteams.orgmailto:jross@medicalteams.org> wrote:
Yes, virtualized using hyper-v, but nothing else is on it. Started with a fresh image of Ubuntu server and went right into the Observium install instructions.
FROM: observium [mailto:observium-bounces@observium.org] ON BEHALF OF
Adam Armstrong SENT: Tuesday, December 17, 2013 1:16 PM TO: Observium Network Observation System SUBJECT: Re: [Observium]
Graph
Data only displays -nan
Is this a clean server with nothing else on it?
Jason Ross <jross@medicalteams.orgmailto:jross@medicalteams.org> wrote:
Ok, so I know my graphing issus are permissions related, and I've
checked the rrd folder permissions / tried adjusting them with solutions given to other people with graphing problems. I'm still unable to get anything other than "-nan" into the graphs.
-All graphs write, but no data is displayed.
-Realtime graphs display data
-Traffic stats is being displayed in the "Ports" tab for my devices.
Install Info:
-During last setup/install I enabled root user and installed everything under root. (Was a last ditch effort and I'll change / redo
after I get this working at least once...)
-rrd folder has root:root listed with "ls -la" output. (I tried using www-data:ww-data, Observium:root, et
c with
no success.)
-cron jobs (not using e-tab) had user "root" listed exactly like in the install guide. /etc/cron.d/Observium Currently has no user listed, but it made no difference that I can see.
Today I updated to version 4836 and had "no auth" displayed in the device graphs previews, which I hadn't ever seen before. Seems like it was something that changed from 4811 to 4836 as I hadn't made any
other changes. However, I still only get -nan in the data fields, which furthers my belief that I'm missing something having to do with folder permissions.
Can someone give a list of folders that need to have specific
permissions set? And if you're feeling REALLY generous, maybe even what the permissions should be with knowing that everything was installed using the root user? I'd really love to move past this and
start testing Observium!
Thanks, Jason
FROM: observium [mailto:observium-bounces@observium.org] ON BEHALF OF Jason Ross SENT: Friday, December 06, 2013 10:25 AM
TO: Observium Network Observation System SUBJECT: Re: [Observium] Graph Data only displays -nan
Any other ideas or things I can check?
FROM: observium [mailto:observium-bounces@observium.org] ON BEHALF OF
Jason Ross SENT: Thursday, December 05, 2013 3:48 PM TO: Observium Network Observation System SUBJECT: Re: [Observium] Graph Data only displays -nan
Ha! Yeah I can at least pick up on the hints. :-)
FROM: observium [mailto:observium-bounces@observium.org] ON BEHALF OF Adam Armstrong SENT: Thursday, December 05, 2013 3:45 PM TO: Observium Network Observation System
SUBJECT: Re: [Observium] Graph Data only displays -nan
No, that is correct.
Some people insist on trying to pu
t them
in a user cron file with crontab -e, very common error, hence the big red box!
Adam.
Jason Ross <jross@medicalteams.orgmailto:jross@medicalteams.org> wrote:
Not sure if you meant cron jobs instead of from jobs, but it seems like you may have. I followed the instructions:
Add cron jobs, create a new file /etc/cron.d/observium with the following contents:
IMPORTANT!
Please note that the below example includes a username, so will only work in /etc/crontab or /etc/cron.d/observium. It will NOT work in a user crontab edited with crontab -e.
33 */6 * * * root /opt/observium/discovery.php -h all >> /dev/null
2>&1
*/5 * * * * root /opt/observium/discovery.php -h new >> /dev/null 2>&1
*/5 * * * * root /opt/observium/poller-wrapper.pyhttp://poller-wrapper.py 1 >> /dev/null 2>&1
So these
cron
jobs are in a file I created located at /etc/cron.d/Observium. Do I need to move them?
Thanks, Jason
FROM: observium [mailto:observium-bounces@observium.org] ON BEHALF OF
Adam Armstrong SENT: Thursday, December 05, 2013 3:39 PM TO: Observium Network Observation System SUBJECT: Re: [Observium] Graph Data only displays -nan
So where did you put the observium from jobs...?
Adam.
Jason Ross <jross@medicalteams.orgmailto:jross@medicalteams.org> wrote:
Sorry it's a screenshot instead of text...don't have an easy way to grab files off that server yet. Here is the output.
FROM: observium [mailto:observium-bounces@observium.org] ON BEHALF OF Tom Laermans SENT: Thursday, December 05, 2013 12:59 PM TO: Observium Network Observation System
SUBJECT: Re: [Observium] Graph Data only displays -nan
Please paste the output of this command: c
at
/etc/crontab
Thanks, Tom
On 05/12/2013 21:40, Jason Ross wrote:
First, I must apologize for yet another question about "graphs not working". However, I have read everything I can find in the mail
archives, in forums, and have reinstalled multiple times following the instructions exactly. Each time with the -nan listed for all data points. Verified permissions on the rrd and tmp folders and both match
the same user/group as what everything is running as. I eventually resorted to installing and running everything as root to try and resolve permission errors. Once I figure out what's wrong I'll go back
to std user. Sorry for the long email, but I wanted to include
everything I know so far.
Monitoring Host:
Ubuntu 13.04
Observium 13.12.4811
Virtual Machine on Hyper-V
Currently Monitored Devices:
3 HP Procurve Switches
1 Ricoh Copier
2 Sonicwall Firewalls
Testing results thus far:
Real-time graphing works for each device.
Every other graph is drawn, but has "-nan" for each data point.
Same for each device.
- Prior to installing jpgraph (to get billing to work) all devices
did not list traffic data under the Ports tab.
- Post jpgraph install and config, traffic info under Ports tab works
for Ricoh Copier and 1 of 3 HP Procurve switches, but no other devices.
Only 0 bps is listed.
- Enabled rrdcached in the config file with adding
$config['rrdcached'] = "unix:/var/run/rrdcached.sock";.
- Ran discovery and polling for everything again and all devices list
stats for traffic under Ports tab.
Billing still doesn't capture traffic data on any device.
Billing Accurate Gr
aphs
gives an error of 25121 - "Empty input data array specified for plot. Must have at least one data point."
I believe billing errors may be related to the rest.
I ran discovery and polling in debug mode writing to text files and it
appears that the data is being pulled from the device correctly. It also looks like it writes the data into the rrd device file and updates the mysql database without showing any errors. Thus, I'm perplexed as to what it could be and have no direction to look into...
Help would be appreciated.
Thanks, Jason
observium mailing list
observium@observium.orgmailto:observium@observium.org
http://postman.memetic.org/cgi-bin/mailman/listinfo/observium [1]
observium mailing list observium@observium.orgmailto:observium@observium.org http://postman.memetic.org/cgi-bin/mailman/listinfo/observium [1]
-- Sent from my Android device with K-9 Mail. Please excuse my brevity.
Links:
[1] http://postman.memetic.org/cgi-bin/mailman/listinfo/observium
observium mailing list observium@observium.orgmailto:observium@observium.org http://postman.memetic.org/cgi-bin/mailman/listinfo/observium
observium mailing list observium@observium.orgmailto:observium@observium.org http://postman.memetic.org/cgi-bin/mailman/listinfo/observium
observium mailing list observium@observium.orgmailto:observium@observium.org http://postman.memetic.org/cgi-bin/mailman/listinfo/observium
-- Sent from my Android device with K-9 Mail. Please excuse my brevity.
observium mailing list observium@observium.orgmailto:observium@observium.org http://postman.memetic.org/cgi-bin/mailman/listinfo/observium
observium mailing list observium@observium.orgmailto:observium@observium.org http://postman.memetic.org/cgi-bin/mailman/listinfo/observium
observium mailing list observium@observium.org http://postman.memetic.org/cgi-bin/mailman/listinfo/observium
participants (5)
-
 Adam Armstrong
 -
 Jason Ross
 -
 Josh Hopper
 -
 Mark
Mark -
 Tom Laermans