
Hello,
Any idea why I would be getting "draw errors" on a bunch of my devices?

No but you didn't include any information. You're getting draw errors:
* Which graphs specifically? * What devices? * When did this start happening? After you svn up'd? Did you try rolling back to your previous revision to see if they go away? * What does the debug output say?
Mailing lists participants should not have to beat answers out of you. You've posted enough on this list that you should know what we need to help you by now.
Regards,
SG
On 12/29/2014 7:15 AM, Darian Jimenez wrote:
Hello,
Any idea why I would be getting "draw errors" on a bunch of my devices?
observium mailing list observium@observium.org http://postman.memetic.org/cgi-bin/mailman/listinfo/observium
Spencer,
answers to your questions.
1 - All graphs 2 - All devices (network switches/ firewall/ windows servers) 3 - Not 100% sure when it started but it seems like a week ago or about when I did an SVN update. Don't know how to use svn much so no idea on how to rollback. 4 - Debug log hasn't been showing any new data since 12/18/14. I actually asked this on a separate email and no one answered.
The only graphs that are showing up fine are the smokeping ones.
Sorry if it seems like your beating answer out of me but i am for one not a Linux expert and just getting into linux full time. A lot of the simple logs and debugging things I don't know how to do because of this (more experience in windows/networking). Also there is lack of documentation and use of observium so googling doesn't always turn up an answer.
Hope you can help.
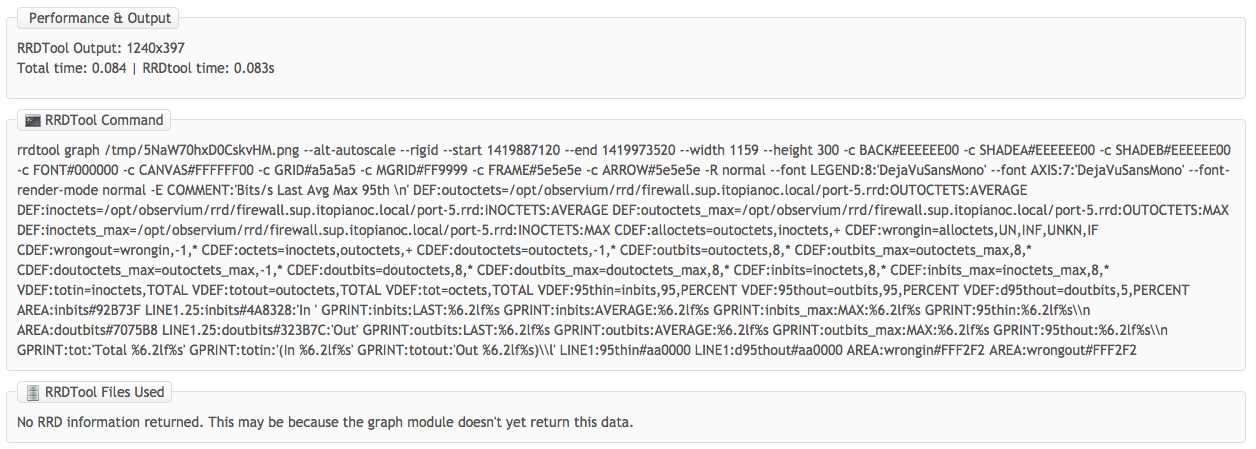
What does the 'RRD Command' section say when looking at a graph?
To rollback, pick a revision and run: 'svn update -r <revision_number>'. You could try incrementally rolling back until things work again, then work forward to see where things break.
Regards,
SG
On 12/29/2014 10:36 AM, Darian Jimenez wrote:
Spencer,
answers to your questions.
1 - All graphs 2 - All devices (network switches/ firewall/ windows servers) 3 - Not 100% sure when it started but it seems like a week ago or about when I did an SVN update. Don't know how to use svn much so no idea on how to rollback. 4 - Debug log hasn't been showing any new data since 12/18/14. I actually asked this on a separate email and no one answered.
The only graphs that are showing up fine are the smokeping ones.
Sorry if it seems like your beating answer out of me but i am for one not a Linux expert and just getting into linux full time. A lot of the simple logs and debugging things I don't know how to do because of this (more experience in windows/networking). Also there is lack of documentation and use of observium so googling doesn't always turn up an answer.
Hope you can help.
observium mailing list observium@observium.org http://postman.memetic.org/cgi-bin/mailman/listinfo/observium
Spencer,
Attached is the picture from the 'RRD command' tab.
How do i see what svn updates are available where can i check previous update #s?
On Tue, Dec 30, 2014 at 1:43 PM, Spencer Gaw spencerg@frii.net wrote:
What does the 'RRD Command' section say when looking at a graph?
To rollback, pick a revision and run: 'svn update -r <revision_number>'. You could try incrementally rolling back until things work again, then work forward to see where things break.
Regards,
SG
On 12/29/2014 10:36 AM, Darian Jimenez wrote:
Spencer,
answers to your questions.
1 - All graphs 2 - All devices (network switches/ firewall/ windows servers) 3 - Not 100% sure when it started but it seems like a week ago or about when I did an SVN update. Don't know how to use svn much so no idea on how to rollback. 4 - Debug log hasn't been showing any new data since 12/18/14. I actually asked this on a separate email and no one answered.
The only graphs that are showing up fine are the smokeping ones.
Sorry if it seems like your beating answer out of me but i am for one not a Linux expert and just getting into linux full time. A lot of the simple logs and debugging things I don't know how to do because of this (more experience in windows/networking). Also there is lack of documentation and use of observium so googling doesn't always turn up an answer.
Hope you can help.
observium mailing list observium@observium.org http://postman.memetic.org/cgi-bin/mailman/listinfo/observium
observium mailing list observium@observium.org http://postman.memetic.org/cgi-bin/mailman/listinfo/observium
Spencer,
Sorry but how can I check on a previous revision number so I can rollback using svn?
On Tue, Dec 30, 2014 at 4:21 PM, Darian Jimenez darian929@gmail.com wrote:
Spencer,
Attached is the picture from the 'RRD command' tab.
How do i see what svn updates are available where can i check previous update #s?
On Tue, Dec 30, 2014 at 1:43 PM, Spencer Gaw spencerg@frii.net wrote:
What does the 'RRD Command' section say when looking at a graph?
To rollback, pick a revision and run: 'svn update -r <revision_number>'. You could try incrementally rolling back until things work again, then work forward to see where things break.
Regards,
SG
On 12/29/2014 10:36 AM, Darian Jimenez wrote:
Spencer,
answers to your questions.
1 - All graphs 2 - All devices (network switches/ firewall/ windows servers) 3 - Not 100% sure when it started but it seems like a week ago or about when I did an SVN update. Don't know how to use svn much so no idea on how to rollback. 4 - Debug log hasn't been showing any new data since 12/18/14. I actually asked this on a separate email and no one answered.
The only graphs that are showing up fine are the smokeping ones.
Sorry if it seems like your beating answer out of me but i am for one not a Linux expert and just getting into linux full time. A lot of the simple logs and debugging things I don't know how to do because of this (more experience in windows/networking). Also there is lack of documentation and use of observium so googling doesn't always turn up an answer.
Hope you can help.
observium mailing list observium@observium.org http://postman.memetic.org/cgi-bin/mailman/listinfo/observium
observium mailing list observium@observium.org http://postman.memetic.org/cgi-bin/mailman/listinfo/observium

You probably don't want to be doing any of that unless you're able to troubleshoot what is wrong yourself.
You can try manually polling a device from the commandline with debugging enabled :
./poller.php -h <device_id> -d
The output from that might give more information.
adam.
On 2015-01-02 14:32, Darian Jimenez wrote:
Spencer,
Sorry but how can I check on a previous revision number so I can rollback using svn?
On Tue, Dec 30, 2014 at 4:21 PM, Darian Jimenez darian929@gmail.com wrote:
Spencer,
Attached is the picture from the 'RRD command' tab.
How do i see what svn updates are available where can i check previous update #s?
On Tue, Dec 30, 2014 at 1:43 PM, Spencer Gaw spencerg@frii.net wrote: What does the 'RRD Command' section say when looking at a graph?
To rollback, pick a revision and run: 'svn update -r <revision_number>'. You could try incrementally rolling back until things work again, then work forward to see where things break.
Regards,
SG
On 12/29/2014 10:36 AM, Darian Jimenez wrote:
Spencer,
answers to your questions.
1 - All graphs 2 - All devices (network switches/ firewall/ windows servers) 3 - Not 100% sure when it started but it seems like a week ago or about when I did an SVN update. Don't know how to use svn much so no idea on how to rollback. 4 - Debug log hasn't been showing any new data since 12/18/14. I actually asked this on a separate email and no one answered.
The only graphs that are showing up fine are the smokeping ones.
Sorry if it seems like your beating answer out of me but i am for one not a Linux expert and just getting into linux full time. A lot of the simple logs and debugging things I don't know how to do because of this (more experience in windows/networking). Also there is lack of documentation and use of observium so googling doesn't always turn up an answer.
Hope you can help.
observium mailing list observium@observium.org http://postman.memetic.org/cgi-bin/mailman/listinfo/observium [1]
observium mailing list observium@observium.org http://postman.memetic.org/cgi-bin/mailman/listinfo/observium [1]
Links:
[1] http://postman.memetic.org/cgi-bin/mailman/listinfo/observium
observium mailing list observium@observium.org http://postman.memetic.org/cgi-bin/mailman/listinfo/observium
Adam,
I get a bunch of these
stdout[ERROR: opening '/opt/observium/rrd/apc-410-09-pdu-a.xxx.local/perf-poller.rrd': Permission denied]
this happens on all devices I poll.
Also they say this...
SNMP_STATUS[FALSE]
On Fri, Jan 2, 2015 at 4:03 PM, Adam Armstrong adama@memetic.org wrote:
You probably don't want to be doing any of that unless you're able to troubleshoot what is wrong yourself.
You can try manually polling a device from the commandline with debugging enabled :
./poller.php -h <device_id> -d
The output from that might give more information.
adam.
On 2015-01-02 14:32, Darian Jimenez wrote:
Spencer,
Sorry but how can I check on a previous revision number so I can rollback using svn?
On Tue, Dec 30, 2014 at 4:21 PM, Darian Jimenez darian929@gmail.com wrote:
Spencer,
Attached is the picture from the 'RRD command' tab.
How do i see what svn updates are available where can i check previous update #s?
On Tue, Dec 30, 2014 at 1:43 PM, Spencer Gaw spencerg@frii.net wrote: What does the 'RRD Command' section say when looking at a graph?
To rollback, pick a revision and run: 'svn update -r <revision_number>'. You could try incrementally rolling back until things work again, then work forward to see where things break.
Regards,
SG
On 12/29/2014 10:36 AM, Darian Jimenez wrote:
Spencer,
answers to your questions.
1 - All graphs 2 - All devices (network switches/ firewall/ windows servers) 3 - Not 100% sure when it started but it seems like a week ago or about when I did an SVN update. Don't know how to use svn much so no idea on how to rollback. 4 - Debug log hasn't been showing any new data since 12/18/14. I actually asked this on a separate email and no one answered.
The only graphs that are showing up fine are the smokeping ones.
Sorry if it seems like your beating answer out of me but i am for one not a Linux expert and just getting into linux full time. A lot of the simple logs and debugging things I don't know how to do because of this (more experience in windows/networking). Also there is lack of documentation and use of observium so googling doesn't always turn up an answer.
Hope you can help.
observium mailing list observium@observium.org http://postman.memetic.org/cgi-bin/mailman/listinfo/observium [1]
observium mailing list observium@observium.org http://postman.memetic.org/cgi-bin/mailman/listinfo/observium [1]
Links:
[1] http://postman.memetic.org/cgi-bin/mailman/listinfo/observium
observium mailing list observium@observium.org http://postman.memetic.org/cgi-bin/mailman/listinfo/observium
observium mailing list observium@observium.org http://postman.memetic.org/cgi-bin/mailman/listinfo/observium
This probably needs a little more context, but it seems like you have two problems :
a) you somehow managed to break the permissions on your rrd directory (or you tried to run the poller as a user who wasn't allowed to write to that folder in the first place, run it as root)
b) SNMP failures are almost always caused by a bullshit net-snmp bug which has existed for about 10 years, you need to do :
rm -rf mibs/.index rm -rf mibs/*/.index
adam.
On 2015-01-02 15:25, Darian Jimenez wrote:
Adam,
I get a bunch of these
stdout[ERROR: opening '/opt/observium/rrd/apc-410-09-pdu-a.xxx.local/perf-poller.rrd': Permission denied]
this happens on all devices I poll.
Also they say this...
SNMP_STATUS[FALSE]
On Fri, Jan 2, 2015 at 4:03 PM, Adam Armstrong adama@memetic.org wrote:
You probably don't want to be doing any of that unless you're able to troubleshoot what is wrong yourself.
You can try manually polling a device from the commandline with debugging enabled :
./poller.php -h <device_id> -d
The output from that might give more information.
adam.
On 2015-01-02 14:32, Darian Jimenez wrote:
Spencer,
Sorry but how can I check on a previous revision number so I can rollback using svn?
On Tue, Dec 30, 2014 at 4:21 PM, Darian Jimenez darian929@gmail.com wrote:
Spencer,
Attached is the picture from the 'RRD command' tab.
How do i see what svn updates are available where can i check previous update #s?
On Tue, Dec 30, 2014 at 1:43 PM, Spencer Gaw spencerg@frii.net wrote: What does the 'RRD Command' section say when looking at a graph?
To rollback, pick a revision and run: 'svn update -r <revision_number>'. You could try incrementally rolling back until things work again, then work forward to see where things break.
Regards,
SG
On 12/29/2014 10:36 AM, Darian Jimenez wrote:
Spencer,
answers to your questions.
1 - All graphs 2 - All devices (network switches/ firewall/ windows servers) 3 - Not 100% sure when it started but it seems like a week ago or about when I did an SVN update. Don't know how to use svn much so no idea on how to rollback. 4 - Debug log hasn't been showing any new data since 12/18/14. I actually asked this on a separate email and no one answered.
The only graphs that are showing up fine are the smokeping ones.
Sorry if it seems like your beating answer out of me but i am for one not a Linux expert and just getting into linux full time. A lot of the simple logs and debugging things I don't know how to do because of this (more experience in windows/networking). Also there is lack of documentation and use of observium so googling doesn't always turn up an answer.
Hope you can help.
observium mailing list observium@observium.org http://postman.memetic.org/cgi-bin/mailman/listinfo/observium [1] [1]
observium mailing list observium@observium.org http://postman.memetic.org/cgi-bin/mailman/listinfo/observium [1] [1]
Links:
[1] http://postman.memetic.org/cgi-bin/mailman/listinfo/observium [1]
observium mailing list observium@observium.org http://postman.memetic.org/cgi-bin/mailman/listinfo/observium [1]
observium mailing list observium@observium.org http://postman.memetic.org/cgi-bin/mailman/listinfo/observium [1]
Links:
[1] http://postman.memetic.org/cgi-bin/mailman/listinfo/observium
observium mailing list observium@observium.org http://postman.memetic.org/cgi-bin/mailman/listinfo/observium
Adam,
a) you seem to be correct on here. the root user runs the poller and it works, graphs show up etc. these are the current permission on RRD folder. What should they be as this is not running as root.
drwxr-xr-x 249 root root 16384 Jan 2 16:34 rrd
b) removed the index with the two commands you set. Polling still shows SNMP FALSE but the device is alive and well in observium.
what should I set the rrd permission to?
On Fri, Jan 2, 2015 at 4:27 PM, Adam Armstrong adama@memetic.org wrote:
This probably needs a little more context, but it seems like you have two problems :
a) you somehow managed to break the permissions on your rrd directory (or you tried to run the poller as a user who wasn't allowed to write to that folder in the first place, run it as root)
b) SNMP failures are almost always caused by a bullshit net-snmp bug which has existed for about 10 years, you need to do :
rm -rf mibs/.index rm -rf mibs/*/.index
adam.
On 2015-01-02 15:25, Darian Jimenez wrote:
Adam,
I get a bunch of these
stdout[ERROR: opening '/opt/observium/rrd/apc-410-09-pdu-a.xxx.local/perf-poller.rrd': Permission denied]
this happens on all devices I poll.
Also they say this...
SNMP_STATUS[FALSE]
On Fri, Jan 2, 2015 at 4:03 PM, Adam Armstrong adama@memetic.org wrote:
You probably don't want to be doing any of that unless you're able to troubleshoot what is wrong yourself.
You can try manually polling a device from the commandline with debugging enabled :
./poller.php -h <device_id> -d
The output from that might give more information.
adam.
On 2015-01-02 14:32, Darian Jimenez wrote:
Spencer,
Sorry but how can I check on a previous revision number so I can rollback using svn?
On Tue, Dec 30, 2014 at 4:21 PM, Darian Jimenez darian929@gmail.com wrote:
Spencer,
Attached is the picture from the 'RRD command' tab.
How do i see what svn updates are available where can i check previous update #s?
On Tue, Dec 30, 2014 at 1:43 PM, Spencer Gaw spencerg@frii.net wrote: What does the 'RRD Command' section say when looking at a graph?
To rollback, pick a revision and run: 'svn update -r <revision_number>'. You could try incrementally rolling back until things work again, then work forward to see where things break.
Regards,
SG
On 12/29/2014 10:36 AM, Darian Jimenez wrote:
Spencer,
answers to your questions.
1 - All graphs 2 - All devices (network switches/ firewall/ windows servers) 3 - Not 100% sure when it started but it seems like a week ago or about when I did an SVN update. Don't know how to use svn much so no idea on how to rollback. 4 - Debug log hasn't been showing any new data since 12/18/14. I actually asked this on a separate email and no one answered.
The only graphs that are showing up fine are the smokeping ones.
Sorry if it seems like your beating answer out of me but i am for one not a Linux expert and just getting into linux full time. A lot of the simple logs and debugging things I don't know how to do because of this (more experience in windows/networking). Also there is lack of documentation and use of observium so googling doesn't always turn up an answer.
Hope you can help.
observium mailing list observium@observium.org http://postman.memetic.org/cgi-bin/mailman/listinfo/observium [1] [1]
observium mailing list observium@observium.org http://postman.memetic.org/cgi-bin/mailman/listinfo/observium [1] [1]
Links:
[1] http://postman.memetic.org/cgi-bin/mailman/listinfo/observium [1]
observium mailing list observium@observium.org http://postman.memetic.org/cgi-bin/mailman/listinfo/observium [1]
observium mailing list observium@observium.org http://postman.memetic.org/cgi-bin/mailman/listinfo/observium [1]
Links:
[1] http://postman.memetic.org/cgi-bin/mailman/listinfo/observium
observium mailing list observium@observium.org http://postman.memetic.org/cgi-bin/mailman/listinfo/observium
observium mailing list observium@observium.org http://postman.memetic.org/cgi-bin/mailman/listinfo/observium
Then that would be related to the context that I said you didn't provide.
Copy/pasting a single word from the debug output is not terribly helpful.
Adam.
Sent with AquaMail for Android http://www.aqua-mail.com
On 2 January 2015 15:40:31 Darian Jimenez darian929@gmail.com wrote:
Adam,
a) you seem to be correct on here. the root user runs the poller and it works, graphs show up etc. these are the current permission on RRD folder. What should they be as this is not running as root.
drwxr-xr-x 249 root root 16384 Jan 2 16:34 rrd
b) removed the index with the two commands you set. Polling still shows SNMP FALSE but the device is alive and well in observium.
what should I set the rrd permission to?
On Fri, Jan 2, 2015 at 4:27 PM, Adam Armstrong adama@memetic.org wrote:
This probably needs a little more context, but it seems like you have two problems :
a) you somehow managed to break the permissions on your rrd directory (or you tried to run the poller as a user who wasn't allowed to write to that folder in the first place, run it as root)
b) SNMP failures are almost always caused by a bullshit net-snmp bug which has existed for about 10 years, you need to do :
rm -rf mibs/.index rm -rf mibs/*/.index
adam.
On 2015-01-02 15:25, Darian Jimenez wrote:
Adam,
I get a bunch of these
stdout[ERROR: opening '/opt/observium/rrd/apc-410-09-pdu-a.xxx.local/perf-poller.rrd': Permission denied]
this happens on all devices I poll.
Also they say this...
SNMP_STATUS[FALSE]
On Fri, Jan 2, 2015 at 4:03 PM, Adam Armstrong adama@memetic.org wrote:
You probably don't want to be doing any of that unless you're able to troubleshoot what is wrong yourself.
You can try manually polling a device from the commandline with debugging enabled :
./poller.php -h <device_id> -d
The output from that might give more information.
adam.
On 2015-01-02 14:32, Darian Jimenez wrote:
Spencer,
Sorry but how can I check on a previous revision number so I can rollback using svn?
On Tue, Dec 30, 2014 at 4:21 PM, Darian Jimenez darian929@gmail.com wrote:
Spencer,
Attached is the picture from the 'RRD command' tab.
How do i see what svn updates are available where can i check previous update #s?
On Tue, Dec 30, 2014 at 1:43 PM, Spencer Gaw spencerg@frii.net wrote: What does the 'RRD Command' section say when looking at a graph?
To rollback, pick a revision and run: 'svn update -r <revision_number>'. You could try incrementally rolling back until things work again, then work forward to see where things break.
Regards,
SG
On 12/29/2014 10:36 AM, Darian Jimenez wrote:
Spencer,
answers to your questions.
1 - All graphs 2 - All devices (network switches/ firewall/ windows servers) 3 - Not 100% sure when it started but it seems like a week ago or about when I did an SVN update. Don't know how to use svn much so no idea on how to rollback. 4 - Debug log hasn't been showing any new data since 12/18/14. I actually asked this on a separate email and no one answered.
The only graphs that are showing up fine are the smokeping ones.
Sorry if it seems like your beating answer out of me but i am for one not a Linux expert and just getting into linux full time. A lot of the simple logs and debugging things I don't know how to do because of this (more experience in windows/networking). Also there is lack of documentation and use of observium so googling doesn't always turn up an answer.
Hope you can help.
observium mailing list observium@observium.org http://postman.memetic.org/cgi-bin/mailman/listinfo/observium [1] [1]
observium mailing list observium@observium.org http://postman.memetic.org/cgi-bin/mailman/listinfo/observium [1] [1]
Links:
[1] http://postman.memetic.org/cgi-bin/mailman/listinfo/observium [1]
observium mailing list observium@observium.org http://postman.memetic.org/cgi-bin/mailman/listinfo/observium [1]
observium mailing list observium@observium.org http://postman.memetic.org/cgi-bin/mailman/listinfo/observium [1]
Links:
[1] http://postman.memetic.org/cgi-bin/mailman/listinfo/observium
observium mailing list observium@observium.org http://postman.memetic.org/cgi-bin/mailman/listinfo/observium
observium mailing list observium@observium.org http://postman.memetic.org/cgi-bin/mailman/listinfo/observium
observium mailing list observium@observium.org http://postman.memetic.org/cgi-bin/mailman/listinfo/observium
Adam,
I was able to fix the problem with permissions and polling now works fine. While I can see the traffic on ports show up now, the graphs don't. If i click on a port and go to real-time it will graph the traffic just fine, however if I look at the graphs for whichever device whether its a cpu/ram/port etc its just blank. It shows the historical data on the graph from months back but not from recent or since the permissions got screwed.
On Fri, Jan 2, 2015 at 5:04 PM, Adam Armstrong adama@memetic.org wrote:
Then that would be related to the context that I said you didn't provide.
Copy/pasting a single word from the debug output is not terribly helpful.
Adam.
Sent with AquaMail for Android http://www.aqua-mail.com
On 2 January 2015 15:40:31 Darian Jimenez darian929@gmail.com wrote:
Adam,
a) you seem to be correct on here. the root user runs the poller and it works, graphs show up etc. these are the current permission on RRD folder. What should they be as this is not running as root.
drwxr-xr-x 249 root root 16384 Jan 2 16:34 rrd
b) removed the index with the two commands you set. Polling still shows SNMP FALSE but the device is alive and well in observium.
what should I set the rrd permission to?
On Fri, Jan 2, 2015 at 4:27 PM, Adam Armstrong adama@memetic.org wrote:
This probably needs a little more context, but it seems like you have two problems :
a) you somehow managed to break the permissions on your rrd directory (or you tried to run the poller as a user who wasn't allowed to write to that folder in the first place, run it as root)
b) SNMP failures are almost always caused by a bullshit net-snmp bug which has existed for about 10 years, you need to do :
rm -rf mibs/.index rm -rf mibs/*/.index
adam.
On 2015-01-02 15:25, Darian Jimenez wrote:
Adam,
I get a bunch of these
stdout[ERROR: opening '/opt/observium/rrd/apc-410-09-pdu-a.xxx.local/perf-poller.rrd': Permission denied]
this happens on all devices I poll.
Also they say this...
SNMP_STATUS[FALSE]
On Fri, Jan 2, 2015 at 4:03 PM, Adam Armstrong adama@memetic.org wrote:
You probably don't want to be doing any of that unless you're able to troubleshoot what is wrong yourself.
You can try manually polling a device from the commandline with debugging enabled :
./poller.php -h <device_id> -d
The output from that might give more information.
adam.
On 2015-01-02 14:32, Darian Jimenez wrote:
Spencer,
Sorry but how can I check on a previous revision number so I can rollback using svn?
On Tue, Dec 30, 2014 at 4:21 PM, Darian Jimenez darian929@gmail.com wrote:
Spencer,
Attached is the picture from the 'RRD command' tab.
How do i see what svn updates are available where can i check previous update #s?
On Tue, Dec 30, 2014 at 1:43 PM, Spencer Gaw spencerg@frii.net wrote: What does the 'RRD Command' section say when looking at a graph?
To rollback, pick a revision and run: 'svn update -r <revision_number>'. You could try incrementally rolling back until things work again, then work forward to see where things break.
Regards,
SG
On 12/29/2014 10:36 AM, Darian Jimenez wrote:
Spencer,
answers to your questions.
1 - All graphs 2 - All devices (network switches/ firewall/ windows servers) 3 - Not 100% sure when it started but it seems like a week ago or about when I did an SVN update. Don't know how to use svn much so no idea on how to rollback. 4 - Debug log hasn't been showing any new data since 12/18/14. I actually asked this on a separate email and no one answered.
The only graphs that are showing up fine are the smokeping ones.
Sorry if it seems like your beating answer out of me but i am for one not a Linux expert and just getting into linux full time. A lot of the simple logs and debugging things I don't know how to do because of this (more experience in windows/networking). Also there is lack of documentation and use of observium so googling doesn't always turn up an answer.
Hope you can help.
observium mailing list observium@observium.org http://postman.memetic.org/cgi-bin/mailman/listinfo/observium [1] [1]
observium mailing list observium@observium.org http://postman.memetic.org/cgi-bin/mailman/listinfo/observium [1] [1]
Links:
[1] http://postman.memetic.org/cgi-bin/mailman/listinfo/observium [1]
observium mailing list observium@observium.org http://postman.memetic.org/cgi-bin/mailman/listinfo/observium [1]
observium mailing list observium@observium.org http://postman.memetic.org/cgi-bin/mailman/listinfo/observium [1]
Links:
[1] http://postman.memetic.org/cgi-bin/mailman/listinfo/observium
observium mailing list observium@observium.org http://postman.memetic.org/cgi-bin/mailman/listinfo/observium
observium mailing list observium@observium.org http://postman.memetic.org/cgi-bin/mailman/listinfo/observium
observium mailing list observium@observium.org http://postman.memetic.org/cgi-bin/mailman/listinfo/observium
observium mailing list observium@observium.org http://postman.memetic.org/cgi-bin/mailman/listinfo/observium
Nobody know why? Let me know what logs I can post here so that I can be more detailed in explaining.
On Tue, Jan 6, 2015 at 11:27 AM, Darian Jimenez darian929@gmail.com wrote:
Adam,
I was able to fix the problem with permissions and polling now works fine. While I can see the traffic on ports show up now, the graphs don't. If i click on a port and go to real-time it will graph the traffic just fine, however if I look at the graphs for whichever device whether its a cpu/ram/port etc its just blank. It shows the historical data on the graph from months back but not from recent or since the permissions got screwed.
On Fri, Jan 2, 2015 at 5:04 PM, Adam Armstrong adama@memetic.org wrote:
Then that would be related to the context that I said you didn't provide.
Copy/pasting a single word from the debug output is not terribly helpful.
Adam.
Sent with AquaMail for Android http://www.aqua-mail.com
On 2 January 2015 15:40:31 Darian Jimenez darian929@gmail.com wrote:
Adam,
a) you seem to be correct on here. the root user runs the poller and it works, graphs show up etc. these are the current permission on RRD folder. What should they be as this is not running as root.
drwxr-xr-x 249 root root 16384 Jan 2 16:34 rrd
b) removed the index with the two commands you set. Polling still shows SNMP FALSE but the device is alive and well in observium.
what should I set the rrd permission to?
On Fri, Jan 2, 2015 at 4:27 PM, Adam Armstrong adama@memetic.org wrote:
This probably needs a little more context, but it seems like you have two problems :
a) you somehow managed to break the permissions on your rrd directory (or you tried to run the poller as a user who wasn't allowed to write to that folder in the first place, run it as root)
b) SNMP failures are almost always caused by a bullshit net-snmp bug which has existed for about 10 years, you need to do :
rm -rf mibs/.index rm -rf mibs/*/.index
adam.
On 2015-01-02 15:25, Darian Jimenez wrote:
Adam,
I get a bunch of these
stdout[ERROR: opening '/opt/observium/rrd/apc-410-09-pdu-a.xxx.local/perf-poller.rrd': Permission denied]
this happens on all devices I poll.
Also they say this...
SNMP_STATUS[FALSE]
On Fri, Jan 2, 2015 at 4:03 PM, Adam Armstrong adama@memetic.org wrote:
You probably don't want to be doing any of that unless you're able to troubleshoot what is wrong yourself.
You can try manually polling a device from the commandline with debugging enabled :
./poller.php -h <device_id> -d
The output from that might give more information.
adam.
On 2015-01-02 14:32, Darian Jimenez wrote:
Spencer,
Sorry but how can I check on a previous revision number so I can rollback using svn?
On Tue, Dec 30, 2014 at 4:21 PM, Darian Jimenez darian929@gmail.com wrote:
Spencer,
Attached is the picture from the 'RRD command' tab.
How do i see what svn updates are available where can i check previous update #s?
On Tue, Dec 30, 2014 at 1:43 PM, Spencer Gaw spencerg@frii.net wrote: What does the 'RRD Command' section say when looking at a graph?
To rollback, pick a revision and run: 'svn update -r <revision_number>'. You could try incrementally rolling back until things work again, then work forward to see where things break.
Regards,
SG
On 12/29/2014 10:36 AM, Darian Jimenez wrote:
Spencer,
answers to your questions.
1 - All graphs 2 - All devices (network switches/ firewall/ windows servers) 3 - Not 100% sure when it started but it seems like a week ago or about when I did an SVN update. Don't know how to use svn much so no idea on how to rollback. 4 - Debug log hasn't been showing any new data since 12/18/14. I actually asked this on a separate email and no one answered.
The only graphs that are showing up fine are the smokeping ones.
Sorry if it seems like your beating answer out of me but i am for one not a Linux expert and just getting into linux full time. A lot of the simple logs and debugging things I don't know how to do because of this (more experience in windows/networking). Also there is lack of documentation and use of observium so googling doesn't always turn up an answer.
Hope you can help.
observium mailing list observium@observium.org http://postman.memetic.org/cgi-bin/mailman/listinfo/observium [1] [1]
observium mailing list observium@observium.org http://postman.memetic.org/cgi-bin/mailman/listinfo/observium [1] [1]
Links:
[1] http://postman.memetic.org/cgi-bin/mailman/listinfo/observium [1]
observium mailing list observium@observium.org http://postman.memetic.org/cgi-bin/mailman/listinfo/observium [1]
observium mailing list observium@observium.org http://postman.memetic.org/cgi-bin/mailman/listinfo/observium [1]
Links:
[1] http://postman.memetic.org/cgi-bin/mailman/listinfo/observium
observium mailing list observium@observium.org http://postman.memetic.org/cgi-bin/mailman/listinfo/observium
observium mailing list observium@observium.org http://postman.memetic.org/cgi-bin/mailman/listinfo/observium
observium mailing list observium@observium.org http://postman.memetic.org/cgi-bin/mailman/listinfo/observium
observium mailing list observium@observium.org http://postman.memetic.org/cgi-bin/mailman/listinfo/observium
Use screenshots, you're way more likely that someone will know what you're talking about.
After 8 years of people going "herp derp no graphs" and always meaning something totally different, we kinda just ignore that kind of complaint.
adam.
------ Original Message ------ From: "Darian Jimenez" darian929@gmail.com To: "Observium Network Observation System" observium@observium.org Sent: 1/8/2015 8:33:13 AM Subject: Re: [Observium] Draw error
Nobody know why? Let me know what logs I can post here so that I can be more detailed in explaining.
On Tue, Jan 6, 2015 at 11:27 AM, Darian Jimenez darian929@gmail.com wrote:
Adam,
I was able to fix the problem with permissions and polling now works fine. While I can see the traffic on ports show up now, the graphs don't. If i click on a port and go to real-time it will graph the traffic just fine, however if I look at the graphs for whichever device whether its a cpu/ram/port etc its just blank. It shows the historical data on the graph from months back but not from recent or since the permissions got screwed.
On Fri, Jan 2, 2015 at 5:04 PM, Adam Armstrong adama@memetic.org wrote:
Then that would be related to the context that I said you didn't provide.
Copy/pasting a single word from the debug output is not terribly helpful.
Adam.
Sent with AquaMail for Android http://www.aqua-mail.com
On 2 January 2015 15:40:31 Darian Jimenez darian929@gmail.com wrote:
Adam,
a) you seem to be correct on here. the root user runs the poller and it works, graphs show up etc. these are the current permission on RRD folder. What should they be as this is not running as root.
drwxr-xr-x 249 root root 16384 Jan 2 16:34 rrd
b) removed the index with the two commands you set. Polling still shows SNMP FALSE but the device is alive and well in observium.
what should I set the rrd permission to?
On Fri, Jan 2, 2015 at 4:27 PM, Adam Armstrong adama@memetic.org wrote:
This probably needs a little more context, but it seems like you have two problems :
a) you somehow managed to break the permissions on your rrd directory (or you tried to run the poller as a user who wasn't allowed to write to that folder in the first place, run it as root)
b) SNMP failures are almost always caused by a bullshit net-snmp bug which has existed for about 10 years, you need to do :
rm -rf mibs/.index rm -rf mibs/*/.index
adam.
On 2015-01-02 15:25, Darian Jimenez wrote:
Adam,
I get a bunch of these
stdout[ERROR: opening '/opt/observium/rrd/apc-410-09-pdu-a.xxx.local/perf-poller.rrd': Permission denied]
this happens on all devices I poll.
Also they say this...
SNMP_STATUS[FALSE]
On Fri, Jan 2, 2015 at 4:03 PM, Adam Armstrong adama@memetic.org wrote:
You probably don't want to be doing any of that unless you're able to troubleshoot what is wrong yourself.
You can try manually polling a device from the commandline with debugging enabled :
./poller.php -h <device_id> -d
The output from that might give more information.
adam.
On 2015-01-02 14:32, Darian Jimenez wrote:
Spencer,
Sorry but how can I check on a previous revision number so I can rollback using svn?
On Tue, Dec 30, 2014 at 4:21 PM, Darian Jimenez darian929@gmail.com wrote:
Spencer,
Attached is the picture from the 'RRD command' tab.
How do i see what svn updates are available where can i check previous update #s?
On Tue, Dec 30, 2014 at 1:43 PM, Spencer Gaw spencerg@frii.net wrote: What does the 'RRD Command' section say when looking at a graph?
To rollback, pick a revision and run: 'svn update -r <revision_number>'. You could try incrementally rolling back until things work again, then work forward to see where things break.
Regards,
SG
On 12/29/2014 10:36 AM, Darian Jimenez wrote:
Spencer,
answers to your questions.
1 - All graphs 2 - All devices (network switches/ firewall/ windows servers) 3 - Not 100% sure when it started but it seems like a week ago or about when I did an SVN update. Don't know how to use svn much so no idea on how to rollback. 4 - Debug log hasn't been showing any new data since 12/18/14. I actually asked this on a separate email and no one answered.
The only graphs that are showing up fine are the smokeping ones.
Sorry if it seems like your beating answer out of me but i am for one not a Linux expert and just getting into linux full time. A lot of the simple logs and debugging things I don't know how to do because of this (more experience in windows/networking). Also there is lack of documentation and use of observium so googling doesn't always turn up an answer.
Hope you can help.
observium mailing list observium@observium.org http://postman.memetic.org/cgi-bin/mailman/listinfo/observium [1] [1]
observium mailing list observium@observium.org http://postman.memetic.org/cgi-bin/mailman/listinfo/observium [1] [1]
Links:
[1] http://postman.memetic.org/cgi-bin/mailman/listinfo/observium [1]
observium mailing list observium@observium.org http://postman.memetic.org/cgi-bin/mailman/listinfo/observium [1]
observium mailing list observium@observium.org http://postman.memetic.org/cgi-bin/mailman/listinfo/observium [1]
Links:
[1] http://postman.memetic.org/cgi-bin/mailman/listinfo/observium
observium mailing list observium@observium.org http://postman.memetic.org/cgi-bin/mailman/listinfo/observium
observium mailing list observium@observium.org http://postman.memetic.org/cgi-bin/mailman/listinfo/observium
observium mailing list observium@observium.org http://postman.memetic.org/cgi-bin/mailman/listinfo/observium
observium mailing list observium@observium.org http://postman.memetic.org/cgi-bin/mailman/listinfo/observium

Stop sending me emails……
From: observium [mailto:observium-bounces@observium.org] On Behalf Of Adam Armstrong Sent: Thursday, January 08, 2015 7:10 PM To: Observium Network Observation System Subject: Re: [Observium] Draw error
Use screenshots, you're way more likely that someone will know what you're talking about.
After 8 years of people going "herp derp no graphs" and always meaning something totally different, we kinda just ignore that kind of complaint.
adam.
------ Original Message ------ From: "Darian Jimenez" <darian929@gmail.commailto:darian929@gmail.com> To: "Observium Network Observation System" <observium@observium.orgmailto:observium@observium.org> Sent: 1/8/2015 8:33:13 AM Subject: Re: [Observium] Draw error
Nobody know why? Let me know what logs I can post here so that I can be more detailed in explaining.
On Tue, Jan 6, 2015 at 11:27 AM, Darian Jimenez <darian929@gmail.commailto:darian929@gmail.com> wrote: Adam,
I was able to fix the problem with permissions and polling now works fine. While I can see the traffic on ports show up now, the graphs don't. If i click on a port and go to real-time it will graph the traffic just fine, however if I look at the graphs for whichever device whether its a cpu/ram/port etc its just blank. It shows the historical data on the graph from months back but not from recent or since the permissions got screwed.
On Fri, Jan 2, 2015 at 5:04 PM, Adam Armstrong <adama@memetic.orgmailto:adama@memetic.org> wrote:
Then that would be related to the context that I said you didn't provide.
Copy/pasting a single word from the debug output is not terribly helpful.
Adam.
Sent with AquaMail for Android http://www.aqua-mail.comhttp://www.aqua-mail.com/
On 2 January 2015 15:40:31 Darian Jimenez <darian929@gmail.commailto:darian929@gmail.com> wrote: Adam,
a) you seem to be correct on here. the root user runs the poller and it works, graphs show up etc. these are the current permission on RRD folder. What should they be as this is not running as root.
drwxr-xr-x 249 root root 16384 Jan 2 16:34 rrd
b) removed the index with the two commands you set. Polling still shows SNMP FALSE but the device is alive and well in observium.
what should I set the rrd permission to?
On Fri, Jan 2, 2015 at 4:27 PM, Adam Armstrong <adama@memetic.orgmailto:adama@memetic.org> wrote: This probably needs a little more context, but it seems like you have two problems :
a) you somehow managed to break the permissions on your rrd directory (or you tried to run the poller as a user who wasn't allowed to write to that folder in the first place, run it as root)
b) SNMP failures are almost always caused by a bullshit net-snmp bug which has existed for about 10 years, you need to do :
rm -rf mibs/.index rm -rf mibs/*/.index
adam.
On 2015-01-02 15:25, Darian Jimenez wrote: Adam,
I get a bunch of these
stdout[ERROR: opening '/opt/observium/rrd/apc-410-09-pdu-a.xxx.local/perf-poller.rrd': Permission denied]
this happens on all devices I poll.
Also they say this...
SNMP_STATUS[FALSE]
On Fri, Jan 2, 2015 at 4:03 PM, Adam Armstrong <adama@memetic.orgmailto:adama@memetic.org> wrote:
You probably don't want to be doing any of that unless you're able to troubleshoot what is wrong yourself.
You can try manually polling a device from the commandline with debugging enabled :
./poller.php -h <device_id> -d
The output from that might give more information.
adam.
On 2015-01-02 14:32, Darian Jimenez wrote:
Spencer,
Sorry but how can I check on a previous revision number so I can rollback using svn?
On Tue, Dec 30, 2014 at 4:21 PM, Darian Jimenez <darian929@gmail.commailto:darian929@gmail.com> wrote:
Spencer,
Attached is the picture from the 'RRD command' tab.
How do i see what svn updates are available where can i check previous update #s?
On Tue, Dec 30, 2014 at 1:43 PM, Spencer Gaw <spencerg@frii.netmailto:spencerg@frii.net> wrote: What does the 'RRD Command' section say when looking at a graph?
To rollback, pick a revision and run: 'svn update -r <revision_number>'. You could try incrementally rolling back until things work again, then work forward to see where things break.
Regards,
SG
On 12/29/2014 10:36 AM, Darian Jimenez wrote:
Spencer,
answers to your questions.
1 - All graphs 2 - All devices (network switches/ firewall/ windows servers) 3 - Not 100% sure when it started but it seems like a week ago or about when I did an SVN update. Don't know how to use svn much so no idea on how to rollback. 4 - Debug log hasn't been showing any new data since 12/18/14. I actually asked this on a separate email and no one answered.
The only graphs that are showing up fine are the smokeping ones.
Sorry if it seems like your beating answer out of me but i am for one not a Linux expert and just getting into linux full time. A lot of the simple logs and debugging things I don't know how to do because of this (more experience in windows/networking). Also there is lack of documentation and use of observium so googling doesn't always turn up an answer.
Hope you can help.
_______________________________________________ observium mailing list observium@observium.orgmailto:observium@observium.org http://postman.memetic.org/cgi-bin/mailman/listinfo/observium [1] [1]
_______________________________________________ observium mailing list observium@observium.orgmailto:observium@observium.org http://postman.memetic.org/cgi-bin/mailman/listinfo/observium [1] [1]
Links: ------ [1] http://postman.memetic.org/cgi-bin/mailman/listinfo/observium [1]
_______________________________________________ observium mailing list observium@observium.orgmailto:observium@observium.org http://postman.memetic.org/cgi-bin/mailman/listinfo/observium [1]
_______________________________________________ observium mailing list observium@observium.orgmailto:observium@observium.org http://postman.memetic.org/cgi-bin/mailman/listinfo/observium [1]
Links: ------ [1] http://postman.memetic.org/cgi-bin/mailman/listinfo/observium
_______________________________________________ observium mailing list observium@observium.orgmailto:observium@observium.org http://postman.memetic.org/cgi-bin/mailman/listinfo/observium _______________________________________________ observium mailing list observium@observium.orgmailto:observium@observium.org http://postman.memetic.org/cgi-bin/mailman/listinfo/observium
_______________________________________________ observium mailing list observium@observium.orgmailto:observium@observium.org http://postman.memetic.org/cgi-bin/mailman/listinfo/observium
_______________________________________________ observium mailing list observium@observium.orgmailto:observium@observium.org http://postman.memetic.org/cgi-bin/mailman/listinfo/observium
Adam,
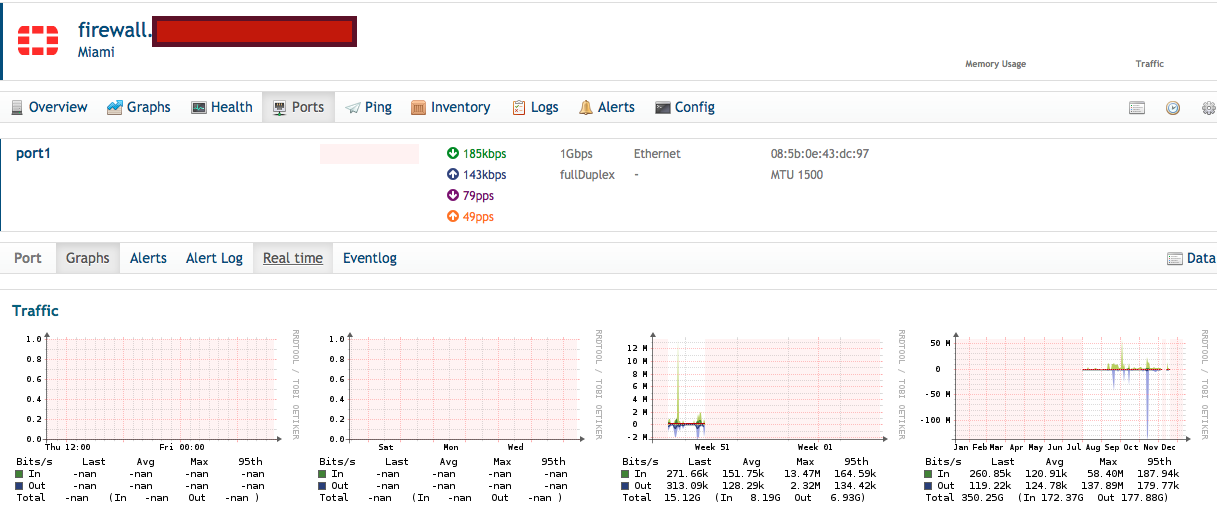
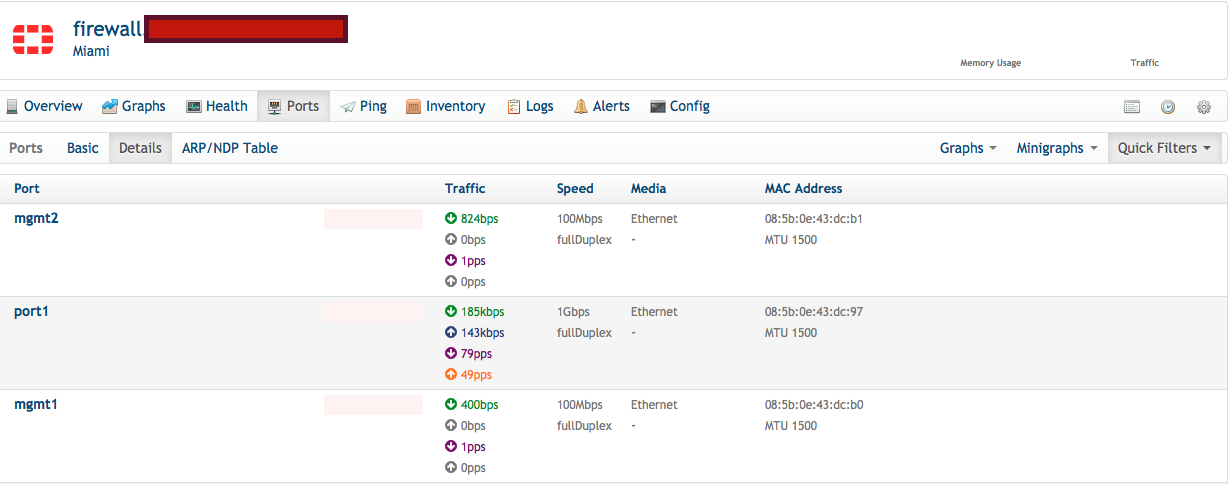
Attached are screenshots with what I mean. It shows the traffic on the ports but never graphs it.
On Fri, Jan 9, 2015 at 7:46 AM, Kenny, Missy kennym@dcpsmd.org wrote:
Stop sending me emails……
*From:* observium [mailto:observium-bounces@observium.org] *On Behalf Of *Adam Armstrong *Sent:* Thursday, January 08, 2015 7:10 PM *To:* Observium Network Observation System *Subject:* Re: [Observium] Draw error
Use screenshots, you're way more likely that someone will know what you're talking about.
After 8 years of people going "herp derp no graphs" and always meaning something totally different, we kinda just ignore that kind of complaint.
adam.
------ Original Message ------
From: "Darian Jimenez" darian929@gmail.com
To: "Observium Network Observation System" observium@observium.org
Sent: 1/8/2015 8:33:13 AM
Subject: Re: [Observium] Draw error
Nobody know why? Let me know what logs I can post here so that I can be more detailed in explaining.
On Tue, Jan 6, 2015 at 11:27 AM, Darian Jimenez darian929@gmail.com wrote:
Adam,
I was able to fix the problem with permissions and polling now works fine. While I can see the traffic on ports show up now, the graphs don't. If i click on a port and go to real-time it will graph the traffic just fine, however if I look at the graphs for whichever device whether its a cpu/ram/port etc its just blank. It shows the historical data on the graph from months back but not from recent or since the permissions got screwed.
On Fri, Jan 2, 2015 at 5:04 PM, Adam Armstrong adama@memetic.org wrote:
Then that would be related to the context that I said you didn't provide.
Copy/pasting a single word from the debug output is not terribly helpful.
Adam.
Sent with AquaMail for Android http://www.aqua-mail.com
On 2 January 2015 15:40:31 Darian Jimenez darian929@gmail.com wrote:
Adam,
a) you seem to be correct on here. the root user runs the poller and it works, graphs show up etc. these are the current permission on RRD folder. What should they be as this is not running as root.
drwxr-xr-x 249 root root 16384 Jan 2 16:34 rrd
b) removed the index with the two commands you set. Polling still shows SNMP FALSE but the device is alive and well in observium.
what should I set the rrd permission to?
On Fri, Jan 2, 2015 at 4:27 PM, Adam Armstrong adama@memetic.org wrote:
This probably needs a little more context, but it seems like you have two problems :
a) you somehow managed to break the permissions on your rrd directory (or you tried to run the poller as a user who wasn't allowed to write to that folder in the first place, run it as root)
b) SNMP failures are almost always caused by a bullshit net-snmp bug which has existed for about 10 years, you need to do :
rm -rf mibs/.index rm -rf mibs/*/.index
adam.
On 2015-01-02 15:25, Darian Jimenez wrote:
Adam,
I get a bunch of these
stdout[ERROR: opening '/opt/observium/rrd/apc-410-09-pdu-a.xxx.local/perf-poller.rrd': Permission denied]
this happens on all devices I poll.
Also they say this...
SNMP_STATUS[FALSE]
On Fri, Jan 2, 2015 at 4:03 PM, Adam Armstrong adama@memetic.org wrote:
You probably don't want to be doing any of that unless you're able to troubleshoot what is wrong yourself.
You can try manually polling a device from the commandline with debugging enabled :
./poller.php -h <device_id> -d
The output from that might give more information.
adam.
On 2015-01-02 14:32, Darian Jimenez wrote:
Spencer,
Sorry but how can I check on a previous revision number so I can rollback using svn?
On Tue, Dec 30, 2014 at 4:21 PM, Darian Jimenez darian929@gmail.com wrote:
Spencer,
Attached is the picture from the 'RRD command' tab.
How do i see what svn updates are available where can i check previous update #s?
On Tue, Dec 30, 2014 at 1:43 PM, Spencer Gaw spencerg@frii.net wrote: What does the 'RRD Command' section say when looking at a graph?
To rollback, pick a revision and run: 'svn update -r <revision_number>'. You could try incrementally rolling back until things work again, then work forward to see where things break.
Regards,
SG
On 12/29/2014 10:36 AM, Darian Jimenez wrote:
Spencer,
answers to your questions.
1 - All graphs 2 - All devices (network switches/ firewall/ windows servers) 3 - Not 100% sure when it started but it seems like a week ago or about when I did an SVN update. Don't know how to use svn much so no idea on how to rollback. 4 - Debug log hasn't been showing any new data since 12/18/14. I actually asked this on a separate email and no one answered.
The only graphs that are showing up fine are the smokeping ones.
Sorry if it seems like your beating answer out of me but i am for one not a Linux expert and just getting into linux full time. A lot of the simple logs and debugging things I don't know how to do because of this (more experience in windows/networking). Also there is lack of documentation and use of observium so googling doesn't always turn up an answer.
Hope you can help.
observium mailing list observium@observium.org
http://postman.memetic.org/cgi-bin/mailman/listinfo/observium [1] [1]
observium mailing list observium@observium.org http://postman.memetic.org/cgi-bin/mailman/listinfo/observium [1] [1]
Links:
[1] http://postman.memetic.org/cgi-bin/mailman/listinfo/observium [1]
observium mailing list observium@observium.org http://postman.memetic.org/cgi-bin/mailman/listinfo/observium [1]
observium mailing list observium@observium.org http://postman.memetic.org/cgi-bin/mailman/listinfo/observium [1]
Links:
[1] http://postman.memetic.org/cgi-bin/mailman/listinfo/observium
observium mailing list observium@observium.org http://postman.memetic.org/cgi-bin/mailman/listinfo/observium
observium mailing list observium@observium.org http://postman.memetic.org/cgi-bin/mailman/listinfo/observium
observium mailing list observium@observium.org http://postman.memetic.org/cgi-bin/mailman/listinfo/observium
observium mailing list observium@observium.org http://postman.memetic.org/cgi-bin/mailman/listinfo/observium
observium mailing list observium@observium.org http://postman.memetic.org/cgi-bin/mailman/listinfo/observium
participants (4)
-
 Adam Armstrong
 -
 Darian Jimenez
 -
 Kenny, Missy
 -
 Spencer Gaw