Question about health graphs on IOS-XR

Hello,
Is there any reason why Observium doesnt show SFP db levels graphs on IOS-XR devices ?
Thank you

Hi Edvinas,
We have IOS-XR devices aswell and we are able to see those. Share some more information and/or screenshots. Version of IOS-XR, original optics or 3rd party?
Mit freundlichem Gruß Stadtwerke Norderstedt
Denis Klimek
Professional Network Engineer IP-Systemtechnik
Tel: 040 / 521 04 – 1049 Mobil: 0151 / 652 219 06
dklimek@stadtwerke-norderstedt.demailto:dklimek@stadtwerke-norderstedt.de www.stadtwerke-norderstedt.dehttp://www.stadtwerke-norderstedt.de/
Von: observium [mailto:observium-bounces@observium.org] Im Auftrag von Edvinas Kairys via observium Gesendet: Donnerstag, 25. Juli 2019 16:32 An: Observium Cc: Edvinas Kairys Betreff: [Observium] Question about health graphs on IOS-XR
Hello,
Is there any reason why Observium doesnt show SFP db levels graphs on IOS-XR devices ?
Thank you
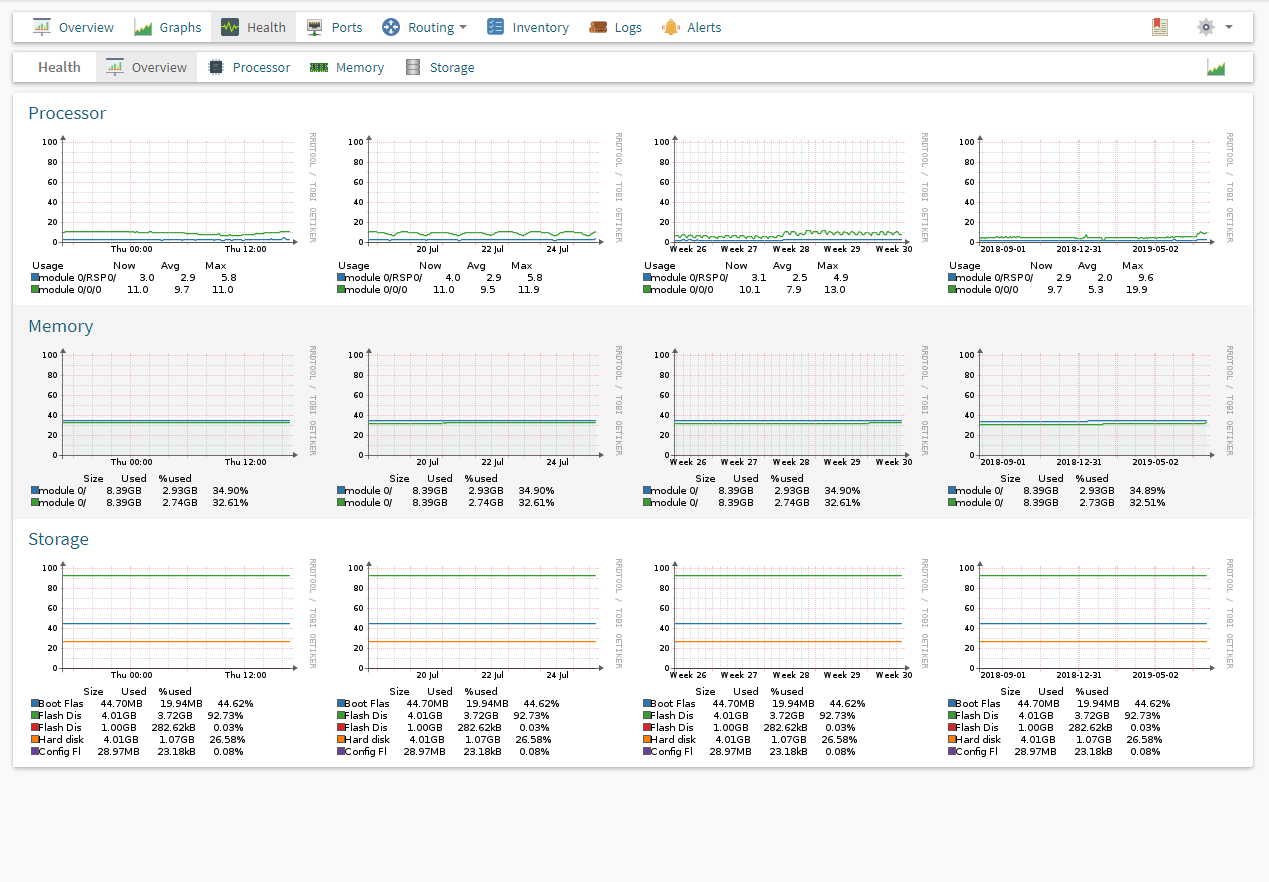
Optics are third party:
NAME: "module mau 0/0/2/3", DESCR: "10GBASE-LR SFP+ Module for SMF" PID: SFP-10G-LR , VID: V02 , SN: SPC1820003Z
show version Cisco IOS XR Software, Version 5.1.3[Default] Copyright (c) 2015 by Cisco Systems, Inc.
Scrreen shot:
[image: image.png]
On Thu, Jul 25, 2019 at 5:42 PM Klimek, Denis < DKlimek@stadtwerke-norderstedt.de> wrote:
Hi Edvinas,
We have IOS-XR devices aswell and we are able to see those. Share some more information and/or screenshots.
Version of IOS-XR, original optics or 3rd party?
Mit freundlichem Gruß
Stadtwerke Norderstedt
*Denis Klimek*
Professional Network Engineer
IP-Systemtechnik
Tel: 040 / 521 04 – 1049
Mobil: 0151 / 652 219 06
dklimek@stadtwerke-norderstedt.de
www.stadtwerke-norderstedt.de
*Von:* observium [mailto:observium-bounces@observium.org] *Im Auftrag von *Edvinas Kairys via observium *Gesendet:* Donnerstag, 25. Juli 2019 16:32 *An:* Observium *Cc:* Edvinas Kairys *Betreff:* [Observium] Question about health graphs on IOS-XR
Hello,
Is there any reason why Observium doesnt show SFP db levels graphs on IOS-XR devices ?
Thank you
A discovery debug would be also nice
./discovery.php –h <id> -m sensors –d
Maybe it’s caused by 3rd party but until 6.5.3 IOS-XR they should be readable even if it’s not original. Since 6.5.3 they must have correct Cisco Profile Branding.
Can you read it trough CLI? “show controller Te….”
Mit freundlichem Gruß Stadtwerke Norderstedt
Denis Klimek
Professional Network Engineer IP-Systemtechnik
Tel: 040 / 521 04 – 1049 Mobil: 0151 / 652 219 06
dklimek@stadtwerke-norderstedt.demailto:dklimek@stadtwerke-norderstedt.de www.stadtwerke-norderstedt.dehttp://www.stadtwerke-norderstedt.de/
Von: Edvinas Kairys [mailto:edvinas.email@gmail.com] Gesendet: Donnerstag, 25. Juli 2019 16:48 An: Klimek, Denis Cc: Observium Betreff: Re: [Observium] Question about health graphs on IOS-XR
Optics are third party:
NAME: "module mau 0/0/2/3", DESCR: "10GBASE-LR SFP+ Module for SMF" PID: SFP-10G-LR , VID: V02 , SN: SPC1820003Z
show version Cisco IOS XR Software, Version 5.1.3[Default] Copyright (c) 2015 by Cisco Systems, Inc.
Scrreen shot:
[image.png]
On Thu, Jul 25, 2019 at 5:42 PM Klimek, Denis <DKlimek@stadtwerke-norderstedt.demailto:DKlimek@stadtwerke-norderstedt.de> wrote: Hi Edvinas,
We have IOS-XR devices aswell and we are able to see those. Share some more information and/or screenshots. Version of IOS-XR, original optics or 3rd party?
Mit freundlichem Gruß Stadtwerke Norderstedt
Denis Klimek
Professional Network Engineer IP-Systemtechnik
Tel: 040 / 521 04 – 1049 Mobil: 0151 / 652 219 06
dklimek@stadtwerke-norderstedt.demailto:dklimek@stadtwerke-norderstedt.de www.stadtwerke-norderstedt.dehttp://www.stadtwerke-norderstedt.de/
Von: observium [mailto:observium-bounces@observium.orgmailto:observium-bounces@observium.org] Im Auftrag von Edvinas Kairys via observium Gesendet: Donnerstag, 25. Juli 2019 16:32 An: Observium Cc: Edvinas Kairys Betreff: [Observium] Question about health graphs on IOS-XR
Hello,
Is there any reason why Observium doesnt show SFP db levels graphs on IOS-XR devices ?
Thank you
hello !
/opt/observium/discovery.php -h ny2asr01 -m sensors –d
___ _ _ / _ \ | |__ ___ ___ _ __ __ __(_) _ _ _ __ ___ | | | || '_ \ / __| / _ | '__|\ \ / /| || | | || '_ ` _ \ | |_| || |_) |__ | __/| | \ V / | || |_| || | | | | | ___/ |_.__/ |___/ ___||_| _/ |_| __,_||_| |_| |_| Observium Professional 19.7.9962 http://www.observium.org
##### Starting discovery run at 2019-07-26 06:47:33 #####
##### ny2asr01 [362] #####
o OS Type iosxr o OS Group cisco o SNMP Version v3 o Last discovery 2019-07-26 05:51:22 o Last duration 81.58 seconds
##### Module Start: sensors #####
o CISCO-ENTITY-SENSOR-MIB o CISCO-ENVMON-MIB Fans o CISCO-ENTITY-FRU-CONTROL-MIB o CISCO-POWER-ETHERNET-EXT-MIB o POWER-ETHERNET-MIB o ENTITY-SENSOR-MIB o CISCO-RF-MIB cRFCfgRedundancyOperMode [!]cRFStatusUnitState [!]cRFStatusPeerUnitState [!]
o Duration 7.6648s
##### ny2asr01 [362] completed discovery modules at 2019-07-26 06:47:41 #####
o Discovery time 7.6735 seconds
##### Finished discovery run at 2019-07-26 06:47:41 #####
o Devices Discovered 1 o Discovery Time 7.939 secs o Memory usage 14MB (peak: 14MB) o MySQL Usage Cell[1/0s] Row[5/0.001s] Rows[36/0.009s] Column[1/0s] Update[1/0.004s] Insert[1/0.003s] Delete[2/0.011s] o RRDTool Usage
show controllers tenGigE 0/0/2/3 Fri Jul 26 08:48:44.162 Summer Operational data for interface TenGigE0/0/2/3:
State: Administrative state: enabled Operational state: Up LED state: Green On
Phy: Media type: R fiber over 1310nm optics Optics: Vendor: CISCO-SUMITOMO Part number: SPP5200LR-C6 Serial number: SPC1820003Z
MAC address information: Operational address: 70e4.2234.93a8 Burnt-in address: 70e4.2232.f5a3 No unicast addresses in filter No multicast addresses in filter
Autonegotiation disabled.
Operational values: Speed: 10Gbps Duplex: Full Duplex Flowcontrol: Bidirectional Loopback: None (or external) MTU: 15808 MRU: 15808 Inter-packet gap: standard (12)
On Thu, Jul 25, 2019 at 6:23 PM Klimek, Denis < DKlimek@stadtwerke-norderstedt.de> wrote:
A discovery debug would be also nice
./discovery.php –h <id> -m sensors –d
Maybe it’s caused by 3rd party but until 6.5.3 IOS-XR they should be readable even if it’s not original.
Since 6.5.3 they must have correct Cisco Profile Branding.
Can you read it trough CLI? “show controller Te….”
Mit freundlichem Gruß
Stadtwerke Norderstedt
*Denis Klimek*
Professional Network Engineer
IP-Systemtechnik
Tel: 040 / 521 04 – 1049
Mobil: 0151 / 652 219 06
dklimek@stadtwerke-norderstedt.de
www.stadtwerke-norderstedt.de
*Von:* Edvinas Kairys [mailto:edvinas.email@gmail.com] *Gesendet:* Donnerstag, 25. Juli 2019 16:48 *An:* Klimek, Denis *Cc:* Observium *Betreff:* Re: [Observium] Question about health graphs on IOS-XR
Optics are third party:
NAME: "module mau 0/0/2/3", DESCR: "10GBASE-LR SFP+ Module for SMF" PID: SFP-10G-LR , VID: V02 , SN: SPC1820003Z
show version Cisco IOS XR Software, Version 5.1.3[Default] Copyright (c) 2015 by Cisco Systems, Inc.
Scrreen shot:
[image: image.png]
On Thu, Jul 25, 2019 at 5:42 PM Klimek, Denis < DKlimek@stadtwerke-norderstedt.de> wrote:
Hi Edvinas,
We have IOS-XR devices aswell and we are able to see those. Share some more information and/or screenshots.
Version of IOS-XR, original optics or 3rd party?
Mit freundlichem Gruß
Stadtwerke Norderstedt
*Denis Klimek*
Professional Network Engineer
IP-Systemtechnik
Tel: 040 / 521 04 – 1049
Mobil: 0151 / 652 219 06
dklimek@stadtwerke-norderstedt.de
www.stadtwerke-norderstedt.de
*Von:* observium [mailto:observium-bounces@observium.org] *Im Auftrag von *Edvinas Kairys via observium *Gesendet:* Donnerstag, 25. Juli 2019 16:32 *An:* Observium *Cc:* Edvinas Kairys *Betreff:* [Observium] Question about health graphs on IOS-XR
Hello,
Is there any reason why Observium doesnt show SFP db levels graphs on IOS-XR devices ?
Thank you

hello,
On 26/07/2019 08:49, Edvinas Kairys via observium wrote:
hello !
/opt/observium/discovery.php -h ny2asr01 -m sensors –d
don't know if it's the same problem or a different one, but as we have sensors involved I'm adding this:
since 2019-07-14, after upgrade to r9962, our observium instance lost all temperature sensors on all cisco devices (many cisco switch and routers with both ios and iosxr)
it is still graphing other brands devices temperatures.
@Edvinas: As you see: Your optic is not transmitting any information for those values. Or you entered wrong command on Cisco CLI ;-) Also your debug log from ./discovery is too small. Looks like you removed most of the information....
Mit freundlichem Gruß Stadtwerke Norderstedt
Denis Klimek Professional Network Engineer IP-Systemtechnik
Tel: 040 / 521 04 – 1049 Mobil: 0151 / 652 219 06 dklimek@stadtwerke-norderstedt.de www.stadtwerke-norderstedt.de
-----Ursprüngliche Nachricht----- Von: observium [mailto:observium-bounces@observium.org] Im Auftrag von emilio brambilla via observium Gesendet: Freitag, 26. Juli 2019 09:20 An: observium@observium.org Cc: emilio brambilla Betreff: Re: [Observium] Question about health graphs on IOS-XR
hello,
On 26/07/2019 08:49, Edvinas Kairys via observium wrote:
hello !
/opt/observium/discovery.php -h ny2asr01 -m sensors –d
don't know if it's the same problem or a different one, but as we have sensors involved I'm adding this:
since 2019-07-14, after upgrade to r9962, our observium instance lost all temperature sensors on all cisco devices (many cisco switch and routers with both ios and iosxr)
it is still graphing other brands devices temperatures.
it provides, i just need to add keyword named *PHY *to get those:
show controllers tenGigE 0/0/2/3 *phy* Fri Jul 26 10:43:13.640 Summer
SFP EEPROM port: 3 Xcvr Type: SFP Xcvr Code: SFP-10G-LR Encoding: 64B66B Bit Rate: 10300 Mbps Link Reach 9u fiber (Km): 10000 meter Link Reach 9u fiber (100m): 10000 meter Vendor Name: CISCO-SUMITOMO Vendor OUI: 00.00.5f Vendor Part Number: SPP5200LR-C6 (rev.: B ) Laser wavelength: 1310 nm (fraction: 0.00 nm) Optional SFP Signal: Tx_Disable, Tx_Fault, LOS Vendor Serial Number: SPC1820003Z Date Code (yy/mm/dd): 14/05/12 lot code: 78 Diagnostic Monitoring: DOM, Int. Cal., Enhanced Options: SW RX LOS Mon., SW TX Fault Mon, SW TX Disable, Alarm/Warning Flags
MSA Data 0x0000: 03 04 07 20 00 00 00 00 : 00 00 00 06 67 00 0a 64 0x0010: 00 00 00 00 43 49 53 43 : 4f 2d 53 55 4d 49 54 4f 0x0020: 4d 4f 20 20 00 00 00 5f : 53 50 50 35 32 30 30 4c 0x0030: 52 2d 43 36 20 20 20 20 : 42 20 20 20 05 1e 00 06 0x0040: 00 1a 00 00 53 50 43 31 : 38 32 30 30 30 33 5a 20 0x0050: 20 20 20 20 31 34 30 35 : 31 32 37 38 68 f0 03 4f 0x0060: 00 00 0b a2 64 ac 18 cb : 55 a5 90 85 ec 03 97 1f 0x0070: 2e b1 97 00 00 00 00 00 : 00 00 00 00 bd 13 55 a4
    Thresholds:                    Alarm High         Warning High
 Warning Low            Alarm Low
          Temperature:            +75.000 C             +70.000 C
     +0.000 C              -5.000 C
              Voltage:           3.630 Volt            3.465 Volt
   3.135 Volt            2.970 Volt
                 Bias:         90.000 mAmps          84.000 mAmps
 24.000 mAmps          20.000 mAmps
       Transmit Power:  2.23870 mW (3.49996 dBm)   1.12200 mW (0.49993
dBm) 0.15140 mW (-8.19874 dBm) 0.06030 mW (-12.19683 dBm) Receive Power: 2.23870 mW (3.49996 dBm) 1.12200 mW (0.49993 dBm) 0.03630 mW (-14.40093 dBm) 0.01450 mW (-18.38632 dBm) Temperature: 36.688 Voltage: 3.293 Volt Tx Bias: 47.504 mAmps Tx Power: 0.44510 mW (-3.51542 dBm) Rx Power: 0.10330 mW (-9.85900 dBm) Oper. Status/Control: EEPROM Memory (A2 lower) 0x0100: 4b 00 fb 00 46 00 00 00 : 8d cc 74 04 87 5a 7a 76 0x0110: af c8 27 10 a4 10 2e e0 : 57 73 02 5b 2b d4 05 ea 0x0120: 57 73 00 91 2b d4 01 6b : 00 00 00 00 00 00 00 00 0x0130: 00 00 00 00 00 00 00 00 : 00 00 00 00 00 00 00 00 0x0140: 00 00 00 00 3f 80 00 00 : 00 00 00 00 01 00 00 00 0x0150: 01 00 00 00 01 00 00 00 : 01 00 00 00 00 00 00 3c 0x0160: 24 b0 80 a7 5c c8 11 63 : 04 09 00 00 00 00 00 00 0x0170: 00 00 00 00 00 00 00 00 : 00 00 00 00 00 00 00 01
    CLEI Code: COUIA75CAA
    Part Number: 10-2457-02 (ver.: V02 )
    Temp/Alarm/Power Flags: COM, commercial 0C to 70C
    Minimum Temperature: 0
    Maximum Temperature: 70
    Calibration Constants: LBC Scale, Temperature, Laser bias current,
Output power, Product Id: SFP-10G-LR EEPROM Memory (A2 upper) 0x0180: 43 4f 55 49 41 37 35 43 : 41 41 31 30 2d 32 34 35 0x0190: 37 2d 30 32 56 30 32 20 : 01 00 46 00 00 00 00 b0 0x01a0: 00 00 00 00 00 00 00 00 : 00 00 8c dd 94 00 ac a5 0x01b0: d6 cd 00 00 1e 00 50 3e : 11 70 0f 2d 00 00 aa aa 0x01c0: 53 46 50 2d 31 30 47 2d : 4c 52 20 20 20 20 20 20 0x01d0: 20 20 20 20 32 33 00 00 : 00 00 00 00 00 00 00 2e 0x01e0: 20 26 2b 30 33 36 2b 36 : 00 00 00 00 00 00 00 00 0x01f0: 00 00 00 00 00 6b 00 00 : ff ff ff ff 00 00 00 00
Maybe this is the problem ?
On Fri, Jul 26, 2019 at 11:26 AM Klimek, Denis via observium < observium@observium.org> wrote:
@Edvinas: As you see: Your optic is not transmitting any information for those values. Or you entered wrong command on Cisco CLI ;-) Also your debug log from ./discovery is too small. Looks like you removed most of the information....
Mit freundlichem Gruß Stadtwerke Norderstedt
Denis Klimek
Professional Network Engineer IP-Systemtechnik
Tel: 040 / 521 04 – 1049 Mobil: 0151 / 652 219 06
dklimek@stadtwerke-norderstedt.de www.stadtwerke-norderstedt.de
-----Ursprüngliche Nachricht----- Von: observium [mailto:observium-bounces@observium.org] Im Auftrag von emilio brambilla via observium Gesendet: Freitag, 26. Juli 2019 09:20 An: observium@observium.org Cc: emilio brambilla Betreff: Re: [Observium] Question about health graphs on IOS-XR
hello,
On 26/07/2019 08:49, Edvinas Kairys via observium wrote:
hello !
/opt/observium/discovery.php -h ny2asr01 -m sensors –d
don't know if it's the same problem or a different one, but as we have sensors involved I'm adding this:
since 2019-07-14, after upgrade to r9962, our observium instance lost all temperature sensors on all cisco devices (many cisco switch and routers with both ios and iosxr)
it is still graphing other brands devices temperatures.
--
bye,
emilio
observium mailing list observium@observium.org http://postman.memetic.org/cgi-bin/mailman/listinfo/observium _______________________________________________ observium mailing list observium@observium.org http://postman.memetic.org/cgi-bin/mailman/listinfo/observium
and i hadn't removed anything:
infra [root@observ001prvitx ~]# /opt/observium/discovery.php -h ny2asr01 -m sensors –d
___ _ _ / _ \ | |__ ___ ___ _ __ __ __(_) _ _ _ __ ___ | | | || '_ \ / __| / _ | '__|\ \ / /| || | | || '_ ` _ \ | |_| || |_) |__ | __/| | \ V / | || |_| || | | | | | ___/ |_.__/ |___/ ___||_| _/ |_| __,_||_| |_| |_| Observium Professional 19.7.9962 http://www.observium.org
##### Starting discovery run at 2019-07-26 08:58:30 #####
##### ny2asr01 [362] #####
o OS Type iosxr o OS Group cisco o SNMP Version v3 o Last discovery 2019-07-26 10:41:36 o Last duration 7.97 seconds
##### Module Start: sensors #####
o CISCO-ENTITY-SENSOR-MIB o CISCO-ENVMON-MIB Fans o CISCO-ENTITY-FRU-CONTROL-MIB o CISCO-POWER-ETHERNET-EXT-MIB o POWER-ETHERNET-MIB o ENTITY-SENSOR-MIB o CISCO-RF-MIB cRFCfgRedundancyOperMode [!]cRFStatusUnitState [!]cRFStatusPeerUnitState [!]
o Duration 7.73s
##### ny2asr01 [362] completed discovery modules at 2019-07-26 08:58:38 #####
o Discovery time 7.7355 seconds
##### Finished discovery run at 2019-07-26 08:58:38 #####
o Devices Discovered 1 o Discovery Time 8.008 secs o Memory usage 14MB (peak: 14MB) o MySQL Usage Cell[1/0s] Row[5/0.001s] Rows[36/0.015s] Column[1/0s] Update[1/0.005s] Insert[1/0.004s] Delete[1/0.006s] o RRDTool Usage infra [root@observ001prvitx ~]#
On Fri, Jul 26, 2019 at 11:44 AM Edvinas Kairys edvinas.email@gmail.com wrote:
it provides, i just need to add keyword named *PHY *to get those:
show controllers tenGigE 0/0/2/3 *phy* Fri Jul 26 10:43:13.640 Summer
SFP EEPROM port: 3 Xcvr Type: SFP Xcvr Code: SFP-10G-LR Encoding: 64B66B Bit Rate: 10300 Mbps Link Reach 9u fiber (Km): 10000 meter Link Reach 9u fiber (100m): 10000 meter Vendor Name: CISCO-SUMITOMO Vendor OUI: 00.00.5f Vendor Part Number: SPP5200LR-C6 (rev.: B ) Laser wavelength: 1310 nm (fraction: 0.00 nm) Optional SFP Signal: Tx_Disable, Tx_Fault, LOS Vendor Serial Number: SPC1820003Z Date Code (yy/mm/dd): 14/05/12 lot code: 78 Diagnostic Monitoring: DOM, Int. Cal., Enhanced Options: SW RX LOS Mon., SW TX Fault Mon, SW TX Disable, Alarm/Warning Flags
MSA Data 0x0000: 03 04 07 20 00 00 00 00 : 00 00 00 06 67 00 0a 64 0x0010: 00 00 00 00 43 49 53 43 : 4f 2d 53 55 4d 49 54 4f 0x0020: 4d 4f 20 20 00 00 00 5f : 53 50 50 35 32 30 30 4c 0x0030: 52 2d 43 36 20 20 20 20 : 42 20 20 20 05 1e 00 06 0x0040: 00 1a 00 00 53 50 43 31 : 38 32 30 30 30 33 5a 20 0x0050: 20 20 20 20 31 34 30 35 : 31 32 37 38 68 f0 03 4f 0x0060: 00 00 0b a2 64 ac 18 cb : 55 a5 90 85 ec 03 97 1f 0x0070: 2e b1 97 00 00 00 00 00 : 00 00 00 00 bd 13 55 a4
Thresholds: Alarm High Warning High Warning Low Alarm Low Temperature: +75.000 C +70.000 C +0.000 C -5.000 C Voltage: 3.630 Volt 3.465 Volt 3.135 Volt 2.970 Volt Bias: 90.000 mAmps 84.000 mAmps 24.000 mAmps 20.000 mAmps Transmit Power: 2.23870 mW (3.49996 dBm) 1.12200 mW (0.49993dBm) 0.15140 mW (-8.19874 dBm) 0.06030 mW (-12.19683 dBm) Receive Power: 2.23870 mW (3.49996 dBm) 1.12200 mW (0.49993 dBm) 0.03630 mW (-14.40093 dBm) 0.01450 mW (-18.38632 dBm) Temperature: 36.688 Voltage: 3.293 Volt Tx Bias: 47.504 mAmps Tx Power: 0.44510 mW (-3.51542 dBm) Rx Power: 0.10330 mW (-9.85900 dBm) Oper. Status/Control: EEPROM Memory (A2 lower) 0x0100: 4b 00 fb 00 46 00 00 00 : 8d cc 74 04 87 5a 7a 76 0x0110: af c8 27 10 a4 10 2e e0 : 57 73 02 5b 2b d4 05 ea 0x0120: 57 73 00 91 2b d4 01 6b : 00 00 00 00 00 00 00 00 0x0130: 00 00 00 00 00 00 00 00 : 00 00 00 00 00 00 00 00 0x0140: 00 00 00 00 3f 80 00 00 : 00 00 00 00 01 00 00 00 0x0150: 01 00 00 00 01 00 00 00 : 01 00 00 00 00 00 00 3c 0x0160: 24 b0 80 a7 5c c8 11 63 : 04 09 00 00 00 00 00 00 0x0170: 00 00 00 00 00 00 00 00 : 00 00 00 00 00 00 00 01
CLEI Code: COUIA75CAA Part Number: 10-2457-02 (ver.: V02 ) Temp/Alarm/Power Flags: COM, commercial 0C to 70C Minimum Temperature: 0 Maximum Temperature: 70 Calibration Constants: LBC Scale, Temperature, Laser bias current,Output power, Product Id: SFP-10G-LR EEPROM Memory (A2 upper) 0x0180: 43 4f 55 49 41 37 35 43 : 41 41 31 30 2d 32 34 35 0x0190: 37 2d 30 32 56 30 32 20 : 01 00 46 00 00 00 00 b0 0x01a0: 00 00 00 00 00 00 00 00 : 00 00 8c dd 94 00 ac a5 0x01b0: d6 cd 00 00 1e 00 50 3e : 11 70 0f 2d 00 00 aa aa 0x01c0: 53 46 50 2d 31 30 47 2d : 4c 52 20 20 20 20 20 20 0x01d0: 20 20 20 20 32 33 00 00 : 00 00 00 00 00 00 00 2e 0x01e0: 20 26 2b 30 33 36 2b 36 : 00 00 00 00 00 00 00 00 0x01f0: 00 00 00 00 00 6b 00 00 : ff ff ff ff 00 00 00 00
Maybe this is the problem ?
On Fri, Jul 26, 2019 at 11:26 AM Klimek, Denis via observium < observium@observium.org> wrote:
@Edvinas: As you see: Your optic is not transmitting any information for those values. Or you entered wrong command on Cisco CLI ;-) Also your debug log from ./discovery is too small. Looks like you removed most of the information....
Mit freundlichem Gruß Stadtwerke Norderstedt
Denis Klimek
Professional Network Engineer IP-Systemtechnik
Tel: 040 / 521 04 – 1049 Mobil: 0151 / 652 219 06
dklimek@stadtwerke-norderstedt.de www.stadtwerke-norderstedt.de
-----Ursprüngliche Nachricht----- Von: observium [mailto:observium-bounces@observium.org] Im Auftrag von emilio brambilla via observium Gesendet: Freitag, 26. Juli 2019 09:20 An: observium@observium.org Cc: emilio brambilla Betreff: Re: [Observium] Question about health graphs on IOS-XR
hello,
On 26/07/2019 08:49, Edvinas Kairys via observium wrote:
hello !
/opt/observium/discovery.php -h ny2asr01 -m sensors –d
don't know if it's the same problem or a different one, but as we have sensors involved I'm adding this:
since 2019-07-14, after upgrade to r9962, our observium instance lost all temperature sensors on all cisco devices (many cisco switch and routers with both ios and iosxr)
it is still graphing other brands devices temperatures.
--
bye,
emilio
observium mailing list observium@observium.org http://postman.memetic.org/cgi-bin/mailman/listinfo/observium _______________________________________________ observium mailing list observium@observium.org http://postman.memetic.org/cgi-bin/mailman/listinfo/observium

You do not use the right symbol in front of the debug flag. You can see the - is a little bit longer in front of the "-d" in your command which makes it ignore the debug flag. (or this mail just changed font?) Use the -d and put all the output on pastebin or similar as the text output will be huge. /Markus
Den fre 26 juli 2019 10:59Edvinas Kairys via observium < observium@observium.org> skrev:
and i hadn't removed anything:
infra [root@observ001prvitx ~]# /opt/observium/discovery.php -h ny2asr01 -m sensors –d
/ _ \ | |__ ___ ___ _ __ __ __(_) _ _ _ __ ___ | | | || '_ \ / __| / _ | '__|\ \ / /| || | | || '_ ` _ \ | |_| || |_) |__ | __/| | \ V / | || |_| || | | | | | ___/ |_.__/ |___/ ___||_| _/ |_| __,_||_| |_| |_| Observium Professional 19.7.9962 http://www.observium.org
##### Starting discovery run at 2019-07-26 08:58:30 #####
##### ny2asr01 [362] #####
o OS Type iosxr o OS Group cisco o SNMP Version v3 o Last discovery 2019-07-26 10:41:36 o Last duration 7.97 seconds
##### Module Start: sensors #####
o CISCO-ENTITY-SENSOR-MIB o CISCO-ENVMON-MIB Fans o CISCO-ENTITY-FRU-CONTROL-MIB o CISCO-POWER-ETHERNET-EXT-MIB o POWER-ETHERNET-MIB o ENTITY-SENSOR-MIB o CISCO-RF-MIB cRFCfgRedundancyOperMode [!]cRFStatusUnitState [!]cRFStatusPeerUnitState [!]
o Duration 7.73s
##### ny2asr01 [362] completed discovery modules at 2019-07-26 08:58:38 #####
o Discovery time 7.7355 seconds
##### Finished discovery run at 2019-07-26 08:58:38 #####
o Devices Discovered 1 o Discovery Time 8.008 secs o Memory usage 14MB (peak: 14MB) o MySQL Usage Cell[1/0s] Row[5/0.001s] Rows[36/0.015s] Column[1/0s] Update[1/0.005s] Insert[1/0.004s] Delete[1/0.006s] o RRDTool Usage infra [root@observ001prvitx ~]#
On Fri, Jul 26, 2019 at 11:44 AM Edvinas Kairys edvinas.email@gmail.com wrote:
it provides, i just need to add keyword named *PHY *to get those:
show controllers tenGigE 0/0/2/3 *phy* Fri Jul 26 10:43:13.640 Summer
SFP EEPROM port: 3 Xcvr Type: SFP Xcvr Code: SFP-10G-LR Encoding: 64B66B Bit Rate: 10300 Mbps Link Reach 9u fiber (Km): 10000 meter Link Reach 9u fiber (100m): 10000 meter Vendor Name: CISCO-SUMITOMO Vendor OUI: 00.00.5f Vendor Part Number: SPP5200LR-C6 (rev.: B ) Laser wavelength: 1310 nm (fraction: 0.00 nm) Optional SFP Signal: Tx_Disable, Tx_Fault, LOS Vendor Serial Number: SPC1820003Z Date Code (yy/mm/dd): 14/05/12 lot code: 78 Diagnostic Monitoring: DOM, Int. Cal., Enhanced Options: SW RX LOS Mon., SW TX Fault Mon, SW TX Disable, Alarm/Warning Flags
MSA Data 0x0000: 03 04 07 20 00 00 00 00 : 00 00 00 06 67 00 0a 64 0x0010: 00 00 00 00 43 49 53 43 : 4f 2d 53 55 4d 49 54 4f 0x0020: 4d 4f 20 20 00 00 00 5f : 53 50 50 35 32 30 30 4c 0x0030: 52 2d 43 36 20 20 20 20 : 42 20 20 20 05 1e 00 06 0x0040: 00 1a 00 00 53 50 43 31 : 38 32 30 30 30 33 5a 20 0x0050: 20 20 20 20 31 34 30 35 : 31 32 37 38 68 f0 03 4f 0x0060: 00 00 0b a2 64 ac 18 cb : 55 a5 90 85 ec 03 97 1f 0x0070: 2e b1 97 00 00 00 00 00 : 00 00 00 00 bd 13 55 a4
    Thresholds:                    Alarm High         Warning High
   Warning Low            Alarm Low
          Temperature:            +75.000 C             +70.000 C
       +0.000 C              -5.000 C
              Voltage:           3.630 Volt            3.465 Volt
     3.135 Volt            2.970 Volt
                 Bias:         90.000 mAmps          84.000 mAmps
   24.000 mAmps          20.000 mAmps
       Transmit Power:  2.23870 mW (3.49996 dBm)   1.12200 mW
(0.49993 dBm) 0.15140 mW (-8.19874 dBm) 0.06030 mW (-12.19683 dBm) Receive Power: 2.23870 mW (3.49996 dBm) 1.12200 mW (0.49993 dBm) 0.03630 mW (-14.40093 dBm) 0.01450 mW (-18.38632 dBm) Temperature: 36.688 Voltage: 3.293 Volt Tx Bias: 47.504 mAmps Tx Power: 0.44510 mW (-3.51542 dBm) Rx Power: 0.10330 mW (-9.85900 dBm) Oper. Status/Control: EEPROM Memory (A2 lower) 0x0100: 4b 00 fb 00 46 00 00 00 : 8d cc 74 04 87 5a 7a 76 0x0110: af c8 27 10 a4 10 2e e0 : 57 73 02 5b 2b d4 05 ea 0x0120: 57 73 00 91 2b d4 01 6b : 00 00 00 00 00 00 00 00 0x0130: 00 00 00 00 00 00 00 00 : 00 00 00 00 00 00 00 00 0x0140: 00 00 00 00 3f 80 00 00 : 00 00 00 00 01 00 00 00 0x0150: 01 00 00 00 01 00 00 00 : 01 00 00 00 00 00 00 3c 0x0160: 24 b0 80 a7 5c c8 11 63 : 04 09 00 00 00 00 00 00 0x0170: 00 00 00 00 00 00 00 00 : 00 00 00 00 00 00 00 01
    CLEI Code: COUIA75CAA
    Part Number: 10-2457-02 (ver.: V02 )
    Temp/Alarm/Power Flags: COM, commercial 0C to 70C
    Minimum Temperature: 0
    Maximum Temperature: 70
    Calibration Constants: LBC Scale, Temperature, Laser bias
current, Output power, Product Id: SFP-10G-LR EEPROM Memory (A2 upper) 0x0180: 43 4f 55 49 41 37 35 43 : 41 41 31 30 2d 32 34 35 0x0190: 37 2d 30 32 56 30 32 20 : 01 00 46 00 00 00 00 b0 0x01a0: 00 00 00 00 00 00 00 00 : 00 00 8c dd 94 00 ac a5 0x01b0: d6 cd 00 00 1e 00 50 3e : 11 70 0f 2d 00 00 aa aa 0x01c0: 53 46 50 2d 31 30 47 2d : 4c 52 20 20 20 20 20 20 0x01d0: 20 20 20 20 32 33 00 00 : 00 00 00 00 00 00 00 2e 0x01e0: 20 26 2b 30 33 36 2b 36 : 00 00 00 00 00 00 00 00 0x01f0: 00 00 00 00 00 6b 00 00 : ff ff ff ff 00 00 00 00
Maybe this is the problem ?
On Fri, Jul 26, 2019 at 11:26 AM Klimek, Denis via observium < observium@observium.org> wrote:
@Edvinas: As you see: Your optic is not transmitting any information for those values. Or you entered wrong command on Cisco CLI ;-) Also your debug log from ./discovery is too small. Looks like you removed most of the information....
Mit freundlichem Gruß Stadtwerke Norderstedt
Denis Klimek
Professional Network Engineer IP-Systemtechnik
Tel: 040 / 521 04 – 1049 Mobil: 0151 / 652 219 06
dklimek@stadtwerke-norderstedt.de www.stadtwerke-norderstedt.de
-----Ursprüngliche Nachricht----- Von: observium [mailto:observium-bounces@observium.org] Im Auftrag von emilio brambilla via observium Gesendet: Freitag, 26. Juli 2019 09:20 An: observium@observium.org Cc: emilio brambilla Betreff: Re: [Observium] Question about health graphs on IOS-XR
hello,
On 26/07/2019 08:49, Edvinas Kairys via observium wrote:
hello !
/opt/observium/discovery.php -h ny2asr01 -m sensors –d
don't know if it's the same problem or a different one, but as we have sensors involved I'm adding this:
since 2019-07-14, after upgrade to r9962, our observium instance lost all temperature sensors on all cisco devices (many cisco switch and routers with both ios and iosxr)
it is still graphing other brands devices temperatures.
--
bye,
emilio
observium mailing list observium@observium.org http://postman.memetic.org/cgi-bin/mailman/listinfo/observium _______________________________________________ observium mailing list observium@observium.org http://postman.memetic.org/cgi-bin/mailman/listinfo/observium
observium mailing list observium@observium.org http://postman.memetic.org/cgi-bin/mailman/listinfo/observium
I think i do OK. https://pastebin.com/y47YPYq8
On Fri, Jul 26, 2019 at 12:52 PM Markus Klock markus@best-practice.se wrote:
You do not use the right symbol in front of the debug flag. You can see the - is a little bit longer in front of the "-d" in your command which makes it ignore the debug flag. (or this mail just changed font?) Use the -d and put all the output on pastebin or similar as the text output will be huge. /Markus
Den fre 26 juli 2019 10:59Edvinas Kairys via observium < observium@observium.org> skrev:
and i hadn't removed anything:
infra [root@observ001prvitx ~]# /opt/observium/discovery.php -h ny2asr01 -m sensors –d
/ _ \ | |__ ___ ___ _ __ __ __(_) _ _ _ __ ___ | | | || '_ \ / __| / _ | '__|\ \ / /| || | | || '_ ` _ \ | |_| || |_) |__ | __/| | \ V / | || |_| || | | | | | ___/ |_.__/ |___/ ___||_| _/ |_| __,_||_| |_| |_| Observium Professional 19.7.9962 http://www.observium.org
##### Starting discovery run at 2019-07-26 08:58:30 #####
##### ny2asr01 [362] #####
o OS Type iosxr o OS Group cisco o SNMP Version v3 o Last discovery 2019-07-26 10:41:36 o Last duration 7.97 seconds
##### Module Start: sensors #####
o CISCO-ENTITY-SENSOR-MIB o CISCO-ENVMON-MIB Fans o CISCO-ENTITY-FRU-CONTROL-MIB o CISCO-POWER-ETHERNET-EXT-MIB o POWER-ETHERNET-MIB o ENTITY-SENSOR-MIB o CISCO-RF-MIB cRFCfgRedundancyOperMode [!]cRFStatusUnitState [!]cRFStatusPeerUnitState [!]
o Duration 7.73s
##### ny2asr01 [362] completed discovery modules at 2019-07-26 08:58:38 #####
o Discovery time 7.7355 seconds
##### Finished discovery run at 2019-07-26 08:58:38 #####
o Devices Discovered 1 o Discovery Time 8.008 secs o Memory usage 14MB (peak: 14MB) o MySQL Usage Cell[1/0s] Row[5/0.001s] Rows[36/0.015s] Column[1/0s] Update[1/0.005s] Insert[1/0.004s] Delete[1/0.006s] o RRDTool Usage infra [root@observ001prvitx ~]#
On Fri, Jul 26, 2019 at 11:44 AM Edvinas Kairys edvinas.email@gmail.com wrote:
it provides, i just need to add keyword named *PHY *to get those:
show controllers tenGigE 0/0/2/3 *phy* Fri Jul 26 10:43:13.640 Summer
SFP EEPROM port: 3 Xcvr Type: SFP Xcvr Code: SFP-10G-LR Encoding: 64B66B Bit Rate: 10300 Mbps Link Reach 9u fiber (Km): 10000 meter Link Reach 9u fiber (100m): 10000 meter Vendor Name: CISCO-SUMITOMO Vendor OUI: 00.00.5f Vendor Part Number: SPP5200LR-C6 (rev.: B ) Laser wavelength: 1310 nm (fraction: 0.00 nm) Optional SFP Signal: Tx_Disable, Tx_Fault, LOS Vendor Serial Number: SPC1820003Z Date Code (yy/mm/dd): 14/05/12 lot code: 78 Diagnostic Monitoring: DOM, Int. Cal., Enhanced Options: SW RX LOS Mon., SW TX Fault Mon, SW TX Disable, Alarm/Warning Flags
MSA Data 0x0000: 03 04 07 20 00 00 00 00 : 00 00 00 06 67 00 0a 64 0x0010: 00 00 00 00 43 49 53 43 : 4f 2d 53 55 4d 49 54 4f 0x0020: 4d 4f 20 20 00 00 00 5f : 53 50 50 35 32 30 30 4c 0x0030: 52 2d 43 36 20 20 20 20 : 42 20 20 20 05 1e 00 06 0x0040: 00 1a 00 00 53 50 43 31 : 38 32 30 30 30 33 5a 20 0x0050: 20 20 20 20 31 34 30 35 : 31 32 37 38 68 f0 03 4f 0x0060: 00 00 0b a2 64 ac 18 cb : 55 a5 90 85 ec 03 97 1f 0x0070: 2e b1 97 00 00 00 00 00 : 00 00 00 00 bd 13 55 a4
    Thresholds:                    Alarm High         Warning High
     Warning Low            Alarm Low
          Temperature:            +75.000 C             +70.000 C
       +0.000 C              -5.000 C
              Voltage:           3.630 Volt            3.465 Volt
     3.135 Volt            2.970 Volt
                 Bias:         90.000 mAmps          84.000 mAmps
   24.000 mAmps          20.000 mAmps
       Transmit Power:  2.23870 mW (3.49996 dBm)   1.12200 mW
(0.49993 dBm) 0.15140 mW (-8.19874 dBm) 0.06030 mW (-12.19683 dBm) Receive Power: 2.23870 mW (3.49996 dBm) 1.12200 mW (0.49993 dBm) 0.03630 mW (-14.40093 dBm) 0.01450 mW (-18.38632 dBm) Temperature: 36.688 Voltage: 3.293 Volt Tx Bias: 47.504 mAmps Tx Power: 0.44510 mW (-3.51542 dBm) Rx Power: 0.10330 mW (-9.85900 dBm) Oper. Status/Control: EEPROM Memory (A2 lower) 0x0100: 4b 00 fb 00 46 00 00 00 : 8d cc 74 04 87 5a 7a 76 0x0110: af c8 27 10 a4 10 2e e0 : 57 73 02 5b 2b d4 05 ea 0x0120: 57 73 00 91 2b d4 01 6b : 00 00 00 00 00 00 00 00 0x0130: 00 00 00 00 00 00 00 00 : 00 00 00 00 00 00 00 00 0x0140: 00 00 00 00 3f 80 00 00 : 00 00 00 00 01 00 00 00 0x0150: 01 00 00 00 01 00 00 00 : 01 00 00 00 00 00 00 3c 0x0160: 24 b0 80 a7 5c c8 11 63 : 04 09 00 00 00 00 00 00 0x0170: 00 00 00 00 00 00 00 00 : 00 00 00 00 00 00 00 01
    CLEI Code: COUIA75CAA
    Part Number: 10-2457-02 (ver.: V02 )
    Temp/Alarm/Power Flags: COM, commercial 0C to 70C
    Minimum Temperature: 0
    Maximum Temperature: 70
    Calibration Constants: LBC Scale, Temperature, Laser bias
current, Output power, Product Id: SFP-10G-LR EEPROM Memory (A2 upper) 0x0180: 43 4f 55 49 41 37 35 43 : 41 41 31 30 2d 32 34 35 0x0190: 37 2d 30 32 56 30 32 20 : 01 00 46 00 00 00 00 b0 0x01a0: 00 00 00 00 00 00 00 00 : 00 00 8c dd 94 00 ac a5 0x01b0: d6 cd 00 00 1e 00 50 3e : 11 70 0f 2d 00 00 aa aa 0x01c0: 53 46 50 2d 31 30 47 2d : 4c 52 20 20 20 20 20 20 0x01d0: 20 20 20 20 32 33 00 00 : 00 00 00 00 00 00 00 2e 0x01e0: 20 26 2b 30 33 36 2b 36 : 00 00 00 00 00 00 00 00 0x01f0: 00 00 00 00 00 6b 00 00 : ff ff ff ff 00 00 00 00
Maybe this is the problem ?
On Fri, Jul 26, 2019 at 11:26 AM Klimek, Denis via observium < observium@observium.org> wrote:
@Edvinas: As you see: Your optic is not transmitting any information for those values. Or you entered wrong command on Cisco CLI ;-) Also your debug log from ./discovery is too small. Looks like you removed most of the information....
Mit freundlichem Gruß Stadtwerke Norderstedt
Denis Klimek
Professional Network Engineer IP-Systemtechnik
Tel: 040 / 521 04 – 1049 Mobil: 0151 / 652 219 06
dklimek@stadtwerke-norderstedt.de www.stadtwerke-norderstedt.de
-----Ursprüngliche Nachricht----- Von: observium [mailto:observium-bounces@observium.org] Im Auftrag von emilio brambilla via observium Gesendet: Freitag, 26. Juli 2019 09:20 An: observium@observium.org Cc: emilio brambilla Betreff: Re: [Observium] Question about health graphs on IOS-XR
hello,
On 26/07/2019 08:49, Edvinas Kairys via observium wrote:
hello !
/opt/observium/discovery.php -h ny2asr01 -m sensors –d
don't know if it's the same problem or a different one, but as we have sensors involved I'm adding this:
since 2019-07-14, after upgrade to r9962, our observium instance lost all temperature sensors on all cisco devices (many cisco switch and routers with both ios and iosxr)
it is still graphing other brands devices temperatures.
--
bye,
emilio
observium mailing list observium@observium.org http://postman.memetic.org/cgi-bin/mailman/listinfo/observium _______________________________________________ observium mailing list observium@observium.org http://postman.memetic.org/cgi-bin/mailman/listinfo/observium
observium mailing list observium@observium.org http://postman.memetic.org/cgi-bin/mailman/listinfo/observium
Strange. Its still not running debug mode. Try moving the -d before -m. /Markus
Den fre 26 juli 2019 13:00Edvinas Kairys edvinas.email@gmail.com skrev:
I think i do OK. https://pastebin.com/y47YPYq8
On Fri, Jul 26, 2019 at 12:52 PM Markus Klock markus@best-practice.se wrote:
You do not use the right symbol in front of the debug flag. You can see the - is a little bit longer in front of the "-d" in your command which makes it ignore the debug flag. (or this mail just changed font?) Use the -d and put all the output on pastebin or similar as the text output will be huge. /Markus
Den fre 26 juli 2019 10:59Edvinas Kairys via observium < observium@observium.org> skrev:
and i hadn't removed anything:
infra [root@observ001prvitx ~]# /opt/observium/discovery.php -h ny2asr01 -m sensors –d
/ _ \ | |__ ___ ___ _ __ __ __(_) _ _ _ __ ___ | | | || '_ \ / __| / _ | '__|\ \ / /| || | | || '_ ` _ \ | |_| || |_) |__ | __/| | \ V / | || |_| || | | | | | ___/ |_.__/ |___/ ___||_| _/ |_| __,_||_| |_| |_| Observium Professional 19.7.9962 http://www.observium.org
##### Starting discovery run at 2019-07-26 08:58:30 #####
##### ny2asr01 [362] #####
o OS Type iosxr o OS Group cisco o SNMP Version v3 o Last discovery 2019-07-26 10:41:36 o Last duration 7.97 seconds
##### Module Start: sensors #####
o CISCO-ENTITY-SENSOR-MIB o CISCO-ENVMON-MIB Fans o CISCO-ENTITY-FRU-CONTROL-MIB o CISCO-POWER-ETHERNET-EXT-MIB o POWER-ETHERNET-MIB o ENTITY-SENSOR-MIB o CISCO-RF-MIB cRFCfgRedundancyOperMode [!]cRFStatusUnitState [!]cRFStatusPeerUnitState [!]
o Duration 7.73s
##### ny2asr01 [362] completed discovery modules at 2019-07-26 08:58:38 #####
o Discovery time 7.7355 seconds
##### Finished discovery run at 2019-07-26 08:58:38 #####
o Devices Discovered 1 o Discovery Time 8.008 secs o Memory usage 14MB (peak: 14MB) o MySQL Usage Cell[1/0s] Row[5/0.001s] Rows[36/0.015s] Column[1/0s] Update[1/0.005s] Insert[1/0.004s] Delete[1/0.006s] o RRDTool Usage infra [root@observ001prvitx ~]#
On Fri, Jul 26, 2019 at 11:44 AM Edvinas Kairys edvinas.email@gmail.com wrote:
it provides, i just need to add keyword named *PHY *to get those:
show controllers tenGigE 0/0/2/3 *phy* Fri Jul 26 10:43:13.640 Summer
SFP EEPROM port: 3 Xcvr Type: SFP Xcvr Code: SFP-10G-LR Encoding: 64B66B Bit Rate: 10300 Mbps Link Reach 9u fiber (Km): 10000 meter Link Reach 9u fiber (100m): 10000 meter Vendor Name: CISCO-SUMITOMO Vendor OUI: 00.00.5f Vendor Part Number: SPP5200LR-C6 (rev.: B ) Laser wavelength: 1310 nm (fraction: 0.00 nm) Optional SFP Signal: Tx_Disable, Tx_Fault, LOS Vendor Serial Number: SPC1820003Z Date Code (yy/mm/dd): 14/05/12 lot code: 78 Diagnostic Monitoring: DOM, Int. Cal., Enhanced Options: SW RX LOS Mon., SW TX Fault Mon, SW TX Disable, Alarm/Warning Flags
MSA Data 0x0000: 03 04 07 20 00 00 00 00 : 00 00 00 06 67 00 0a 64 0x0010: 00 00 00 00 43 49 53 43 : 4f 2d 53 55 4d 49 54 4f 0x0020: 4d 4f 20 20 00 00 00 5f : 53 50 50 35 32 30 30 4c 0x0030: 52 2d 43 36 20 20 20 20 : 42 20 20 20 05 1e 00 06 0x0040: 00 1a 00 00 53 50 43 31 : 38 32 30 30 30 33 5a 20 0x0050: 20 20 20 20 31 34 30 35 : 31 32 37 38 68 f0 03 4f 0x0060: 00 00 0b a2 64 ac 18 cb : 55 a5 90 85 ec 03 97 1f 0x0070: 2e b1 97 00 00 00 00 00 : 00 00 00 00 bd 13 55 a4
    Thresholds:                    Alarm High         Warning High
     Warning Low            Alarm Low
          Temperature:            +75.000 C             +70.000 C
         +0.000 C              -5.000 C
              Voltage:           3.630 Volt            3.465 Volt
       3.135 Volt            2.970 Volt
                 Bias:         90.000 mAmps          84.000 mAmps
     24.000 mAmps          20.000 mAmps
       Transmit Power:  2.23870 mW (3.49996 dBm)   1.12200 mW
(0.49993 dBm) 0.15140 mW (-8.19874 dBm) 0.06030 mW (-12.19683 dBm) Receive Power: 2.23870 mW (3.49996 dBm) 1.12200 mW (0.49993 dBm) 0.03630 mW (-14.40093 dBm) 0.01450 mW (-18.38632 dBm) Temperature: 36.688 Voltage: 3.293 Volt Tx Bias: 47.504 mAmps Tx Power: 0.44510 mW (-3.51542 dBm) Rx Power: 0.10330 mW (-9.85900 dBm) Oper. Status/Control: EEPROM Memory (A2 lower) 0x0100: 4b 00 fb 00 46 00 00 00 : 8d cc 74 04 87 5a 7a 76 0x0110: af c8 27 10 a4 10 2e e0 : 57 73 02 5b 2b d4 05 ea 0x0120: 57 73 00 91 2b d4 01 6b : 00 00 00 00 00 00 00 00 0x0130: 00 00 00 00 00 00 00 00 : 00 00 00 00 00 00 00 00 0x0140: 00 00 00 00 3f 80 00 00 : 00 00 00 00 01 00 00 00 0x0150: 01 00 00 00 01 00 00 00 : 01 00 00 00 00 00 00 3c 0x0160: 24 b0 80 a7 5c c8 11 63 : 04 09 00 00 00 00 00 00 0x0170: 00 00 00 00 00 00 00 00 : 00 00 00 00 00 00 00 01
    CLEI Code: COUIA75CAA
    Part Number: 10-2457-02 (ver.: V02 )
    Temp/Alarm/Power Flags: COM, commercial 0C to 70C
    Minimum Temperature: 0
    Maximum Temperature: 70
    Calibration Constants: LBC Scale, Temperature, Laser bias
current, Output power, Product Id: SFP-10G-LR EEPROM Memory (A2 upper) 0x0180: 43 4f 55 49 41 37 35 43 : 41 41 31 30 2d 32 34 35 0x0190: 37 2d 30 32 56 30 32 20 : 01 00 46 00 00 00 00 b0 0x01a0: 00 00 00 00 00 00 00 00 : 00 00 8c dd 94 00 ac a5 0x01b0: d6 cd 00 00 1e 00 50 3e : 11 70 0f 2d 00 00 aa aa 0x01c0: 53 46 50 2d 31 30 47 2d : 4c 52 20 20 20 20 20 20 0x01d0: 20 20 20 20 32 33 00 00 : 00 00 00 00 00 00 00 2e 0x01e0: 20 26 2b 30 33 36 2b 36 : 00 00 00 00 00 00 00 00 0x01f0: 00 00 00 00 00 6b 00 00 : ff ff ff ff 00 00 00 00
Maybe this is the problem ?
On Fri, Jul 26, 2019 at 11:26 AM Klimek, Denis via observium < observium@observium.org> wrote:
@Edvinas: As you see: Your optic is not transmitting any information for those values. Or you entered wrong command on Cisco CLI ;-) Also your debug log from ./discovery is too small. Looks like you removed most of the information....
Mit freundlichem Gruß Stadtwerke Norderstedt
Denis Klimek
Professional Network Engineer IP-Systemtechnik
Tel: 040 / 521 04 – 1049 Mobil: 0151 / 652 219 06
dklimek@stadtwerke-norderstedt.de www.stadtwerke-norderstedt.de
-----Ursprüngliche Nachricht----- Von: observium [mailto:observium-bounces@observium.org] Im Auftrag von emilio brambilla via observium Gesendet: Freitag, 26. Juli 2019 09:20 An: observium@observium.org Cc: emilio brambilla Betreff: Re: [Observium] Question about health graphs on IOS-XR
hello,
On 26/07/2019 08:49, Edvinas Kairys via observium wrote:
hello !
/opt/observium/discovery.php -h ny2asr01 -m sensors –d
don't know if it's the same problem or a different one, but as we have sensors involved I'm adding this:
since 2019-07-14, after upgrade to r9962, our observium instance lost all temperature sensors on all cisco devices (many cisco switch and routers with both ios and iosxr)
it is still graphing other brands devices temperatures.
--
bye,
emilio
observium mailing list observium@observium.org http://postman.memetic.org/cgi-bin/mailman/listinfo/observium _______________________________________________ observium mailing list observium@observium.org http://postman.memetic.org/cgi-bin/mailman/listinfo/observium
observium mailing list observium@observium.org http://postman.memetic.org/cgi-bin/mailman/listinfo/observium
here we go:
On Fri, Jul 26, 2019 at 2:39 PM Markus Klock markus@best-practice.se wrote:
Strange. Its still not running debug mode. Try moving the -d before -m. /Markus
Den fre 26 juli 2019 13:00Edvinas Kairys edvinas.email@gmail.com skrev:
I think i do OK. https://pastebin.com/y47YPYq8
On Fri, Jul 26, 2019 at 12:52 PM Markus Klock markus@best-practice.se wrote:
You do not use the right symbol in front of the debug flag. You can see the - is a little bit longer in front of the "-d" in your command which makes it ignore the debug flag. (or this mail just changed font?) Use the -d and put all the output on pastebin or similar as the text output will be huge. /Markus
Den fre 26 juli 2019 10:59Edvinas Kairys via observium < observium@observium.org> skrev:
and i hadn't removed anything:
infra [root@observ001prvitx ~]# /opt/observium/discovery.php -h ny2asr01 -m sensors –d
/ _ \ | |__ ___ ___ _ __ __ __(_) _ _ _ __ ___ | | | || '_ \ / __| / _ | '__|\ \ / /| || | | || '_ ` _ \ | |_| || |_) |__ | __/| | \ V / | || |_| || | | | | | ___/ |_.__/ |___/ ___||_| _/ |_| __,_||_| |_| |_| Observium Professional 19.7.9962 http://www.observium.org
##### Starting discovery run at 2019-07-26 08:58:30 #####
##### ny2asr01 [362] #####
o OS Type iosxr o OS Group cisco o SNMP Version v3 o Last discovery 2019-07-26 10:41:36 o Last duration 7.97 seconds
##### Module Start: sensors #####
o CISCO-ENTITY-SENSOR-MIB o CISCO-ENVMON-MIB Fans o CISCO-ENTITY-FRU-CONTROL-MIB o CISCO-POWER-ETHERNET-EXT-MIB o POWER-ETHERNET-MIB o ENTITY-SENSOR-MIB o CISCO-RF-MIB cRFCfgRedundancyOperMode [!]cRFStatusUnitState [!]cRFStatusPeerUnitState [!]
o Duration 7.73s
##### ny2asr01 [362] completed discovery modules at 2019-07-26 08:58:38 #####
o Discovery time 7.7355 seconds
##### Finished discovery run at 2019-07-26 08:58:38 #####
o Devices Discovered 1 o Discovery Time 8.008 secs o Memory usage 14MB (peak: 14MB) o MySQL Usage Cell[1/0s] Row[5/0.001s] Rows[36/0.015s] Column[1/0s] Update[1/0.005s] Insert[1/0.004s] Delete[1/0.006s] o RRDTool Usage infra [root@observ001prvitx ~]#
On Fri, Jul 26, 2019 at 11:44 AM Edvinas Kairys < edvinas.email@gmail.com> wrote:
it provides, i just need to add keyword named *PHY *to get those:
show controllers tenGigE 0/0/2/3 *phy* Fri Jul 26 10:43:13.640 Summer
SFP EEPROM port: 3 Xcvr Type: SFP Xcvr Code: SFP-10G-LR Encoding: 64B66B Bit Rate: 10300 Mbps Link Reach 9u fiber (Km): 10000 meter Link Reach 9u fiber (100m): 10000 meter Vendor Name: CISCO-SUMITOMO Vendor OUI: 00.00.5f Vendor Part Number: SPP5200LR-C6 (rev.: B ) Laser wavelength: 1310 nm (fraction: 0.00 nm) Optional SFP Signal: Tx_Disable, Tx_Fault, LOS Vendor Serial Number: SPC1820003Z Date Code (yy/mm/dd): 14/05/12 lot code: 78 Diagnostic Monitoring: DOM, Int. Cal., Enhanced Options: SW RX LOS Mon., SW TX Fault Mon, SW TX Disable, Alarm/Warning Flags
MSA Data 0x0000: 03 04 07 20 00 00 00 00 : 00 00 00 06 67 00 0a 64 0x0010: 00 00 00 00 43 49 53 43 : 4f 2d 53 55 4d 49 54 4f 0x0020: 4d 4f 20 20 00 00 00 5f : 53 50 50 35 32 30 30 4c 0x0030: 52 2d 43 36 20 20 20 20 : 42 20 20 20 05 1e 00 06 0x0040: 00 1a 00 00 53 50 43 31 : 38 32 30 30 30 33 5a 20 0x0050: 20 20 20 20 31 34 30 35 : 31 32 37 38 68 f0 03 4f 0x0060: 00 00 0b a2 64 ac 18 cb : 55 a5 90 85 ec 03 97 1f 0x0070: 2e b1 97 00 00 00 00 00 : 00 00 00 00 bd 13 55 a4
Thresholds: Alarm High Warning High Warning Low Alarm Low Temperature: +75.000 C +70.000 C +0.000 C -5.000 C Voltage: 3.630 Volt 3.465 Volt 3.135 Volt 2.970 Volt Bias: 90.000 mAmps 84.000 mAmps 24.000 mAmps 20.000 mAmps Transmit Power: 2.23870 mW (3.49996 dBm) 1.12200 mW(0.49993 dBm) 0.15140 mW (-8.19874 dBm) 0.06030 mW (-12.19683 dBm) Receive Power: 2.23870 mW (3.49996 dBm) 1.12200 mW (0.49993 dBm) 0.03630 mW (-14.40093 dBm) 0.01450 mW (-18.38632 dBm) Temperature: 36.688 Voltage: 3.293 Volt Tx Bias: 47.504 mAmps Tx Power: 0.44510 mW (-3.51542 dBm) Rx Power: 0.10330 mW (-9.85900 dBm) Oper. Status/Control: EEPROM Memory (A2 lower) 0x0100: 4b 00 fb 00 46 00 00 00 : 8d cc 74 04 87 5a 7a 76 0x0110: af c8 27 10 a4 10 2e e0 : 57 73 02 5b 2b d4 05 ea 0x0120: 57 73 00 91 2b d4 01 6b : 00 00 00 00 00 00 00 00 0x0130: 00 00 00 00 00 00 00 00 : 00 00 00 00 00 00 00 00 0x0140: 00 00 00 00 3f 80 00 00 : 00 00 00 00 01 00 00 00 0x0150: 01 00 00 00 01 00 00 00 : 01 00 00 00 00 00 00 3c 0x0160: 24 b0 80 a7 5c c8 11 63 : 04 09 00 00 00 00 00 00 0x0170: 00 00 00 00 00 00 00 00 : 00 00 00 00 00 00 00 01
CLEI Code: COUIA75CAA Part Number: 10-2457-02 (ver.: V02 ) Temp/Alarm/Power Flags: COM, commercial 0C to 70C Minimum Temperature: 0 Maximum Temperature: 70 Calibration Constants: LBC Scale, Temperature, Laser biascurrent, Output power, Product Id: SFP-10G-LR EEPROM Memory (A2 upper) 0x0180: 43 4f 55 49 41 37 35 43 : 41 41 31 30 2d 32 34 35 0x0190: 37 2d 30 32 56 30 32 20 : 01 00 46 00 00 00 00 b0 0x01a0: 00 00 00 00 00 00 00 00 : 00 00 8c dd 94 00 ac a5 0x01b0: d6 cd 00 00 1e 00 50 3e : 11 70 0f 2d 00 00 aa aa 0x01c0: 53 46 50 2d 31 30 47 2d : 4c 52 20 20 20 20 20 20 0x01d0: 20 20 20 20 32 33 00 00 : 00 00 00 00 00 00 00 2e 0x01e0: 20 26 2b 30 33 36 2b 36 : 00 00 00 00 00 00 00 00 0x01f0: 00 00 00 00 00 6b 00 00 : ff ff ff ff 00 00 00 00
Maybe this is the problem ?
On Fri, Jul 26, 2019 at 11:26 AM Klimek, Denis via observium < observium@observium.org> wrote:
@Edvinas: As you see: Your optic is not transmitting any information for those values. Or you entered wrong command on Cisco CLI ;-) Also your debug log from ./discovery is too small. Looks like you removed most of the information....
Mit freundlichem Gruß Stadtwerke Norderstedt
Denis Klimek
Professional Network Engineer IP-Systemtechnik
Tel: 040 / 521 04 – 1049 Mobil: 0151 / 652 219 06
dklimek@stadtwerke-norderstedt.de www.stadtwerke-norderstedt.de
-----Ursprüngliche Nachricht----- Von: observium [mailto:observium-bounces@observium.org] Im Auftrag von emilio brambilla via observium Gesendet: Freitag, 26. Juli 2019 09:20 An: observium@observium.org Cc: emilio brambilla Betreff: Re: [Observium] Question about health graphs on IOS-XR
hello,
On 26/07/2019 08:49, Edvinas Kairys via observium wrote: > hello ! > > /opt/observium/discovery.php -h ny2asr01 -m sensors –d >
don't know if it's the same problem or a different one, but as we have sensors involved I'm adding this:
since 2019-07-14, after upgrade to r9962, our observium instance lost all temperature sensors on all cisco devices (many cisco switch and routers with both ios and iosxr)
it is still graphing other brands devices temperatures.
--
bye,
emilio
observium mailing list observium@observium.org http://postman.memetic.org/cgi-bin/mailman/listinfo/observium _______________________________________________ observium mailing list observium@observium.org http://postman.memetic.org/cgi-bin/mailman/listinfo/observium
observium mailing list observium@observium.org http://postman.memetic.org/cgi-bin/mailman/listinfo/observium
Hmm… looks like that your device is not offering any sensor information. Please try pulling those sensor values by hand with snmpget/snmpwalk to check if your device is offering them.
Otherwise check your SNMP RO settings. Try with: “snmp-server community hiddencommunity RO SystemOwner” and/or upgrade IOS-XR.
Mit freundlichem Gruß Stadtwerke Norderstedt
Denis Klimek
Professional Network Engineer IP-Systemtechnik
Tel: 040 / 521 04 – 1049 Mobil: 0151 / 652 219 06
dklimek@stadtwerke-norderstedt.demailto:dklimek@stadtwerke-norderstedt.de www.stadtwerke-norderstedt.dehttp://www.stadtwerke-norderstedt.de/
Von: observium [mailto:observium-bounces@observium.org] Im Auftrag von Edvinas Kairys via observium Gesendet: Freitag, 26. Juli 2019 14:02 An: Markus Klock Cc: Edvinas Kairys; Observium Network Observation System Betreff: Re: [Observium] Question about health graphs on IOS-XR
here we go:
On Fri, Jul 26, 2019 at 2:39 PM Markus Klock <markus@best-practice.semailto:markus@best-practice.se> wrote: Strange. Its still not running debug mode. Try moving the -d before -m. /Markus
Den fre 26 juli 2019 13:00Edvinas Kairys <edvinas.email@gmail.commailto:edvinas.email@gmail.com> skrev: I think i do OK. https://pastebin.com/y47YPYq8
On Fri, Jul 26, 2019 at 12:52 PM Markus Klock <markus@best-practice.semailto:markus@best-practice.se> wrote: You do not use the right symbol in front of the debug flag. You can see the - is a little bit longer in front of the "-d" in your command which makes it ignore the debug flag. (or this mail just changed font?) Use the -d and put all the output on pastebin or similar as the text output will be huge. /Markus
Den fre 26 juli 2019 10:59Edvinas Kairys via observium <observium@observium.orgmailto:observium@observium.org> skrev: and i hadn't removed anything:
infra [root@observ001prvitx ~]# /opt/observium/discovery.php -h ny2asr01 -m sensors –d
___ _ _ / _ \ | |__ ___ ___ _ __ __ __(_) _ _ _ __ ___ | | | || '_ \ / __| / _ | '__|\ \ / /| || | | || '_ ` _ \ | |_| || |_) |__ | __/| | \ V / | || |_| || | | | | | ___/ |_.__/ |___/ ___||_| _/ |_| __,_||_| |_| |_| Observium Professional 19.7.9962 http://www.observium.org
##### Starting discovery run at 2019-07-26 08:58:30 #####
##### ny2asr01 [362] #####
o OS Type iosxr o OS Group cisco o SNMP Version v3 o Last discovery 2019-07-26 10:41:36 o Last duration 7.97 seconds
##### Module Start: sensors #####
o CISCO-ENTITY-SENSOR-MIB o CISCO-ENVMON-MIB Fans o CISCO-ENTITY-FRU-CONTROL-MIB o CISCO-POWER-ETHERNET-EXT-MIB o POWER-ETHERNET-MIB o ENTITY-SENSOR-MIB o CISCO-RF-MIB cRFCfgRedundancyOperMode [!]cRFStatusUnitState [!]cRFStatusPeerUnitState [!]
o Duration 7.73s
##### ny2asr01 [362] completed discovery modules at 2019-07-26 08:58:38 #####
o Discovery time 7.7355 seconds
##### Finished discovery run at 2019-07-26 08:58:38 #####
o Devices Discovered 1 o Discovery Time 8.008 secs o Memory usage 14MB (peak: 14MB) o MySQL Usage Cell[1/0s] Row[5/0.001s] Rows[36/0.015s] Column[1/0s] Update[1/0.005s] Insert[1/0.004s] Delete[1/0.006s] o RRDTool Usage infra [root@observ001prvitx ~]#
On Fri, Jul 26, 2019 at 11:44 AM Edvinas Kairys <edvinas.email@gmail.commailto:edvinas.email@gmail.com> wrote: it provides, i just need to add keyword named PHY to get those:
show controllers tenGigE 0/0/2/3 phy Fri Jul 26 10:43:13.640 Summer
SFP EEPROM port: 3 Xcvr Type: SFP Xcvr Code: SFP-10G-LR Encoding: 64B66B Bit Rate: 10300 Mbps Link Reach 9u fiber (Km): 10000 meter Link Reach 9u fiber (100m): 10000 meter Vendor Name: CISCO-SUMITOMO Vendor OUI: 00.00.5f Vendor Part Number: SPP5200LR-C6 (rev.: B ) Laser wavelength: 1310 nm (fraction: 0.00 nm) Optional SFP Signal: Tx_Disable, Tx_Fault, LOS Vendor Serial Number: SPC1820003Z Date Code (yy/mm/dd): 14/05/12 lot code: 78 Diagnostic Monitoring: DOM, Int. Cal., Enhanced Options: SW RX LOS Mon., SW TX Fault Mon, SW TX Disable, Alarm/Warning Flags
MSA Data 0x0000: 03 04 07 20 00 00 00 00 : 00 00 00 06 67 00 0a 64 0x0010: 00 00 00 00 43 49 53 43 : 4f 2d 53 55 4d 49 54 4f 0x0020: 4d 4f 20 20 00 00 00 5f : 53 50 50 35 32 30 30 4c 0x0030: 52 2d 43 36 20 20 20 20 : 42 20 20 20 05 1e 00 06 0x0040: 00 1a 00 00 53 50 43 31 : 38 32 30 30 30 33 5a 20 0x0050: 20 20 20 20 31 34 30 35 : 31 32 37 38 68 f0 03 4f 0x0060: 00 00 0b a2 64 ac 18 cb : 55 a5 90 85 ec 03 97 1f 0x0070: 2e b1 97 00 00 00 00 00 : 00 00 00 00 bd 13 55 a4
    Thresholds:                    Alarm High         Warning High
 Warning Low            Alarm Low
          Temperature:            +75.000 C             +70.000 C
     +0.000 C              -5.000 C
              Voltage:           3.630 Volt            3.465 Volt
   3.135 Volt            2.970 Volt
                 Bias:         90.000 mAmps          84.000 mAmps
 24.000 mAmps          20.000 mAmps
       Transmit Power:  2.23870 mW (3.49996 dBm)   1.12200 mW (0.49993
dBm) 0.15140 mW (-8.19874 dBm) 0.06030 mW (-12.19683 dBm) Receive Power: 2.23870 mW (3.49996 dBm) 1.12200 mW (0.49993 dBm) 0.03630 mW (-14.40093 dBm) 0.01450 mW (-18.38632 dBm) Temperature: 36.688 Voltage: 3.293 Volt Tx Bias: 47.504 mAmps Tx Power: 0.44510 mW (-3.51542 dBm) Rx Power: 0.10330 mW (-9.85900 dBm) Oper. Status/Control: EEPROM Memory (A2 lower) 0x0100: 4b 00 fb 00 46 00 00 00 : 8d cc 74 04 87 5a 7a 76 0x0110: af c8 27 10 a4 10 2e e0 : 57 73 02 5b 2b d4 05 ea 0x0120: 57 73 00 91 2b d4 01 6b : 00 00 00 00 00 00 00 00 0x0130: 00 00 00 00 00 00 00 00 : 00 00 00 00 00 00 00 00 0x0140: 00 00 00 00 3f 80 00 00 : 00 00 00 00 01 00 00 00 0x0150: 01 00 00 00 01 00 00 00 : 01 00 00 00 00 00 00 3c 0x0160: 24 b0 80 a7 5c c8 11 63 : 04 09 00 00 00 00 00 00 0x0170: 00 00 00 00 00 00 00 00 : 00 00 00 00 00 00 00 01
    CLEI Code: COUIA75CAA
    Part Number: 10-2457-02 (ver.: V02 )
    Temp/Alarm/Power Flags: COM, commercial 0C to 70C
    Minimum Temperature: 0
    Maximum Temperature: 70
    Calibration Constants: LBC Scale, Temperature, Laser bias current,
Output power, Product Id: SFP-10G-LR EEPROM Memory (A2 upper) 0x0180: 43 4f 55 49 41 37 35 43 : 41 41 31 30 2d 32 34 35 0x0190: 37 2d 30 32 56 30 32 20 : 01 00 46 00 00 00 00 b0 0x01a0: 00 00 00 00 00 00 00 00 : 00 00 8c dd 94 00 ac a5 0x01b0: d6 cd 00 00 1e 00 50 3e : 11 70 0f 2d 00 00 aa aa 0x01c0: 53 46 50 2d 31 30 47 2d : 4c 52 20 20 20 20 20 20 0x01d0: 20 20 20 20 32 33 00 00 : 00 00 00 00 00 00 00 2e 0x01e0: 20 26 2b 30 33 36 2b 36 : 00 00 00 00 00 00 00 00 0x01f0: 00 00 00 00 00 6b 00 00 : ff ff ff ff 00 00 00 00
Maybe this is the problem ?
On Fri, Jul 26, 2019 at 11:26 AM Klimek, Denis via observium <observium@observium.orgmailto:observium@observium.org> wrote: @Edvinas: As you see: Your optic is not transmitting any information for those values. Or you entered wrong command on Cisco CLI ;-) Also your debug log from ./discovery is too small. Looks like you removed most of the information....
Mit freundlichem Gruß Stadtwerke Norderstedt
Denis Klimek
Professional Network Engineer IP-Systemtechnik
Tel: 040 / 521 04 – 1049 Mobil: 0151 / 652 219 06
dklimek@stadtwerke-norderstedt.demailto:dklimek@stadtwerke-norderstedt.de www.stadtwerke-norderstedt.dehttp://www.stadtwerke-norderstedt.de
-----Ursprüngliche Nachricht----- Von: observium [mailto:observium-bounces@observium.orgmailto:observium-bounces@observium.org] Im Auftrag von emilio brambilla via observium Gesendet: Freitag, 26. Juli 2019 09:20 An: observium@observium.orgmailto:observium@observium.org Cc: emilio brambilla Betreff: Re: [Observium] Question about health graphs on IOS-XR
hello,
On 26/07/2019 08:49, Edvinas Kairys via observium wrote:
hello !
/opt/observium/discovery.php -h ny2asr01 -m sensors –d
don't know if it's the same problem or a different one, but as we have sensors involved I'm adding this:
since 2019-07-14, after upgrade to r9962, our observium instance lost all temperature sensors on all cisco devices (many cisco switch and routers with both ios and iosxr)
it is still graphing other brands devices temperatures.
--
bye,
emilio
_______________________________________________ observium mailing list observium@observium.orgmailto:observium@observium.org http://postman.memetic.org/cgi-bin/mailman/listinfo/observium _______________________________________________ observium mailing list observium@observium.orgmailto:observium@observium.org http://postman.memetic.org/cgi-bin/mailman/listinfo/observium _______________________________________________ observium mailing list observium@observium.orgmailto:observium@observium.org http://postman.memetic.org/cgi-bin/mailman/listinfo/observium
Thanks,
Do this setting (snmp-server community hiddencommunity RO SystemOwner) also works for SNMP v3 ?
On Mon, Jul 29, 2019 at 9:31 AM Klimek, Denis < DKlimek@stadtwerke-norderstedt.de> wrote:
Hmm… looks like that your device is not offering any sensor information.
Please try pulling those sensor values by hand with snmpget/snmpwalk to check if your device is offering them.
Otherwise check your SNMP RO settings. Try with: “snmp-server community hiddencommunity RO SystemOwner” and/or upgrade IOS-XR.
Mit freundlichem Gruß
Stadtwerke Norderstedt
*Denis Klimek*
Professional Network Engineer
IP-Systemtechnik
Tel: 040 / 521 04 – 1049
Mobil: 0151 / 652 219 06
dklimek@stadtwerke-norderstedt.de
www.stadtwerke-norderstedt.de
*Von:* observium [mailto:observium-bounces@observium.org] *Im Auftrag von *Edvinas Kairys via observium *Gesendet:* Freitag, 26. Juli 2019 14:02 *An:* Markus Klock *Cc:* Edvinas Kairys; Observium Network Observation System *Betreff:* Re: [Observium] Question about health graphs on IOS-XR
here we go:
On Fri, Jul 26, 2019 at 2:39 PM Markus Klock markus@best-practice.se wrote:
Strange.
Its still not running debug mode.
Try moving the -d before -m.
/Markus
Den fre 26 juli 2019 13:00Edvinas Kairys edvinas.email@gmail.com skrev:
I think i do OK.
On Fri, Jul 26, 2019 at 12:52 PM Markus Klock markus@best-practice.se wrote:
You do not use the right symbol in front of the debug flag. You can see the - is a little bit longer in front of the "-d" in your command which makes it ignore the debug flag. (or this mail just changed font?)
Use the -d and put all the output on pastebin or similar as the text output will be huge.
/Markus
Den fre 26 juli 2019 10:59Edvinas Kairys via observium < observium@observium.org> skrev:
and i hadn't removed anything:
infra [root@observ001prvitx ~]# /opt/observium/discovery.php -h ny2asr01 -m sensors –d
/ _ \ | |__ ___ ___ _ __ __ __(_) _ _ _ __ ___ | | | || '_ \ / __| / _ | '__|\ \ / /| || | | || '_ ` _ \ | |_| || |_) |__ | __/| | \ V / | || |_| || | | | | | ___/ |_.__/ |___/ ___||_| _/ |_| __,_||_| |_| |_| Observium Professional 19.7.9962 http://www.observium.org
##### Starting discovery run at 2019-07-26 08:58:30 #####
##### ny2asr01 [362] #####
o OS Type iosxr o OS Group cisco o SNMP Version v3 o Last discovery 2019-07-26 10:41:36 o Last duration 7.97 seconds
##### Module Start: sensors #####
o CISCO-ENTITY-SENSOR-MIB o CISCO-ENVMON-MIB Fans o CISCO-ENTITY-FRU-CONTROL-MIB o CISCO-POWER-ETHERNET-EXT-MIB o POWER-ETHERNET-MIB o ENTITY-SENSOR-MIB o CISCO-RF-MIB cRFCfgRedundancyOperMode [!]cRFStatusUnitState [!]cRFStatusPeerUnitState [!]
o Duration 7.73s
##### ny2asr01 [362] completed discovery modules at 2019-07-26 08:58:38 #####
o Discovery time 7.7355 seconds
##### Finished discovery run at 2019-07-26 08:58:38 #####
o Devices Discovered 1 o Discovery Time 8.008 secs o Memory usage 14MB (peak: 14MB) o MySQL Usage Cell[1/0s] Row[5/0.001s] Rows[36/0.015s] Column[1/0s] Update[1/0.005s] Insert[1/0.004s] Delete[1/0.006s] o RRDTool Usage infra [root@observ001prvitx ~]#
On Fri, Jul 26, 2019 at 11:44 AM Edvinas Kairys edvinas.email@gmail.com wrote:
it provides, i just need to add keyword named *PHY *to get those:
show controllers tenGigE 0/0/2/3 *phy* Fri Jul 26 10:43:13.640 Summer
SFP EEPROM port: 3 Xcvr Type: SFP Xcvr Code: SFP-10G-LR Encoding: 64B66B Bit Rate: 10300 Mbps Link Reach 9u fiber (Km): 10000 meter Link Reach 9u fiber (100m): 10000 meter Vendor Name: CISCO-SUMITOMO Vendor OUI: 00.00.5f Vendor Part Number: SPP5200LR-C6 (rev.: B ) Laser wavelength: 1310 nm (fraction: 0.00 nm) Optional SFP Signal: Tx_Disable, Tx_Fault, LOS Vendor Serial Number: SPC1820003Z Date Code (yy/mm/dd): 14/05/12 lot code: 78 Diagnostic Monitoring: DOM, Int. Cal., Enhanced Options: SW RX LOS Mon., SW TX Fault Mon, SW TX Disable, Alarm/Warning Flags
MSA Data 0x0000: 03 04 07 20 00 00 00 00 : 00 00 00 06 67 00 0a 64 0x0010: 00 00 00 00 43 49 53 43 : 4f 2d 53 55 4d 49 54 4f 0x0020: 4d 4f 20 20 00 00 00 5f : 53 50 50 35 32 30 30 4c 0x0030: 52 2d 43 36 20 20 20 20 : 42 20 20 20 05 1e 00 06 0x0040: 00 1a 00 00 53 50 43 31 : 38 32 30 30 30 33 5a 20 0x0050: 20 20 20 20 31 34 30 35 : 31 32 37 38 68 f0 03 4f 0x0060: 00 00 0b a2 64 ac 18 cb : 55 a5 90 85 ec 03 97 1f 0x0070: 2e b1 97 00 00 00 00 00 : 00 00 00 00 bd 13 55 a4
Thresholds: Alarm High Warning High Warning Low Alarm Low Temperature: +75.000 C +70.000 C +0.000 C -5.000 C Voltage: 3.630 Volt 3.465 Volt 3.135 Volt 2.970 Volt Bias: 90.000 mAmps 84.000 mAmps 24.000 mAmps 20.000 mAmps Transmit Power: 2.23870 mW (3.49996 dBm) 1.12200 mW (0.49993dBm) 0.15140 mW (-8.19874 dBm) 0.06030 mW (-12.19683 dBm) Receive Power: 2.23870 mW (3.49996 dBm) 1.12200 mW (0.49993 dBm) 0.03630 mW (-14.40093 dBm) 0.01450 mW (-18.38632 dBm) Temperature: 36.688 Voltage: 3.293 Volt Tx Bias: 47.504 mAmps Tx Power: 0.44510 mW (-3.51542 dBm) Rx Power: 0.10330 mW (-9.85900 dBm) Oper. Status/Control: EEPROM Memory (A2 lower) 0x0100: 4b 00 fb 00 46 00 00 00 : 8d cc 74 04 87 5a 7a 76 0x0110: af c8 27 10 a4 10 2e e0 : 57 73 02 5b 2b d4 05 ea 0x0120: 57 73 00 91 2b d4 01 6b : 00 00 00 00 00 00 00 00 0x0130: 00 00 00 00 00 00 00 00 : 00 00 00 00 00 00 00 00 0x0140: 00 00 00 00 3f 80 00 00 : 00 00 00 00 01 00 00 00 0x0150: 01 00 00 00 01 00 00 00 : 01 00 00 00 00 00 00 3c 0x0160: 24 b0 80 a7 5c c8 11 63 : 04 09 00 00 00 00 00 00 0x0170: 00 00 00 00 00 00 00 00 : 00 00 00 00 00 00 00 01
CLEI Code: COUIA75CAA Part Number: 10-2457-02 (ver.: V02 ) Temp/Alarm/Power Flags: COM, commercial 0C to 70C Minimum Temperature: 0 Maximum Temperature: 70 Calibration Constants: LBC Scale, Temperature, Laser bias current,Output power, Product Id: SFP-10G-LR EEPROM Memory (A2 upper) 0x0180: 43 4f 55 49 41 37 35 43 : 41 41 31 30 2d 32 34 35 0x0190: 37 2d 30 32 56 30 32 20 : 01 00 46 00 00 00 00 b0 0x01a0: 00 00 00 00 00 00 00 00 : 00 00 8c dd 94 00 ac a5 0x01b0: d6 cd 00 00 1e 00 50 3e : 11 70 0f 2d 00 00 aa aa 0x01c0: 53 46 50 2d 31 30 47 2d : 4c 52 20 20 20 20 20 20 0x01d0: 20 20 20 20 32 33 00 00 : 00 00 00 00 00 00 00 2e 0x01e0: 20 26 2b 30 33 36 2b 36 : 00 00 00 00 00 00 00 00 0x01f0: 00 00 00 00 00 6b 00 00 : ff ff ff ff 00 00 00 00
Maybe this is the problem ?
On Fri, Jul 26, 2019 at 11:26 AM Klimek, Denis via observium < observium@observium.org> wrote:
@Edvinas: As you see: Your optic is not transmitting any information for those values. Or you entered wrong command on Cisco CLI ;-) Also your debug log from ./discovery is too small. Looks like you removed most of the information....
Mit freundlichem Gruß Stadtwerke Norderstedt
Denis Klimek
Professional Network Engineer IP-Systemtechnik
Tel: 040 / 521 04 – 1049 Mobil: 0151 / 652 219 06
dklimek@stadtwerke-norderstedt.de www.stadtwerke-norderstedt.de
-----Ursprüngliche Nachricht----- Von: observium [mailto:observium-bounces@observium.org] Im Auftrag von emilio brambilla via observium Gesendet: Freitag, 26. Juli 2019 09:20 An: observium@observium.org Cc: emilio brambilla Betreff: Re: [Observium] Question about health graphs on IOS-XR
hello,
On 26/07/2019 08:49, Edvinas Kairys via observium wrote:
hello !
/opt/observium/discovery.php -h ny2asr01 -m sensors –d
don't know if it's the same problem or a different one, but as we have sensors involved I'm adding this:
since 2019-07-14, after upgrade to r9962, our observium instance lost all temperature sensors on all cisco devices (many cisco switch and routers with both ios and iosxr)
it is still graphing other brands devices temperatures.
--
bye,
emilio
observium mailing list observium@observium.org http://postman.memetic.org/cgi-bin/mailman/listinfo/observium _______________________________________________ observium mailing list observium@observium.org http://postman.memetic.org/cgi-bin/mailman/listinfo/observium
observium mailing list observium@observium.org http://postman.memetic.org/cgi-bin/mailman/listinfo/observium
I don‘t think so.
Mit freundlichem Gruß Stadtwerke Norderstedt
Denis Klimek
Professional Network Engineer IP-Systemtechnik
Tel: 040 / 521 04 – 1049 Mobil: 0151 / 652 219 06
dklimek@stadtwerke-norderstedt.demailto:dklimek@stadtwerke-norderstedt.de www.stadtwerke-norderstedt.dehttp://www.stadtwerke-norderstedt.de/
Von: Edvinas Kairys [mailto:edvinas.email@gmail.com] Gesendet: Montag, 29. Juli 2019 09:15 An: Klimek, Denis Cc: Observium; Markus Klock Betreff: Re: [Observium] Question about health graphs on IOS-XR
Thanks,
Do this setting (snmp-server community hiddencommunity RO SystemOwner) also works for SNMP v3 ?
On Mon, Jul 29, 2019 at 9:31 AM Klimek, Denis <DKlimek@stadtwerke-norderstedt.demailto:DKlimek@stadtwerke-norderstedt.de> wrote: Hmm… looks like that your device is not offering any sensor information. Please try pulling those sensor values by hand with snmpget/snmpwalk to check if your device is offering them.
Otherwise check your SNMP RO settings. Try with: “snmp-server community hiddencommunity RO SystemOwner” and/or upgrade IOS-XR.
Mit freundlichem Gruß Stadtwerke Norderstedt
Denis Klimek
Professional Network Engineer IP-Systemtechnik
Tel: 040 / 521 04 – 1049 Mobil: 0151 / 652 219 06
dklimek@stadtwerke-norderstedt.demailto:dklimek@stadtwerke-norderstedt.de www.stadtwerke-norderstedt.dehttp://www.stadtwerke-norderstedt.de/
Von: observium [mailto:observium-bounces@observium.orgmailto:observium-bounces@observium.org] Im Auftrag von Edvinas Kairys via observium Gesendet: Freitag, 26. Juli 2019 14:02 An: Markus Klock Cc: Edvinas Kairys; Observium Network Observation System Betreff: Re: [Observium] Question about health graphs on IOS-XR
here we go:
On Fri, Jul 26, 2019 at 2:39 PM Markus Klock <markus@best-practice.semailto:markus@best-practice.se> wrote: Strange. Its still not running debug mode. Try moving the -d before -m. /Markus
Den fre 26 juli 2019 13:00Edvinas Kairys <edvinas.email@gmail.commailto:edvinas.email@gmail.com> skrev: I think i do OK. https://pastebin.com/y47YPYq8
On Fri, Jul 26, 2019 at 12:52 PM Markus Klock <markus@best-practice.semailto:markus@best-practice.se> wrote: You do not use the right symbol in front of the debug flag. You can see the - is a little bit longer in front of the "-d" in your command which makes it ignore the debug flag. (or this mail just changed font?) Use the -d and put all the output on pastebin or similar as the text output will be huge. /Markus
Den fre 26 juli 2019 10:59Edvinas Kairys via observium <observium@observium.orgmailto:observium@observium.org> skrev: and i hadn't removed anything:
infra [root@observ001prvitx ~]# /opt/observium/discovery.php -h ny2asr01 -m sensors –d
___ _ _ / _ \ | |__ ___ ___ _ __ __ __(_) _ _ _ __ ___ | | | || '_ \ / __| / _ | '__|\ \ / /| || | | || '_ ` _ \ | |_| || |_) |__ | __/| | \ V / | || |_| || | | | | | ___/ |_.__/ |___/ ___||_| _/ |_| __,_||_| |_| |_| Observium Professional 19.7.9962 http://www.observium.org
##### Starting discovery run at 2019-07-26 08:58:30 #####
##### ny2asr01 [362] #####
o OS Type iosxr o OS Group cisco o SNMP Version v3 o Last discovery 2019-07-26 10:41:36 o Last duration 7.97 seconds
##### Module Start: sensors #####
o CISCO-ENTITY-SENSOR-MIB o CISCO-ENVMON-MIB Fans o CISCO-ENTITY-FRU-CONTROL-MIB o CISCO-POWER-ETHERNET-EXT-MIB o POWER-ETHERNET-MIB o ENTITY-SENSOR-MIB o CISCO-RF-MIB cRFCfgRedundancyOperMode [!]cRFStatusUnitState [!]cRFStatusPeerUnitState [!]
o Duration 7.73s
##### ny2asr01 [362] completed discovery modules at 2019-07-26 08:58:38 #####
o Discovery time 7.7355 seconds
##### Finished discovery run at 2019-07-26 08:58:38 #####
o Devices Discovered 1 o Discovery Time 8.008 secs o Memory usage 14MB (peak: 14MB) o MySQL Usage Cell[1/0s] Row[5/0.001s] Rows[36/0.015s] Column[1/0s] Update[1/0.005s] Insert[1/0.004s] Delete[1/0.006s] o RRDTool Usage infra [root@observ001prvitx ~]#
On Fri, Jul 26, 2019 at 11:44 AM Edvinas Kairys <edvinas.email@gmail.commailto:edvinas.email@gmail.com> wrote: it provides, i just need to add keyword named PHY to get those:
show controllers tenGigE 0/0/2/3 phy Fri Jul 26 10:43:13.640 Summer
SFP EEPROM port: 3 Xcvr Type: SFP Xcvr Code: SFP-10G-LR Encoding: 64B66B Bit Rate: 10300 Mbps Link Reach 9u fiber (Km): 10000 meter Link Reach 9u fiber (100m): 10000 meter Vendor Name: CISCO-SUMITOMO Vendor OUI: 00.00.5f Vendor Part Number: SPP5200LR-C6 (rev.: B ) Laser wavelength: 1310 nm (fraction: 0.00 nm) Optional SFP Signal: Tx_Disable, Tx_Fault, LOS Vendor Serial Number: SPC1820003Z Date Code (yy/mm/dd): 14/05/12 lot code: 78 Diagnostic Monitoring: DOM, Int. Cal., Enhanced Options: SW RX LOS Mon., SW TX Fault Mon, SW TX Disable, Alarm/Warning Flags
MSA Data 0x0000: 03 04 07 20 00 00 00 00 : 00 00 00 06 67 00 0a 64 0x0010: 00 00 00 00 43 49 53 43 : 4f 2d 53 55 4d 49 54 4f 0x0020: 4d 4f 20 20 00 00 00 5f : 53 50 50 35 32 30 30 4c 0x0030: 52 2d 43 36 20 20 20 20 : 42 20 20 20 05 1e 00 06 0x0040: 00 1a 00 00 53 50 43 31 : 38 32 30 30 30 33 5a 20 0x0050: 20 20 20 20 31 34 30 35 : 31 32 37 38 68 f0 03 4f 0x0060: 00 00 0b a2 64 ac 18 cb : 55 a5 90 85 ec 03 97 1f 0x0070: 2e b1 97 00 00 00 00 00 : 00 00 00 00 bd 13 55 a4
Thresholds: Alarm High Warning High Warning Low Alarm Low Temperature: +75.000 C +70.000 C +0.000 C -5.000 C Voltage: 3.630 Volt 3.465 Volt 3.135 Volt 2.970 Volt Bias: 90.000 mAmps 84.000 mAmps 24.000 mAmps 20.000 mAmps Transmit Power: 2.23870 mW (3.49996 dBm) 1.12200 mW (0.49993 dBm) 0.15140 mW (-8.19874 dBm) 0.06030 mW (-12.19683 dBm) Receive Power: 2.23870 mW (3.49996 dBm) 1.12200 mW (0.49993 dBm) 0.03630 mW (-14.40093 dBm) 0.01450 mW (-18.38632 dBm) Temperature: 36.688 Voltage: 3.293 Volt Tx Bias: 47.504 mAmps Tx Power: 0.44510 mW (-3.51542 dBm) Rx Power: 0.10330 mW (-9.85900 dBm) Oper. Status/Control: EEPROM Memory (A2 lower) 0x0100: 4b 00 fb 00 46 00 00 00 : 8d cc 74 04 87 5a 7a 76 0x0110: af c8 27 10 a4 10 2e e0 : 57 73 02 5b 2b d4 05 ea 0x0120: 57 73 00 91 2b d4 01 6b : 00 00 00 00 00 00 00 00 0x0130: 00 00 00 00 00 00 00 00 : 00 00 00 00 00 00 00 00 0x0140: 00 00 00 00 3f 80 00 00 : 00 00 00 00 01 00 00 00 0x0150: 01 00 00 00 01 00 00 00 : 01 00 00 00 00 00 00 3c 0x0160: 24 b0 80 a7 5c c8 11 63 : 04 09 00 00 00 00 00 00 0x0170: 00 00 00 00 00 00 00 00 : 00 00 00 00 00 00 00 01
CLEI Code: COUIA75CAA Part Number: 10-2457-02 (ver.: V02 ) Temp/Alarm/Power Flags: COM, commercial 0C to 70C Minimum Temperature: 0 Maximum Temperature: 70 Calibration Constants: LBC Scale, Temperature, Laser bias current, Output power, Product Id: SFP-10G-LR EEPROM Memory (A2 upper) 0x0180: 43 4f 55 49 41 37 35 43 : 41 41 31 30 2d 32 34 35 0x0190: 37 2d 30 32 56 30 32 20 : 01 00 46 00 00 00 00 b0 0x01a0: 00 00 00 00 00 00 00 00 : 00 00 8c dd 94 00 ac a5 0x01b0: d6 cd 00 00 1e 00 50 3e : 11 70 0f 2d 00 00 aa aa 0x01c0: 53 46 50 2d 31 30 47 2d : 4c 52 20 20 20 20 20 20 0x01d0: 20 20 20 20 32 33 00 00 : 00 00 00 00 00 00 00 2e 0x01e0: 20 26 2b 30 33 36 2b 36 : 00 00 00 00 00 00 00 00 0x01f0: 00 00 00 00 00 6b 00 00 : ff ff ff ff 00 00 00 00
Maybe this is the problem ?
On Fri, Jul 26, 2019 at 11:26 AM Klimek, Denis via observium <observium@observium.orgmailto:observium@observium.org> wrote: @Edvinas: As you see: Your optic is not transmitting any information for those values. Or you entered wrong command on Cisco CLI ;-) Also your debug log from ./discovery is too small. Looks like you removed most of the information....
Mit freundlichem Gruß Stadtwerke Norderstedt
Denis Klimek
Professional Network Engineer IP-Systemtechnik
Tel: 040 / 521 04 – 1049 Mobil: 0151 / 652 219 06
dklimek@stadtwerke-norderstedt.demailto:dklimek@stadtwerke-norderstedt.de www.stadtwerke-norderstedt.dehttp://www.stadtwerke-norderstedt.de
-----Ursprüngliche Nachricht----- Von: observium [mailto:observium-bounces@observium.orgmailto:observium-bounces@observium.org] Im Auftrag von emilio brambilla via observium Gesendet: Freitag, 26. Juli 2019 09:20 An: observium@observium.orgmailto:observium@observium.org Cc: emilio brambilla Betreff: Re: [Observium] Question about health graphs on IOS-XR
hello,
On 26/07/2019 08:49, Edvinas Kairys via observium wrote:
hello !
/opt/observium/discovery.php -h ny2asr01 -m sensors –d
don't know if it's the same problem or a different one, but as we have sensors involved I'm adding this:
since 2019-07-14, after upgrade to r9962, our observium instance lost all temperature sensors on all cisco devices (many cisco switch and routers with both ios and iosxr)
it is still graphing other brands devices temperatures.
--
bye,
emilio
_______________________________________________ observium mailing list observium@observium.orgmailto:observium@observium.org http://postman.memetic.org/cgi-bin/mailman/listinfo/observium _______________________________________________ observium mailing list observium@observium.orgmailto:observium@observium.org http://postman.memetic.org/cgi-bin/mailman/listinfo/observium _______________________________________________ observium mailing list observium@observium.orgmailto:observium@observium.org http://postman.memetic.org/cgi-bin/mailman/listinfo/observium
participants (4)
-
 Edvinas Kairys
 -
 emilio brambilla
 -
 Klimek, Denis
 -
 Markus Klock